
ABSTRACT
Relative to the rest of the United States, the region of southwestern Pennsylvania, including metropolitan Pittsburgh, experiences high ambient concentrations of fine particulate matter (PM2.5), which is known to be associated with adverse respiratory and cardiovascular health impacts. This study evaluates whether the closing of three coal-fired power plants within the southwestern Pennsylvania region resulted in a significant decrease in PM2.5 concentration. Both PM2.5 data obtained from EPA ground stations in the study region and aerosol optical depth (AOD) data retrieved from the Moderate Resolution Imaging Spectroradiometer (MODIS) instruments onboard the Terra and Aqua satellites were used to investigate regional air quality from January 2011 through December 2014. The impact of the plant closings on PM2.5 concentration and AOD was evaluated using a series of generalized additive models. The model results show that monthly fuel consumption of the Elrama plant, which closed in October of 2012, and monthly fuel consumption of both the Mitchell and Hatfield’s Ferry plants, which closed in October of 2013, were significant predictors of both PM2.5 concentration and AOD at EPA ground stations in the study region, after controlling for multiple meteorological factors and long-term, region-wide air quality improvements. The model’s power to predict PM2.5 concentration increased from an adjusted R2 of 0.61 to 0.68 after excluding data from ground stations with higher uncertainty due to recent increases in unconventional natural gas extraction activities. After preliminary analyses of mean PM2.5 concentration and AOD showed a downward trend following each power plant shutdown, results from a series of generalized additive models confirmed that the activity of the three plants that closed, measured by monthly fuel consumption, was highly significant in predicting both AOD and PM2.5 at 12 EPA ground stations; further research on PM2.5 emissions from unconventional natural gas extraction is needed.
Implications: With many coal-fired power plants scheduled to close across the United States in the coming years, there is interest in the potential impact on regional PM2.5 concentrations. In southwestern Pennsylvania, recent coal-fired power plant closings were coupled with a boom in unconventional natural gas extraction. Natural gas is currently seen as an economically viable bridge fuel between coal and renewable energy. This study provides policymakers with more information on the potential ambient concentration changes associated with coal-fired power plant closings as the nation’s energy reliance shifts toward natural gas.
Introduction
Fine particulate matter (PM2.5), airborne particles with aerodynamic diameters less than or equal to 2.5 µm, is emitted directly from natural and anthropogenic sources, and produced secondarily from chemical reactions involving gas-phase pollutant precursors (Godish, Citation2004). Elevated PM2.5 concentrations in the ambient air can have detrimental health impacts. A 2009 study of 51 American metropolitan areas found that a decrease of 10 µg/m3 in PM2.5 concentration was associated with a 0.61 ± 0.20 yr increase in life expectancy (Pope, Ezzati, and Dockery, Citation2009). PM2.5 exposure has been shown to have adverse effects on cardiopulmonary and cardiovascular health (Laden et al., Citation2006; Ostro et al., Citation2010; Pope et al., Citation2002; Puett et al., Citation2009). The risk of cerebrovascular events among postmenopausal American women was also found to be associated with increased levels of PM2.5 (HR = 1.35; 95% confidence interval [CI], 1.08–1.68) (Miller et al., Citation2007). Those suffering from asthma, chronic obstructive pulmonary disease, pneumonia, other respiratory diseases, cardiovascular diseases, or diabetes are especially vulnerable to the negative health effects of fine particulate matter (Kappos et al., Citation2004).
The Clean Air Task Force, a nonprofit organization dedicated to reducing air pollution, estimates that the number of deaths attributable to PM2.5 pollution from U.S. power plants has dropped from exceeding 24,000 in year 2004 to exceeding 7,500 in year 2014 (Clean Air Task Force, Citation2012). Certain areas of the country, such as southwestern Pennsylvania, have been assigned a high number of estimated annual deaths attributable to PM2.5 power plant pollution. As of 2012, Allegheny County, where Pittsburgh’s population of more than 305,500 resides (U.S. Census Bureau, Citationn.d.), is estimated to experience 10 to 14 deaths per 100,000 people every year from exposure to power plant PM2.5 emissions. The surrounding counties of Washington, Greene, Fayette, Butler, and Beaver have the same mortality estimate from PM2.5 power plant emissions as Allegheny County. Westmoreland and Armstrong counties, located to the east of Allegheny, were assigned the highest estimate of mortality attributable to PM2.5 power plant emissions, which is greater than 14 deaths per 100,000 people each year. Pittsburgh’s estimated mortality is high even when compared to similar urban areas. The counties containing Lexington, KY, and St. Louis, MO—land-locked cities of comparable population size to Pittsburgh—both have estimates of only 3 to 7 deaths per 100,000 people every year from power plant PM2.5 emissions. Relatively high mortality estimates in southwestern Pennsylvania warrant a more thorough investigation of the impact of coal-fired-power plants on the region’s air quality (Clean Air Task Force, Citation2012).
Ambient air pollutants released by coal-fired power plants include sulfur dioxide (SO2), nitrogen oxides (NOx), carbon dioxide, hydrocarbons, and particulate matter (PM), including secondary sulfates and nitrates (Barrett et al., Citation2011). According to the state’s facility emissions report, more than one-third of the PM2.5 emissions in southwestern Pennsylvania from the year 2013 can be attributed to two coal-fired power plants that closed in October of that year (Pennsylvania Department of Environmental Protection, Citationn.d.-a). Pittsburgh’s air quality also suffers due to the high number of coal-burning sources in the Ohio River Valley. Ground-level concentrations of many pollutants, including acid aerosols, are higher in Pittsburgh when ground-level wind direction vectors indicate that wind is coming from the southwest (McCurdy et al., Citation1999).
Recently, many coal-fired power plants across the United States have either closed or been scheduled to close for multiple reasons, including the decision by some against investing in control technologies required for continued operation, insufficient growth in electricity demand, and competition with natural gas energy providers (Johnson, Citation2014). Two coal-fired power plants and one combined coal/oil plant have closed near Pittsburgh (Disavino, Citation2013; Fontaine and Zemba, Citation2013). Allegheny County’s Elrama power plant, a coal-fired plant with a nameplate capacity of 510 MW (U.S. Energy Information Administration, Citation2011) located less than 22 km south of the city’s center, was the first to close, in October 2012 (Fontaine and Zemba, Citation2013). Washington County’s Mitchell power plant, a combined coal/oil plant (Disavino, Citation2013) less than 25 km from Pittsburgh with a nameplate capacity of 374 MW (U.S. Energy Information Administration, Citation2011), closed in October 2013 (Ferris, Citation2013). Hatfield’s Ferry power plant, located less than 65 km south of Pittsburgh in Greene County, closed at the same time (Ferris, Citation2013), shuttering a nameplate capacity of 1728 MW (U.S. Energy Information Administration, Citation2011). Elrama power plant and Mitchell power plant were each made up of four units, and Hatfield’s Ferry power plant had three units (U.S. Environmental Protection Agency, Citationn.d.-c). Every plant was equipped with electrostatic precipitators (ESPs), to reduce particulate matter pollution, wet limestone for flue gas desulfurization, and low NOx burner technology (U.S. Environmental Protection Agency, Citationn.d.-c). In addition to the aforementioned controls, Elrama had wet scrubbers to aid in flue gas desulfurization and cyclones to improve PM control, and used selective noncatalytic reduction to improve NOx control (U.S. Environmental Protection Agency, Citationn.d.-c). Hatfield’s Ferry used over-fire air in concert with low NOx burner technology (U.S. Environmental Protection Agency, Citationn.d.-c). Air Markets Program data on facility attributes show that there have been no changes in control technologies used at any of the three plants since 2009 (US Environmental Protection Agency, Citationn.d.-c).
The United States’ recent shift in energy reliance from coal to natural gas has led to much controversy over the unconventional methods currently used to extract gas from the Marcellus Shale region. In 2012, the U.S. Energy Information Administration estimated that the Marcellus contains 141 trillion cubic feet (tcf) of recoverable natural gas (U.S. Energy Information Administration, Citation2012). The drilling industry has adopted two unconventional technologies: hydraulic fracturing, or hydrofracking, to improve gas flow from the formation; and horizontal drilling to access a greater volume of the vertically thin, yet horizontally expansive, resource (Duggan-Haas et al., Citation2013). In 2014, 4.07 tcf of natural gas was extracted from the state by unconventional methods (Pennsylvania Department of Environmental Protection, Citationn.d.-b). According to Litovitz et al., PM2.5 emissions from unconventional natural gas extraction, though nontrivial, are still small in comparison to emissions from coal-fired power plants (Litovitz et al., Citation2013).
Previous natural experiments concerning air pollution have been useful in informing public health policy (Craig et al., Citation2012). The 1990 ban of coal sales in Dublin reduced the black smoke concentration by 35.6 µg/m3, or 70%, and was estimated to prevent 116 respiratory deaths and 243 cardiovascular deaths each year after the ban (Clancy et al., Citation2002). In addition, comparing periods of operation to periods closed for repair revealed that the Boardman power plant contributed an average of 0.90 µg/m3 of PM2.5 to the Columbia River Gorge National Scenic Area (Jaffe and Reidmiller, Citation2009). The recent closings of three coal-fired power plants near Pittsburgh, PA, offer a unique opportunity to assess their impact on the regional ambient PM2.5 concentration through a natural experiment.
In this study, PM2.5 concentration data from EPA ground stations in the study domain were analyzed and supplemented with aerosol optical depth (AOD) data from Moderate Resolution Imaging Spectroradiometer (MODIS) instruments onboard the Aqua and Terra satellites. AOD data have proven to be very useful in predicting PM2.5 concentrations. A previous study showed that a model including AOD as a parameter was more successful in predicting PM2.5 than a model that only accounted for meteorological and land use information (Liu, Paciorek, and Koutrakis, Citation2009). AOD data retrieved from MODIS instruments tend to have better predictive power in the eastern United States than in the western United States (Green et al., Citation2009). Satellite remote sensing data have acted as extensions to ground station networks for regional air quality studies located in St. Louis, MO; Boston, MA; the Atlanta, GA metro area; and Bondville, IL (Green et al., Citation2009; Hu et al., Citation2013; Liu et al., Citation2007; Liu, Paciorek, and Koutrakis, Citation2009).
The first objective of this paper is to use a generalized additive model (GAM) controlling for meteorological variables and long-term, region-wide air quality improvements to determine whether the closure of Elrama power plant in October 2012 and the closure of Mitchell and Hatfield’s Ferry power plants in October 2013 significantly lowered the regional ambient PM2.5 concentration, despite possible interference from unconventional natural gas extraction activities. The second objective is to compare the EPA ground station data GAM results to GAM results produced using satellite-retrieved AOD data as the dependent variable.
Data and methods
The data sets used in this study consist of remotely sensed aerosol optical depth (AOD), ground-measured fine particulate matter (PM2.5), recorded monthly fuel consumption for electricity from each power plant, ground-measured volumes of unconventionally extracted natural gas, and a combination of ground and satellite observations for specific humidity, temperature, and wind vectors throughout the study region. Analyses were done in SAS version 9.4 (Cary, NC) and R version 3.2.3.
Study domain and time period
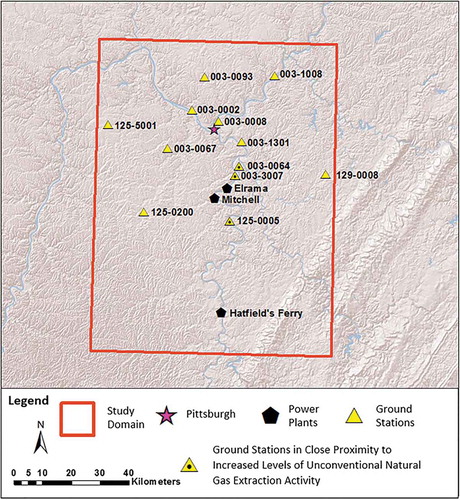
The study domain was defined by the three coal-fired power plants (i.e., Elrama, Mitchell, and Hatfield’s Ferry) closest to Pittsburgh (40.4397° N, 79.9764° W) that have shut down since the beginning of the study period in 2011. The study time period begins in 2011 in order to exclude large decreases in coal-fired power plant emissions that were due to the nationwide recession. Between 2008 and 2009, CO2 emissions from the U.S. power sector decreased by 8.76% due to a combination of decreased power generation and the use of gas in place of coal (Lu, Salovaara, and McElroy, Citation2012). Although the recession may have had long-lasting impacts on emissions, the most dramatic effects were observed prior to 2011. The domain is a 1° × 1° square that is centered on Mitchell Power Station: 40.221° N, 79.969° W (Source Watch, Citationn.d.). It contains the metropolitan Pittsburgh area in the north, and a portion of the Appalachian Mountains in the southeast corner ().
Figure 1. Topographical map of study domain with EPA ground stations.
Remote sensing data
Collection 6 level 2 AOD data were downloaded for the study area from the MODIS instruments aboard the Terra and Aqua satellites using http://ladsweb.nascom.nasa.gov/data (Goddard Space Flight Center, Citationn.d.). The Terra satellite passes the study region at approximately 10:15 a.m., and the Aqua satellite passes the study region at approximately 1:45 p.m.; both satellites are sun-synchronous and carry MODIS instruments (National Aeronautics and Space Administration, Citationn.d.-a; National Aeronautics and Space Administration, Citationn.d.-b).
MODIS acquires data in 36 spectral bands (National Aeronautics and Space Administration, Citationn.d.-c) and uses spectral relationships between its blue (470 nm), red (660 nm), and shortwave infrared (2.13 µm) wavelength bands to retrieve aerosol information over land (Levy et al., Citation2013). AOD is a unitless, column-integrated measurement of aerosol loading that can be used to estimate ground-level PM2.5 measurements (Liu, Paciorek, and Koutrakis, Citation2009). Cloud-free conditions and low surface reflectance from ice or snow on the ground are required in order to retrieve AOD measurements from MODIS; these conditions are often associated with well-mixed boundary layers, low relative humidity, low wind speed, and high air temperature (Liu, Paciorek, and Koutrakis, Citation2009).
The new MODIS AOD parameter, which combines Deep Blue (Sayer et al., Citation2013) and Dark Target retrievals (Levy et al., Citation2013), was used over the Pittsburgh study area for the years 2011–2014. Since the actual pixel size of MODIS data varies in space, the 12-km resolution Community Multiscale Air Quality (CMAQ) grid was used as a base modeling grid (Lee and Schachter, Citation1980; Turner, Citation2015), resulting in little sacrifice of resolution (Hu et al., Citation2013). Eighty-four CMAQ grid cells were at least partially included in the designated study region, and are shown in . Monthly average AOD estimates were calculated for each grid cell, from both the Terra and the Aqua MODIS data. In order to balance the influence of each sensor, seasonal ratios (Terra AOD/Aqua AOD) were calculated from grid cell observations where both Aqua and Terra AOD estimates were available (Lee et al., Citation2011). These seasonal ratios were then used for cross-filling: missing Terra or missing Aqua AOD data at grid cells that had only one of the two satellite data sources available were estimated according to the seasonal ratios. Finally, the Aqua and Terra AOD monthly values were averaged together at each grid cell to produce monthly combined AOD values. The AOD data were used to complement the EPA ground station data and provide better spatial coverage of the study region.
A previous study of the spatial and temporal variability of daily PM2.5 concentrations in Massachusetts showed that a model including AOD data had higher predictive power (R2 = 0.79) than a similar model without AOD (R2 = 0.48) (Liu, Paciorek, and Koutrakis, Citation2009). The study also found that AOD model predictions of ambient PM2.5 concentration are 0.8–0.9 μg/m3 higher than non-AOD model predictions (Liu, Paciorek, and Koutrakis, Citation2009). This difference is likely due to having the most missing AOD values in the winter. While AOD data provide the benefit of greater spatial resolution, data collected by ground monitors are especially useful in the winter months, when AOD data often have a high frequency of missing values.
EPA ground station data
Average daily ground-level PM2.5 concentration measurements from 12 EPA ground stations were downloaded from http://www.epa.gov/airdata/ad_data_daily.html for 2011–2014 (U.S. Environmental Protection Agency, Citationn.d.-a). Eight stations with the following county-site IDs were located in Allegheny County, which contains the city of Pittsburgh: 003-0002, 003-0008, 003-0064, 003-0067, 003-0093, 003-1008, 003-1301, and 003-3007. Three stations were located in Washington County: 125-0005, 125-0200, and 125-5001; and one station was located in Westmoreland County: 129-0008. Station locations are displayed in . One station (125-5200) was excluded from the study because it only provided data from August 2012 until June 2014.
Fuel consumption data
Observed monthly fuel consumption data, measured in MMBtu for each of the three power plants, were retrieved from the “Electric Power Generation and Fuel Consumption, Stocks, and Receipts Monthly Time Series Data” report (U.S. Energy Information Administration, Citation2011). Since Mitchell and Hatfield’s Ferry closed at the same time and had similar time-series patterns, their monthly fuel consumption data were summed together and treated as one variable, separate from the fuel consumption variable for Elrama, which closed a year earlier. In addition, Mitchell and Hatfield’s Ferry were owned and operated by the same companies, Allegheny Energy and First Generation Corporation, while Elrama was owned and operated by GenOn Power Midwest, LP, and NRG Power Midwest, LP (US Environmental Protection Agency, Citationn.d.-c). Since the type of coal used, operational efficiency of the control devices, and operational efficiency of the overall plants often depend on the owner/operator, the joining of Mitchell and Hatfield’s Ferry data, separate from Elrama, is well justified. These two continuous, independent fuel consumption variables provide directly observed information on plant activity at every month of the study period.
Unconventional natural gas extraction data
Oil and gas reports from unconventional wells in Pennsylvania were downloaded from http://www.depreportingservices.state.pa.us/ReportServer/Pages/ReportViewer.aspx?%2fOil_Gas%2fOil_Gas_Well_Historical_Production_Report (Pennsylvania Department of Environmental Protection, Citationn.d.-b). The Pennsylvania Department of Environmental Protection (PADEP) defines an unconventional gas well as a “well that is drilled into an unconventional formation, which is defined as a geologic shale formation below the base of the Elk Sandstone or its geologic equivalent where natural gas generally cannot be produced except by horizontal or vertical well bores stimulated by hydraulic fracturing” (Pennsylvania Department of Environmental Protection, Citation2012). Given the recent boom in unconventional extraction in southwestern Pennsylvania, data on the volume of natural gas extracted from unconventional wells were analyzed in the study region from year 2013 to 2014 in order to assess the potential for unconventional extraction activities to influence PM2.5 ground station measurements before and after the joint closing of Hatfield’s Ferry and Mitchell power plants in October 2013.
PADEP provides data on the volume of gas extracted in Mcf (thousands of cubic feet) by 6-month periods (Pennsylvania Department of Environmental Protection, Citationn.d.-b). For each 6-month period, the volumes of gas extracted from all the unconventional wells within a 16-km radius of each EPA ground station were summed and recorded for each station using ArcGIS (version 10.2.2; ESRI). The 16-km radius was chosen to approximate the 10-mile radius used in the Colorado birth defect study (McKenzie et al., Citation2014), but distances from station to well were not incorporated in this analysis because the well itself is unlikely to be the primary source of PM2.5 emissions. Diesel trucks and compressor stations also contribute a large portion of the PM2.5 (Litovitz et al., Citation2013; Srebotnjak and Rotkin-Ellman, Citation2014). It is reasonable to assume that the amount of diesel exhaust and compression emissions is closely related to the volume of gas being extracted from local wells. The mobility of diesel trucks and the unknown locations of compressor stations make a larger ground station radius preferable when assessing the influence of unconventional extraction on PM2.5 measurements. In the case of site 125-5001, where the 16-km radius included a portion of West Virginia, unconventional well data were supplemented with data from West Virginia Geological & Economic Survey (West Virginia Geological & Economic Survey, n.d.). For each ground station, gas volumes observed during the two 2014 periods were averaged and divided by gas volumes observed during the first 2013 period, from January to June. If the local 6-month volume of extracted natural gas more than tripled after the joint closing of Hatfield’s Ferry and Mitchell power plants in October 2013, that station was identified as likely to be affected by unconventional extraction activities.
Unconventional natural gas extraction activities were estimated to have contributed a maximum of 1% of Pennsylvania’s statewide PM2.5 emissions in 2011, while combustion-based electricity production and vehicles contributed an estimated 47% of statewide PM2.5 (Litovitz et al., Citation2013). However, the contribution of extraction activities is likely to be much higher for the southwestern portion of the state, especially in Washington and Westmoreland counties, which have already been described as “counties with intensive shale gas activities” (Stacy et al., Citation2015). In addition, the unconventional natural gas extraction industry has experienced unprecedented growth in southwestern Pennsylvania since 2011. Analysis of the PADEP volumes of unconventional natural gas extracted within a 16-km radius of each ground station shows that the ratio of year 2014 extraction volumes to year 2011 extraction volumes is as high as 27 for two ground stations, and more than 15 for two others. We performed separate analyses, excluding stations most likely to be impacted by these extraction activities, especially during the last period of power plant closures.
Meteorological data
Weather parameters were added to account for the transport and spatial correlation of air pollutants from the source to the EPA ground stations. Wind speed and direction, specific humidity, and temperature were obtained at the native 1/8th degree spatial and monthly temporal resolution from the North American Land Data Assimilation System (NLDAS-2) (Xia et al., Citation2012). NLDAS combines satellite, radar, and ground weather observations with numerical prediction models to provide a nationally consistent and quality-controlled database intended for use in research applications and as a foundation for the interpretation of satellite and ground-based observations. To calculate specific humidity and temperature, each of the 12 EPA stations included in the study was matched to the nearest NLDAS grid cell, and the monthly humidity and temperature values were extracted at that location. Humidity is an important factor because “aqueous-phase-chemical reactions take place in cloud and fog droplets, and in aerosol particles at relative humidities approaching 100%[;] these reactions can lead to production of sulfate” (Seinfeld and Pandis, Citation2006). It is essential to include temperature data as well because increased temperature can increase the rate of photochemical reactions, contributing significant secondary organic aerosol, especially during the summer (Seinfeld and Pandis, Citation2006).
To directly address the question of whether or not a given power plant was likely to have contributed to pollution at a specific EPA station, we calculated the pairwise potential for dispersion and advection for each combination of EPA station and power plant included in the study. The zonal and meridional wind vectors were used to calculate the down and cross-wind vectors, where the downwind vector represented wind flows from the plant location to the paired EPA site. The absolute value of the cross-wind vector was used as an indicator of the potential for advection of power plant emissions away from each EPA station prior to dispersion. One minus the estimated time to dispersion, calculated by dividing the distance between the plant and the EPA station by the magnitude of the downwind vectors and then normalizing this estimated time to lie between 0 and 1 by assuming a maximum relevant estimated dispersion time of 72 hr, was used as an indicator to control for the potential for dispersion between the power plant and the EPA station. More information on the calculation of advection potential and dispersion potential is provided in the Supplemental Data.
Analysis
Ground PM2.5 measurements were aggregated by month, year, and station; monthly averages were weighted by the average number of observations made each day for that specific month, year, and EPA ground station. A Parameter Occurrence Code (POC) is a code number used to identify when more than one monitor is measuring the same parameter at a site (U.S. Environmental Protection Agency, Citationn.d.-d). Because certain EPA stations have multiple parameter occurrence codes (POCs), it was possible to have greater than one PM2.5 observation for a single day at the same EPA ground station. In order to minimize uncertainty due to low sampling frequency, all observations with the parameter code of 88101, indicating Federal Reference Methods (FRM) and Federal Equivalent Methods (FEM) instruments, were included in the analysis, resulting in only one missing monthly average. Thus, only 2% of temporal coverage was missing at a single ground station. To maintain equality between Terra and Aqua data, the combined AOD data were not weighted by number of observations.
Preliminary analyses were performed to determine whether PM2.5 and AOD levels had decreased in the study region with each power-plant shutdown. For these analyses, the study period was divided into three periods. The first period is from January 2011 through October 2012, when all three plants were operating. The second period is when Elrama was closed, but Mitchell and Hatfield’s Ferry were still operating, from November 2012 through October 2013. The last period is from November 2013 through December 2014, when all the plants were officially closed. Mean PM2.5 and mean AOD corresponding to ground-station locations were calculated for each closing period, along with 95% confidence intervals.
A generalized additive model (GAM) was developed to test the significance of the three power plants’ changes in activity, measured by fuel consumption, in predicting regional PM2.5 concentrations and AOD, corresponding to 12 EPA ground stations, after controlling for multiple meteorological factors and long-term, region-wide air quality improvements. GAMs replace what are usually linear predictors with additive smooth function predictors; each smooth function estimates the dependence of Y on a predictor (Hastie and Tibshirani, Citation1990). GAMs aim to expose functional dependence without imposing a rigid parametric assumption about that dependence (Hastie and Tibshirani, Citation1990). Our model is additive because it is a sum of terms, and generalized because some of those terms may be nonparametric and others may be linear—a smooth function with 1 effective degree of freedom (edf) indicates a predictor that has a simple linear effect (Clark). This flexibility makes the GAM a useful tool for capturing natural experiments. The main model is presented here:
where Y is either monthly combined AOD, or monthly mean PM2.5; β0 is the Y-intercept; Time is a number from 1 to 48 denoting the temporal position of each month within the 48-month study period; Elrama_Fuel corresponds to monthly observed fuel consumption data at the Elrama plant, measured in MMBtu; Mitchell&Hatfield_Fuel corresponds to monthly observed fuel consumption data, added together from both the Mitchell plant and Hatfield’s Ferry and measured in MMBtu; Temperature is mean monthly temperature data from NLDAS; Humidity is mean monthly specific humidity data from NLDAS; Elrama_Advection represents the monthly advection potential between each EPA station and the Elrama plant; Mitchell_Advection represents the monthly advection potential between each EPA station and the Mitchell plant; Hatfield_Advection represents the monthly advection potential between each EPA station and the Hatfield’s Ferry plant; Elrama_Dispersion represents the monthly dispersion potential between each EPA station and the Elrama plant; Mitchell_Dispersion represents the monthly dispersion potential between each EPA station and the Mitchell plant; Hatfield_Dispersion represents the monthly dispersion potential between each EPA station and the Hatfield’s Ferry plant; and ε is a random error term, assumed ~ N(0, σ2). The statistical significance of each independent predictor variable was analyzed at α = 0.05.
Each smooth function in the GAM was treated as a cubic regression spline. A cubic spline is essentially a connection of multiple cubic polynomial regressions; the points at which different sections are created are called knots (Clark, Citationn.d.). The smooth function of the Time variable was included to account for long-term, region-wide air quality improvements that are not controlled by other variables in the model. For instance, a national average annual emission report showed that from 2011 to 2014, PM2.5 emissions from highway vehicles dropped from 198 thousands of tons to 167 thousands of tons, and PM2.5 from off-highway emissions dropped from 210 thousands of tons to 175 thousands of tons (U.S. Environmental Protection Agency, Citationn.d.-b). Although it is expected that a similar trend occurred within our study region during 2011–2014, reliable monthly data for automobile emissions were not available and could not be added to the GAM. Additionally, it is possible that multiple coal-fired power plants outside the study domain also closed between 2011 and 2014. Long-range transport of emissions originating outside the study domain could result in air quality improvements that are not specifically controlled for in the main GAM. To account for these potential sources of air quality improvement, the smooth function of Time was included in every GAM in the study. To ensure that the smooth function of Time did not mimic the nonparametric smooth functions of the fuel consumption predictors, which are also related to time, the number of knots in the Time smooth function was set equal to zero. For all other smooth functions of predictors, the number of knots was adjusted to maximize the adjusted R2 of the GAM.
The first GAM’s dependent Y variable was PM2.5 data from all 12 EPA ground stations in the study domain. Next, the dependent Y variable was switched to monthly PM2.5 data that excluded ground stations most likely to be affected by unconventional natural gas extraction. Then, two additional GAMs with fewer predictors were used to show the significance of AOD data in predicting PM2.5 in the study region. One GAM used smooth functions of Time, Temperature, and Humidity to predict PM2.5, and the other added a smooth function of the AOD data as a predictor of PM2.5. Next, the dependent Y variable of the main GAM was switched to AOD data corresponding to the locations of the 12 EPA ground stations. The main purpose of the GAM results in this study is to evaluate the predictive power of each model as demonstrated by the adjusted R2 and to determine which predictors are significant as indicated by their corresponding p values. A similar approach is displayed in of Liu et al. Citation2009. All GAMS were run using the gam() function in the mgcv package in R (Wood, Citation2006).
Table 1. PM2.5 means by closing period from EPA ground station locations.
Results
Descriptive statistics
The EPA ground station data were approximately normally distributed with both skewness and kurtosis statistics below 1. The minimum monthly PM2.5 concentration was 3.95 μg/m3; the maximum was 24.53 μg/m3; and the median was 10.22 μg/m3, with a variance of 9.92 μg/m3. Throughout the study period, there was a maximum possibility of 576 monthly concentrations (12 stations by 48 months). Station 003-3007 did not have any recorded measurements for November of 2011; this is the one missing value listed in .
The AOD data were roughly normally distributed with both skewness and kurtosis statistics below 1. Although both the Terra and Aqua data sets had a minimum AOD of -0.050, the cross-filling procedure produced AOD values that were slightly more negative. The minimum combined AOD was –0.069; the maximum was 0.432; and the median was 0.091, with a variance of 0.007. Throughout the study period, there was a maximum possibility of 4,032 monthly AOD values (84 grid cells by 48 months). AOD data were missing for 71 grid cell, month, and year combinations. When the AOD data were restricted to the 11 grid cells that contain EPA ground stations, there were 13 missing values. Since one of the AOD grid cells contains two ground stations, two of the 13 missing values were double-counted, resulting in the 15 missing AOD values listed in .
Table 2. AOD means by closing period from EPA ground station locations.
The mean PM2.5 values by closing period, along with their corresponding confidence intervals, are presented in for all EPA ground stations, and again after excluding ground stations likely to be affected by unconventional natural gas extraction. It is clear from the results in that PM2.5 levels were on a downward trend from the first closing period to the third closing period. For both data sets, the 95% confidence intervals of the first period and the third period do not overlap; PM2.5 decreased by 0.94 μg/m3 at all 12 ground stations, and by 1.00 μg/m3 when ground stations likely to be affected by unconventional natural gas extraction were excluded ().
The mean AOD values corresponding to data from all 12 EPA ground stations are presented in by closing period, along with their corresponding confidence intervals. shows that AOD was on a downward trend from the first period to the third period. In addition, the 95% confidence intervals of the first period and the third period do not overlap. AOD decreased by 0.060 according to this preliminary analysis ().
Ground station analysis
A GAM predicting PM2.5 in the study region from 2011 to 2014 was fitted with 11 predictor variables. When data from all 12 ground stations were included in the dependent data set, the adjusted R2 was 0.61, and the only nonsignificant predictor was f(Time) ().
Table 3. GAM results for two different dependent EPA ground station data sets.
Three stations, 003-3007, 003-0064, and 125-0005, were identified as likely to be affected by unconventional extraction activities. Each of their local 6-month volumes of extracted natural gas more than tripled after the joint closing of Hatfield’s Ferry and Mitchell power plants in October 2013. Station 003-3007 experienced 6.7 times the volume of gas extracted locally after the joint closing, the volume extracted surrounding station 003-0064 was 4.9 times higher after the closing, and the volume extracted near station 125-0005 increased by a factor of 6.5. After excluding these 3 stations from the EPA ground station data, the adjusted R2 was 0.68, and nonsignificant predictors included f(Time) and f(Mitchell_Dispersion) ().
AOD analysis
In order to test whether ambient PM2.5 concentration was dependent on AOD in the study region regardless of power plant operation, two GAMs with PM2.5 data from all ground stations as the dependent variable were run: one included a smooth function of AOD as a predictor, and the other did not. When f(AOD) was added as a predictor of PM2.5, the adjusted R2 increased from 0.40 to 0.46, and f(AOD) had a highly significant p-value of 1.55e-6 ().
Table 4. GAM results testing AOD as a predictor of ground station PM2.5 concentration.
When the main GAM was run with AOD data corresponding to each of the 12 ground stations as the dependent data set, the adjusted R2 was 0.76, and the only nonsignificant predictor was f(Humidity) ().
Table 5. GAM results for dependent AOD data corresponding to the locations of 12 EPA ground stations (N = 562).
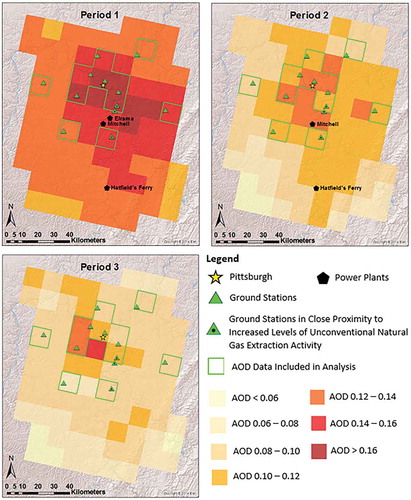
AOD data from all 84 CMAQ grid cells included in the study region are presented by closing period in to provide better spatial coverage and to investigate whether a downward trend in AOD was experienced throughout the region, as well as within the 11 grid cells containing ground stations. The series of three maps shows a region-wide decline in AOD over the course of the study period ().
Figure 2. Combined Aqua and Terra AOD by closing period. Period 1 is January 2011 to October 2012, when all three plants were operating. Period 2 is November 2012 to October 2013, when Elrama was closed, but Hatfield’s Ferry and Mitchell were still open. Period 3 is November 2013 to December 2014, when all three plants were closed. Monthly AOD values were aggregated by season (winter = December, January, February; spring = March, April, May; summer = June, July, August; fall = September, October, November). The values displayed are averages by closing period and CMAQ grid cell, with each season equally weighted.
Discussion
The role of power plant closings in reducing regional PM2.5 concentration
Preliminary analyses of PM2.5 and AOD means at 12 ground stations by closing period showed that levels of air pollution followed a downward trend during 2011–2014 in southwestern Pennsylvania ( and ). The slightly larger decrease in PM2.5 concentration observed when excluding stations likely to be affected by unconventional natural gas extraction () suggests that such extraction activities may contribute to PM2.5 emissions, though more research on this topic is needed.
Both smooth functions of power plant activity variables, represented by monthly fuel consumption, were highly significant in predicting both PM2.5 and AOD, after controlling for long-term, region-wide air quality improvements, temperature, humidity, advection potential, and dispersion potential in a GAM ( and ). When the three ground stations most likely to be affected by unconventional natural gas extraction were excluded from the ground station data, the smooth function of dispersion potential from Mitchell was not significant (). This is likely due to the fact that the three excluded ground stations (003-3007, 003-0064, and 125-0005) were the three closest stations to the Mitchell plant (). The exclusion of stations likely to be affected by unconventional natural gas extraction also increased the adjusted R2 from 0.61 to 0.68, suggesting that unconventional natural gas extraction activities may be contributing to some of the uncertainty in the original model, which used data from all EPA ground stations (). When AOD data corresponding to the locations of the 12 ground stations were used as the dependent data set for the GAM, both power plant closing smooth functions were the most significant predictors in the model, and the adjusted R2 reached 0.76 (). The fact that f(Humidity) was not a significant predictor of AOD may be due to data adjustments made based on humidity during the AOD retrieval process ().
The f(Time) predictor, meant to control for long-term, region-wide air quality improvements, was significant in the AOD GAM results (), but not significant in either of the ground-station-based GAM results (). This outcome is likely due to the vertical integration of AOD, which allows it to capture long-range transport pollution present at higher elevations than the EPA ground stations. During 2012, multiple coal plants located outside the designated Pittsburgh study domain closed, which likely resulted in a decrease in emissions from long-range transport that was not accounted for by any of the other smooth function predictors included in the main GAM. Coal plants that closed in 2012 include the Niles plant in Ohio to the northwest of Pittsburgh (Hopey, Citation2012b), the Armstrong plant in Pennsylvania to the northeast of Pittsburgh (Hopey, Citation2012a), and the Willow Island, Rivesville, and Albright plants in West Virginia, to the southwest, south, and southeast of Pittsburgh (The State Journal, Citation2012). Together, these five plants had a capacity of more than 1200 MW (The State Journal, Citation2012; Hopey, Citation2012a, Citation2012b).
The benefits of satellite data in assessing changes in PM2.5 concentration
Although AOD is not a perfect substitute for PM2.5, the results presented in show that when a nonparametric relationship is allowed, f(AOD) is a strong predictor of PM2.5. In addition, the use of Terra and Aqua MODIS AOD data allows for greater spatial coverage when assessing the impact of power plant closings on air quality in the study region. Hatfield’s Ferry power plant, with a nameplate capacity of 1728 MW, is one of the highest capacity plants in the United States to close since 2009, but there are no EPA ground stations within a 15-km radius of the plant. Remotely sensed AOD data can facilitate analyses of changes in air quality where adequate ground monitors are absent. The results presented in display the average AOD values by closing period for all areas of the study domain, and show that the decline in AOD over the three phases of the study period was domain-wide, not limited to the 11 grid cells included in our GAM analysis.
PM2.5 air pollution from unconventional natural gas extraction
The impact of unconventional natural gas extraction on PM2.5 air pollution is an active area of research. According to the National Resource Defense Council, diesel particulate matter is emitted at all six stages of the fracking process (Srebotnjak and Rotkin-Ellman, Citation2014). Since the heavy trucks and machinery required for well site preparation, drilling, and production rely on diesel fuel, increased exposure of local residents to fine diesel soot particles is a valid concern (Duggan-Haas et al., Citation2013; Srebotnjak and Rotkin-Ellman, Citation2014).
A study based on 2009 data found that drilling and hydrofracking were the main sources of PM2.5 emissions in the unconventional gas extraction process (Roy, Adams, and Robinson, Citation2014), but another study, based on 2011 data, found that compressor stations contributed the most to PM2.5 emissions (Litovitz et al., Citation2013). Although compressor stations are not unique to unconventional extraction practices, the high volumes of gas produced by unconventional means are expected to increase their emissions (Litovitz et al., Citation2013). It is important to note that the aforementioned studies (Litovitz et al., Citation2013; Roy, Adams, and Robinson, Citation2014) only considered primary PM2.5 emissions from unconventional extraction processes in their analyses. Using 2009 data as a baseline, Roy et al. estimated that Marcellus activities will contribute an average of 12% (129 tons/day) of Marcellus region NOx emissions and an average of 12% (100 tons/day) of Marcellus region anthropogenic volatile organic compound (VOC) emissions by 2020, already accounting for the Tier 4 off-road diesel engine regulation and the EPA’s Oil and Gas Rule (Roy, Adams, and Robinson, Citation2014). Both VOCs and NOx are precursors to secondary PM2.5 (Hodan and Barnard, Citation2004), and both are emitted from compressor stations at higher rates than primary PM2.5 is emitted (Litovitz et al., Citation2013). A previous study of Pittsburgh air pollution estimated that 19% of PM2.5 was contributed by local secondary material (Martello et al., Citation2008). Thus, it is reasonable to suspect that both the primary emissions associated with unconventional extraction and their secondary products have contributed to the ambient PM2.5 concentration in southwestern Pennsylvania.
Conclusion
In this study, GAMs were used to assess the impact of three coal-fired power plant shutdowns on PM2.5 in and around the Pittsburgh metropolitan area. Although EPA ground stations provided reliable data, satellite-retrieved AOD data corresponding to the ground station locations were also analyzed given their broader spatial coverage. Preliminary analyses of PM2.5 and AOD means before and after the power plants closed showed a 0.94-µg/m3 decrease in PM2.5 and a 0.060 decrease in AOD. Though this is not a dramatic reduction, the ~9% decrease in ambient PM2.5 concentration is significant. Smooth functions of the closing of the Elrama plant in October 2012 and the joint closing of the Mitchell and Hatfield’s Ferry plants in October 2013, represented by decreases in monthly fuel consumption to 0 MMBtu, were found to significantly predict both the declining PM2.5 concentration and the declining AOD values at the 12 EPA ground stations included in the study region. When ground stations most likely to be affected by unconventional natural gas extraction activities were excluded from the analysis, a slightly higher decrease (1.00 µg/m3) in PM2.5 concentration was observed, and the GAM’s power to predict PM2.5 concentration increased. As more power plants close, AOD will continue to be a useful supplement to ground-station data in assessing impacts on air quality.
Supplementary Materials
Download PDF (269.3 KB)Acknowledgments
The data used in this study were acquired as part of the mission of NASA’s Earth Science Division and archived and distributed by the Goddard Earth Sciences (GES) Data and Information Services Center (DISC). The authors also thank Megan Slemons, a GIS librarian at the Emory Center for Digital Scholarship, for her helpful tips related to the production of Figures 1 and 2, and for her advice regarding the spatial analysis required to determine the ground stations that were most likely to be affected by unconventional natural gas extraction.
Funding
This work was partially supported by NASA Applied Sciences Program (grant NNX11AI53G, PI: Liu).
Supplemental data
Supplemental data for this article can be accessed on the publisher’s website.
Additional information
Funding
Notes on contributors
Marie C. Russell
Marie C. Russell was a research assistant in the Department of Environmental Health at the Rollins School of Public Health, and is now an ASPPH fellowship program participant hosted by the U.S. EPA’s Office of the Science Advisor in Research Triangle Park, NC.
Jessica H. Belle
Jessica H. Belle is a Ph.D. student at Emory University who studies the use of MODIS satellite-derived AOD values in predicting PM2.5 concentrations.
Yang Liu
Yang Liu is an associate professor in the Department of Environmental Health at the Rollins School of Public Health who specializes in environmental remote sensing.
Related Research Data
References
- Barrett, E.G., K.C. Day, A.P. Gigliotti, M.D. Reed, J.D. McDonald, J.L. Mauderly, and S.K. Seilkop. 2011. Effects of simulated downwind coal combustion emissions on pre-existing allergic airway responses in mice. Inhal. Toxicol. 23(13):792–804. doi:10.3109/08958378.2011.609917
- Clancy, L., P. Goodman, H. Sinclair, and D.W. Dockery. 2002. Effect of air-pollution control on death rates in Dublin, Ireland: An intervention study. Lancet 360(9341):1210–14. doi:10.1016/S0140-6736(02)11281-5
- Clark, M. n.d. Generalized Additive Models: Getting Started with Additive Models in R. Center for Social Research, University of Notre Dame. https://www3.nd.edu/~mclark19/learn/GAMS.pdf (accessed December 12, 2015).
- Clean Air Task Force. 2012. Death and disease from power plants. http://www.catf.us/fossil/problems/power_plants/ (accessed March 7, 2015).
- Craig, P., C. Cooper, D. Gunnell, S. Haw, K. Lawson, S. Macintyre, D. Ogilvie, M. Petticrew, B. Reeves, M. Sutton, and S. Thompson. 2012. Using natural experiments to evaluate population health interventions: New Medical Research Council guidance. J. Epidemiol. Commun. Health 66(12):1182–86. doi:10.1136/jech-2011-200375
- Disavino, S. 2013. PJM says FirstEnergy can shut two Pennsylvania coal plants. Reuters, September 20.
- Duggan-Haas, D., R.M. Ross, W.D. Allmon, K.E. Cronin, T.A. Smrecak, and S.A. Perry. 2013. The Science Beneath the Surface: A Very Short Guide to the Marcellus Shale. Ithaca, NY: Paleontological Research Institution (Special Publication 43).
- Ferris, S. 2013. Hatfield’s Ferry Power Station quietly closes for good. Herald Standard, October 20.
- Fontaine, T., and L. Zemba. 2013. Jobs could trump health when it comes to power plant closings. TRIBLive, August 17.
- Goddard Space Flight Center. n.d. Level 1 and Atmosphere Archive and Distribution System. http://ladsweb.nascom.nasa.gov/data/ (accessed February 27, 2015).
- Godish, T. 2004. Air Quality, 4th ed. Boca Raton, FL: CRC Press.
- Green, M., S. Kondragunta, P. Ciren, and C.Y. Xu. 2009. Comparison of GOES and MODIS aerosol optical depth (AOD) to Aerosol Robotic Network (AERONET) AOD and IMPROVE PM2.5 Mass at Bondville, Illinois. J. Air Waste Manage. Assoc. 59(9):1082–91. doi:10.3155/1047-3289.59.9.1082
- Hastie, T.J., and R.J. Tibshirani. 1990. Generalized Additive Models. Boca Raton, FL: Chapman & Hall/CRC.
- Hodan, W.B., and W.R. Barnard. 2004. Evaluating the contribution of PM2.5 precursor gases and re-entrained road emissions to mobile source PM2.5 particulate matter emissions. MACTEC under contract to the Federal Highway Administration. https://www3.epa.gov/ttnchie1/conference/ei13/mobile/hodan.pdf (accessed August 30, 2016).
- Hopey, D. 2012a. Armstrong facility among 6 coal-fired power plants to close. Pittsburgh Post-Gazette, January 26.
- Hopey, D. 2012b. Off switch hit for power plants: Planned closure of coal-fired facilities hailed by environmentalists. Pittsburgh Post-Gazette, March 1.
- Hu, X., L.A. Waller, M.Z. Al-Hamdan, W.L. Crosson, M.G. Estes Jr., S.M. Estes, D.A. Quattrochi, J.A. Sarnat, and Y. Liu. 2013. Estimating ground-level PM2.5 concentrations in the southeastern U.S. using geographically weighted regression. Environ. Res. 121:1–10. doi:10.1016/j.envres.2012.11.003
- Jaffe, D.A., and D.R. Reidmiller. 2009. Now you see it, now you don’t: Impact of temporary closures of a coal-fired power plant on air quality in the Columbia River Gorge National Scenic Area. Atmos. Chem. Phys. 9(20):7997–8005. doi:10.5194/acp-9-7997-2009
- Johnson, E. 2014. Planned coal-fired power plant retirements continue to increase. US Energy Information Administration: Today in Energy, March 20.
- Kappos, A.D., P. Bruckmann, T. Eikmann, N. Englert, U. Heinrich, P. Hoppe, E. Koch, G.H.M. Krause, W.G. Kreyling, K. Rauchfuss, P. Rombout, V. Schulz-Klemp, W.R. Thiel, and H.E. Wichmann. 2004. Health effects of particles in ambient air. Int. J. Hyg. Environ. Health 207(4):399–407. doi:10.1078/1438-4639-00306
- Laden, F., J. Schwartz, F.E. Speizer, and D.W. Dockery. 2006. Reduction in fine particulate air pollution and mortality. Am. J. Respir. Crit. Care Med. 173(6):667–72. doi:10.1164/rccm.200503-443OC
- Lee, D.T., and B.J. Schachter. 1980. Two algorithms for constructing a Delaunay triangulation. Int. J. Comput. Information Sci. 9(3):219–42. doi:10.1007/BF00977785
- Lee, H.J., Y. Liu, B.A. Coull, J. Schwartz, and P. Koutrakis. 2011. A novel calibration approach of MODIS AOD data to predict PM2.5 concentrations. Atmos. Chem. Phys. 11(15):7991–8002. doi:10.5194/acp-11-7991-2011
- Levy, R. C., S. Mattoo, L. A. Munchak, L. A. Remer, A. M. Sayer, F. Patadia, and N. C. Hsu. 2013. The Collection 6 MODIS aerosol products over land and ocean. Atmos. Meas. Tech. 6(11):2989–3034. doi:10.5194/amt-6-2989-2013
- Litovitz, A., A. Curtright, S. Abramzon, N. Burger, and C. Samaras. 2013. Estimation of regional air-quality damages from Marcellus Shale natural gas extraction in Pennsylvania. Environ. Res. Lett. 8(1). doi:10.1088/1748-9326/8/1/014017
- Liu, Y., M. Franklin, R. Kahn, and P. Koutrakis. 2007. Using aerosol optical thickness to predict ground-level PM2.5 concentrations in the St. Louis area: A comparison between MISR and MODIS. Remote Sens. Environ. 107(1–2):33–44. doi:10.1016/j.rse.2006.05.022
- Liu, Y., C.J. Paciorek, and P. Koutrakis. 2009. Estimating regional spatial and temporal variability of PM2.5 concentrations using satellite data, meteorology, and land use information. Environ. Health Perspect. 117(6):886–92. doi:10.1289/ehp.0800123
- Lu, X., J. Salovaara, and M. B. McElroy. 2012. Implications of the recent reductions in natural gas prices for emissions of CO2 from the US power sector. Environ. Sci. Technol. 46(5):3014–21. doi:10.1021/es203750k
- Martello, D.V., N.J. Pekney, R.R. Anderson, C.I. Davidson, P.K. Hopke, E. Kim, W.F. Christensen, N.F. Mangelson, and D.J. Eatough. 2008. Apportionment of ambient primary and secondary fine particulate matter at the Pittsburgh National Energy Laboratory particulate matter characterization site using positive matrix factorization and a potential source contributions function analysis. J. Air Waste Manage. Assoc. 58(3):357–68. doi:10.3155/1047-3289.58.3.357
- McCurdy, T., M.P. Zelenka, P.M. Lawrence, R.M. Houston, and R. Burton. 1999. Acid aerosols in the Pittsburgh Metropolitan area. Atmos. Environ. 33(30):5133–45. doi:10.1016/S1352-2310(99)00119-3
- McKenzie, L.M., R. Guo, R.Z. Witter, D.A. Savitz, L.S. Newman, and J.L. Adgate. 2014. Birth outcomes and maternal residential proximity to natural gas development in rural Colorado. Environ. Health Perspect. 122(4):412–17. doi:10.1289/ehp.1306722
- Miller, K.A., D.S. Siscovick, L. Sheppard, K. Shepherd, J.H. Sullivan, G.L. Anderson, and J.D. Kaufman. 2007. Long-term exposure to air pollution and incidence of cardiovascular events in women. N. Engl. J. Med. 356(5):447–58. doi:10.1056/Nejmoa054409
- National Aeronautics and Space Administration. n.d.-a. Aqua Earth-observing satellite mission. http://aqua.nasa.gov/ ( accessed March 30, 2015).
- National Aeronautics and Space Administration. n.d.-b. Terra: The EOS flagship. http://terra.nasa.gov/ ( accessed July 6, 2015).
- National Aeronautics and Space Administration. n.d.-c. MODIS. http://modis.gsfc.nasa.gov/about/ (accessed March 30, 2015).
- Ostro, B., M. Lipsett, P. Reynolds, D. Goldberg, A. Hertz, C. Garcia, K.D. Henderson, and L. Bernstein. 2010. Long-term exposure to constituents of fine particulate air pollution and mortality: Results from the California Teachers Study. Environ. Health Perspect. 118(3):363–69. doi:10.1289/ehp.0901181
- Pennsylvania Department of Environmental Protection. 2012. Act 13 frequently asked questions. http://files.dep.state.pa.us/OilGas/OilGasLandingPageFiles/Act13/Act_13_FAQ.pdf ( accessed August 13,2015).
- Pennsylvania Department of Environmental Protection. n.d.-a. Facility emissions report. http://www.ahs.dep.pa.gov/eFACTSWeb/criteria_facilityemissions.aspx (accessed August 20, 2015).
- Pennsylvania Department of Environmental Protection. n.d.-b. Oil and gas production reports. http://www.depreportingservices.state.pa.us/ReportServer/Pages/ReportViewer.aspx?%2fOil_Gas%2fOil_Gas_Well_Historical_Production_Report ( accesssed June 9, 2015).
- Pope, C.A., R.T. Burnett, M.J. Thun, E.E. Calle, D. Krewski, K. Ito, and G.D. Thurston. 2002. Lung cancer, cardiopulmonary mortality, and long-term exposure to fine particulate air pollution. J. Am. Med. Assoc. 287(9):1132–41. doi:10.1001/jama.287.9.1132
- Pope, C.A., M. Ezzati, and D.W. Dockery. 2009. Fine-particulate air pollution and life expectancy in the United States. N. Engl. J. Med. 360(4):376–86. doi:10.1056/NEJMsa0805646
- Puett, R.C., J.E. Hart, J.D. Yanosky, C. Paciorek, J. Schwartz, H. Suh, F.E. Speizer, and F. Laden. 2009. Chronic fine and coarse particulate exposure, mortality, and coronary heart disease in the Nurses’ Health Study. Environ. Health Perspect. 117(11):1697–701. doi:10.1289/ehp.0900572
- Roy, A.A., P.J. Adams, and A.L. Robinson. 2014. Air pollutant emissions from the development, production, and processing of Marcellus Shale natural gas. J. Air Waste Manage. Assoc. 64(1):19–37. doi:10.1080/10962247.2013.826151
- Sayer, A. M., N. C. Hsu, C. Bettenhausen, and M. J. Jeong. 2013. Validation and uncertainty estimates for MODIS Collection 6 Deep Blue aerosol data. J. Geophys. Res. Atmos. 118(14):7864–72. doi:10.1002/jgrd.50600
- Seinfeld, J.H., and S.N. Pandis. 2006. Atmospheric Chemistry and Physics: From Air Pollution to Climate Change, 2nd ed. Hoboken, NJ: John Wiley & Sons.
- Source Watch. n.d. Mitchell Power Station (Pennsylvania). http://www.sourcewatch.org/index.php?title=Mitchell_Power_Station_%28Pennsylvania%29 ( accessed February 2, 2015).
- Srebotnjak, T., and M. Rotkin-Ellman. 2014. Fracking fumes: Air pollution from hydraulic fracturing threatens public health and communities. Natural Resources Defense Council. https://www.nrdc.org/sites/default/files/fracking-air-pollution-IB.pdf (accessed August 30, 2016).
- Stacy, S.L., L.L. Brink, J.C. Larkin, Y. Sadovsky, B.D. Goldstein, B.R. Pitt, and E.O. Talbott. 2015. Perinatal outcomes and unconventional natural gas operations in southwest Pennsylvania. PLoS ONE 10(6). doi:10.1371/journal.pone.0126425
- The State Journal. 2012. FirstEnergy to snuff Albright, Rivesville, Willow Island plants. The State Journal, February 8, 2012.
- Turner, R. 2015. deldir: Delaunay Triangulation and Dirichlet (Voronoi) Tessellation (R package version 0.1-9). http://cran.r-project.org/package=deldir.
- U.S. Census Bureau. n.d. Pittsburgh (city), Pennsylvania QuickFacts. http://quickfacts.census.gov/qfd/states/42/4261000.html ( accessed March 20, 2015).
- U.S. Energy Information Administration. 2011. EIA-923 Electric power plants represented in the generation and fuel data. http://www.eia.gov/electricity/data/eia923/ ( accessed September 27, 2015).
- U.S. Energy Information Administration. 2012. Annual energy outlook 2012 with projections to 2035. http://www.eia.gov/forecasts/aeo/pdf/0383%282012%29.pdf ( accessed July 21, 2015).
- U.S. Environmental Protection Agency. n.d.-a. Download daily data. [http://www.epa.gov/airdata/ad_data_daily.html (accessed February 8, 2015).
- U.S. Environmental Protection Agency. n.d.-b. Air pollutant emissions trends data: Average annual emissions. https://www.epa.gov/air-emissions-inventories/air-pollutant-emissions-trends-data (accessed March 7, 2015).
- U.S. Environmental Protection Agency. n.d-c. Air markets program data. http://ampd.epa.gov/ampd/ (accessed November 19, 2015).
- U.S. Environmental Protection Agency. n.d.-d. Air data glossary. https://www3.epa.gov/airdata/ad_glossary.html#P (accessed March 1, 2015).
- West Virginia Geological & Economic Survey. n.d. Marcellus Shale wells—Completed, permitted and cancelled episodes. http://www.wvgs.wvnet.edu/www/datastat/devshales.htm ( accessed July 19, 2015).
- Wood, S.N. 2006. Generalized Additive Models: An Introduction With R. Boca Raton, FL: Chapman and Hall/CRC.
- Xia, Y. L., K. Mitchell, M. Ek, J. Sheffield, B. Cosgrove, E. Wood, L. F. Luo, C. Alonge, H. L. Wei, J. Meng, B. Livneh, D. Lettenmaier, V. Koren, Q. Y. Duan, K. Mo, Y. Fan, and D. Mocko. 2012. Continental-scale water and energy flux analysis and validation for the North American Land Data Assimilation System project phase 2 (NLDAS-2): 1. Intercomparison and application of model products. J. Geophys. Res. Atmos. 117. doi:10.1029/2011JD016048