
ABSTRACT
The South Korean government plans to reduce region-wide annual PM2.5 (particulate matter with an aerodynamic diameter ≤2.5 μm) concentrations in the Seoul Capital Area (SCA) from 2010 levels of 27 µg/m3 to 20 µg/m3 by 2024. At the same time, it is inevitable that emissions from fossil-fuel power plants will continue to increase if electricity generation expands and the generation portfolio remains the same in the future. To estimate incremental PM2.5 contributions due to projected electricity generation growth in South Korea, we utilized an ensemble forecasting member of the Integrated Multidimensional Air Quality System for Korea based on the Community Multi-scale Air Quality model. We performed sensitivity runs with across-the-board emission reductions for all fossil-fuel power plants in South Korea to estimate the contribution of PM2.5 from domestic fossil-fuel power plants. We estimated that fossil-fuel power plants are responsible for 2.4% of the annual PM2.5 national ambient air quality standard in the SCA as of 2010. Based on the electricity generation and the annual contribution of fossil-fuel power plants in 2010, we estimated that annual PM2.5 concentrations may increase by 0.2 µg/m3 per 100 TWhr due to additional electricity generation. With currently available information on future electricity demands, we estimated that the total future contribution of fossil-fuel power plants would be 0.87 µg/m3, which is 12.4% of the target reduction amount of the annual PM2.5 concentration by 2024. We also approximated that the number of premature deaths caused by existing fossil-fuel power plants would be 736 in 2024. Since the proximity of power plants to the SCA and the types of fuel used significantly impact this estimation, further studies are warranted on the impact of physical parameters of plants, such as location and stack height, on PM2.5 concentrations in the SCA due to each precursor.
Implications: Improving air quality by reducing fine particle pollution is challenging when fossil-fuel-based electricity production is increasing. We show that an air quality forecasting system based on a photochemical model can be utilized to efficiently estimate PM2.5 contributions from and health impacts of domestic power plants. We derived PM2.5 concentrations per unit amount of electricity production from existing fossil-fuel power plants in South Korea. We assessed the health impacts of existing fossil-fuel power plants and the PM2.5 concentrations per unit electricity production to quantify the significance of existing and future fossil-fuel power plants with respect to the planned PM2.5 reduction target.
Introduction
Particulate matter of 2.5 μm in diameter or less (PM2.5) is known to be a significant public health concern, especially affecting the elderly and youth (Dockery et al., Citation1993; Pope et al., Citation2009; U.S. Environmental Protection Agency [EPA], Citation2009; Kim et al., Citation2015). PM2.5 consists of primary PM2.5 directly emitted from sources and secondary PM2.5 chemically formed from precursors emitted from various sources under conducive environmental conditions (North American Research Strategy for Tropospheric Ozone [NARSTO], Citation2004). Major precursors for secondary PM2.5 include sulfur dioxide (SO2), nitrogen oxides (NOx), ammonia (NH3), and volatile organic compounds (VOCs) (Cohan et al., Citation2007; Hallquist et al., Citation2009; Robinson et al., Citation2007). Due to atmospheric dispersion characteristics, secondary PM2.5 often results in regional air quality problems, including long-range transport (Liu, Citation2003; Abdalmogith and Harrison, Citation2005; Lim and Turpin, Citation2002; Polidori et al., Citation2006; NARSTO, Citation2004; EPA, Citation2009).
Poor air quality due to PM2.5 becomes a more urgent policy issue when high PM2.5 concentrations are prevalent in highly populated areas. For this study, we chose the Seoul Capital Area (SCA), which is one of the most densely populated areas in the world (United Nations, Citation2011). The SCA consists of three major jurisdictional areas, as shown in : Seoul, Incheon, and Gyeonggi-do. The population densities of Seoul, Incheon, and Gyeonggi-do are 16,592, 2659, and 1161 persons/km2, respectively, as of 2011 (Statistics Korea, Citation2016).
Figure 1. Location of the Seoul Capital Area in South Korea and modeling domains at horizontal resolutions of 27 km (outer box in the top panel) and 9 km (inner box with solid lines in the top panel). The SCA is denoted in the dotted line box of the top panel and shaded color in the bottom panel. Locations of PM2.5 monitors used to evaluate model performance appear as block solid dots in the bottom panel.
In South Korea, many large fossil-fuel power plants are located near the SCA, as shown in . These fossil-fuel power plants are major sources of SO2 (e.g., coal-fired power plants) and NOx (e.g., coal-fired power plants and natural gas–fired power plants). In 2010, coal-fired power plants, oil-fired power plants, and liquefied natural gas (LNG)-fired power plants produced 193,769, 25,356, and 95,147 GWhr, respectively (Electric Power Statistics Information System, Citation2011). Thus, a total of 314,272 GWh of electricity was produced by fossil-fuel power plants (Electric Power Statistics Information System, Citation2011). This accounted for 66.2% of the total electricity generated in South Korea in 2010. SO2 and NOx emissions from fossil-fuel power plants were 69,698 and 129,206 tons in 2010, respectively, according to the Clean Air Policy Support System (CAPSS) published by the National Institute of Environmental Research (Citation2014). These emissions accounted for 17% of SO2 emissions and 12% of total NOx emissions in South Korea as of 2010 (National Institute of Environmental Research, Citation2014). Therefore, controlling emissions from fossil-fuel power plants is crucial to reduce the harmful impacts on society and to maintain good air quality in South Korea.
Figure 2. SO2 and NOx emissions from fossil-fuel power plants in South Korea.
However, because of the current electricity generation infrastructure and the population’s energy demands, it is not feasible to reduce electricity generation and, in turn, emissions from fossil-fuel power plants. In fact, South Korea will continue to produce larger amounts of electricity to keep up with socioeconomic demands such as the increased use of air conditioning and industrial activities (Korea Energy Economics Institute, Citation2013; Energy Information Administration, Citation2014). According to the “6th Electricity Supply Plan,” the South Korean government plans to increase the electricity supply through 2027 by building new fossil-fuel power plants and increasing the use of existing fossil-fuel power plants near the SCA (Ministry of Knowledge Economy, Citation2013) such as Dang Jin Power Plant (4,000 MW) and Young Heung Power Plant (3,340 MW in 2010 and 5,080 MW in 2014). Although nuclear power plants and renewable energy sources may provide some alternatives, fossil-fuel-based electricity generation is unavoidable in the short term. Therefore, we expect South Korea will continue to experience increased SO2 and/or NOx emissions.
Nevertheless, it is imperative to strike a balance between electricity generation growth to meet future residential/industrial requirements and the development of an effective regional air quality management plan to protect public health. By implementing the “2nd Metropolitan Air Quality Control Master Plan,” the South Korean government established plans to reduce region-wide annual PM2.5 concentrations from 27 µg/m3 in 2010 to 20 µg/m3 in 2024 (Ministry of Environment, Citation2014). Since NOx and SO2 emissions from fossil-fuel power plants significantly impact the regional PM2.5 air quality, the impact of emissions from additional fossil-fuel-based electricity generation on the air quality in the SCA needs to be understood and quantified. Several studies have looked into power plant emission impacts on PM2.5 air quality on regions other than South Korea (Levy and Spengler, Citation2002; Kwok et al., Citation2013); the impacts were due to a single source (Kelly et al., Citation2010), or the study covered a limited portion of the year (Lee et al., Citation2013). Thus, there is an obvious lack of information on additive fossil-fuel power plant impacts on the annual PM2.5 air quality in the SCA. Therefore, our goal was to estimate the contribution of present and future fossil-fuel power plants to PM2.5 concentrations in the SCA to support air quality planning that considers increased future electricity demand.
Methods
Modeling system setup
To assess the impact of fossil-fuel power plants, we configured the modeling domains, as shown in . The boundary conditions of the 27-km domain run were prepared from the Community Multi-scale Air Quality (CMAQ) model default profile. The 9-km grid domain runs used boundary conditions extracted from the 27-km domain modeling outputs. We adopted the modeling domains and grids used for the “2nd Metropolitan Air Quality Control Master Plan.” We also considered the recommendation for PM2.5 modeling in EPA’s modeling guidance, which is to use a grid resolution of 12 km or less (EPA, Citation2014). The modeling domain and grid configuration was to account for the possible interaction of foreign emissions from China, North Korea, and Japan with domestic power plant plumes. In terms of the modeling period, we performed 4-month simulations for January, April, July, and October in 2010 to account for seasonal variations in the atmospheric environmental conditions in the SCA. To minimize the effects of initial conditions stemming from the profile, each monthly simulation included a 10-day spin-up period.
We used an ensemble forecasting member of the Integrated Multidimensional Air Quality System for Korea (IMAQS/K) (Kim et al., Citation2015). IMAQS/K offers various combinations of Weather Research and Forecasting (WRF)–Sparse Matrix Operator Kernel Emissions (SMOKE)–Community Multi-scale Air Quality (CMAQ) model sets. We used Model InterComparison Study—Asia (MICS-Asia) 2010 for foreign anthropogenic emissions (Carmichael and Wang, Citation2013), CAPSS 2010 for domestic anthropogenic emissions (National Institute of Environmental Research, Citation2014), and Model of Emissions of Gases and Aerosols from Nature (MEGAN) v2.04 for biogenic emissions (Guenther et al., Citation2006). The inventory species in CAPSS 2010 were NOx, SOx (sulfur oxides), PM10, PM2.5, NH3, VOC, and CO. We used SMOKE v3.1 to apply speciation profiles for detailed modeling species such as VOC and NOx. In addition, we made spatial and temporal allocations of annual emissions to prepare model-ready emissions input files. We ran WRF v3.4.1 with initial conditions derived from the Final Reanalysis (FNL) data (National Center for Atmospheric Research [NCAR], Citation2015). Next, we ran the Meteorology-Chemistry Interface Processor v3.6 to prepare meteorological inputs for CMAQ. Details of the modeling system configurations are listed in .
Table 1. Configurations of WRF and CMAQ used in this study.
Estimation of the fossil-fuel power plant contribution
diagrams the approach we took to estimate the total contribution of fossil-fuel power plants to PM2.5 concentrations in the SCA. First, we attempted to quantify the current contribution from existing power plants. Because large emission reductions of 50% or 100% can lead to overly changing the atmospheric chemistry in the model due to nonlinearity and, eventually, result in unrealistic predictions (Yarwood et al., Citation2007; Bartnicki, Citation1999; Dennis et al., Citation2008; Zhang et al., Citation2012), we adopted the de facto standard method used by the South Korean National Institute of Environmental Research (Citation2012) to assess contributions. The method is a two-step procedure following the recommendation in Bartnicki (Citation1999) to avoid the potential nonlinearity issue discussed above. The two steps are as follows: (1) calculate the sensitivity of 20% emission reductions and (2) compute 5 times the sensitivity result from (1) to estimate the total contribution. We intended to use the estimated contributions to predict the potential impacts of anticipated increases in future power plant capacity/use.
Figure 3. Plot of estimated contributions from fossil-fuel power plants. The contribution of existing fossil-fuel power plants was estimated by multiplying the modeled sensitivity of 20% emission reductions by 5.
Results and discussion
Model performance evaluation
depicts the locations of all PM2.5 monitors in the SCA. All PM2.5 monitors are equipped with measurement devices that operate on a continuous hourly basis. Due to data shortages, we could only rely on four monitors (Samsan, Gwanin, Gangha, and Songjeong) in January for the model performance evaluation. However, we used eight monitors for April, July, and October.
Using 27-km and 9-km modeling results, we calculated model performance statistics for all monitors in the SCA with equations suggested in EPA’s newest modeling guidance (EPA, Citation2014). For meteorological inputs, we conducted model performance evaluations by examining the index of agreement and bias for temperature, wind speed, and wind direction at monitors in the SCA. All performance evaluation results are presented in .
Table 2. Model performance statistics for 27-km and 9-km modeling results: temperature, wind speed, and wind direction (top) and PM2.5 (bottom).
and show the time series and scatter plots comparing modeled and observed daily PM2.5 concentrations. The model revealed that the best performance was in October (R2 = 0.843). We observed that the model performance in the first half of July was poor, which resulted in a worse PM2.5 prediction for the month (R2 = 0.419) as compared with April and October. Again, there were many days with missing observations in January, as noted above. Therefore, the estimated model performance statistics for January not as significant for analytical purposes as that of the statistics for the other months. The goal of this study was to assess the contribution of existing fossil-fuel power plants with available emissions inventories with regard to daily and annual PM2.5 standards. In South Korea, CAPSS is the best available domestic emissions inventory. Therefore, we conducted our analyses while recognizing that the model performance in July needs to be improved.
Figure 4. Time series of the daily average observed and modeled PM2.5 concentrations at all monitors in the SCA.
Figure 5. Comparison of the daily average observed and modeled PM2.5 concentrations at all monitors in the SCA.
Fossil-fuel power plant contribution
shows daily average PM2.5 concentrations at monitors in the SCA and contributions from fossil-fuel power plants. PM2.5 concentrations were the highest in January among all four simulated months. The base model reveals a reading of 74.5 µg/m3 on January 31, which is well above South Korea’s daily PM2.5 national ambient air quality standard (NAAQS) of 50 µg/m3. In the wintertime, long-range transport is often responsible for high PM2.5 events (Kim et al., Citation2014). The largest contribution of fossil-fuel power plants, 2.7 µg/m3, was estimated on July 10, which amounts to about 5% of daily PM2.5 NAAQS. Although the overall modeled PM2.5 concentrations in July were lower than other months, the contribution was still significantly larger than in other months because a large amount of secondary PM2.5 is formed in July from precursors such as NOx and SO2 emitted from fossil-fuel power plants. The estimated component-wide contributions of ammonium, sulfate, and nitrate were 0.63, 0.32, and 1.73 µg/m3, respectively. Most power plants near the SCA are located in the south and southwest of the SCA. In January, modeled prevailing winds were northwesterly and modeled prevailing winds in July were southerly and southwesterly. This pattern is consistent with what has been reported in other studies (Kim et al., Citation2007, Citation2014; Streets et al., Citation2003). Because of the possible direct transport of power plant plumes to the SCA in July, a modeled response to the power plant emissions change was more evident in July than January.
Figure 6. Daily average PM2.5 concentrations at monitors in the SCA and contributions from fossil-fuel power plants.
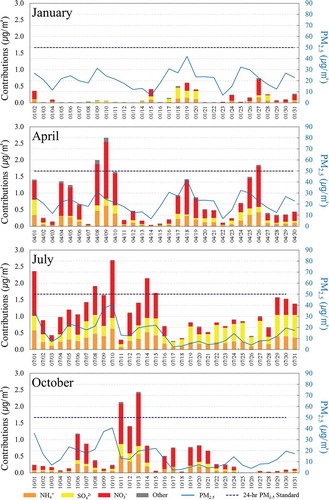
As noted in the model performance evaluation result, however, the modeled PM2.5 concentration was underestimated. Thus, we anticipate that the contribution would be more significant when model performance is improved. For the daily PM2.5 NAAQS, it is usually more important to correctly predict high PM2.5 days than average PM2.5 values. presents the maximum daily average PM2.5 concentrations in the SCA and contributions from fossil-fuel power plants for the days showing maximum daily average PM2.5 concentrations. The highest daily PM2.5 concentrations predicted in January and October were 74.52 µg/m3 on January 31 and 63.00 µg/m3 on October 11, and the fossil-fuel power plant contributions for these days were 0.28 and 2.14 µg/m3, respectively. For October, fossil-fuel power plants contributed approximately 4% to the daily PM2.5 NAAQS. As shown in , most fossil-fuel power plant contributions originated from nitrate.
Table 3. Maximum daily average PM2.5 concentrations in the SCA and contributions from fossil-fuel power plants for days showing maximum daily average PM2.5 concentrations.
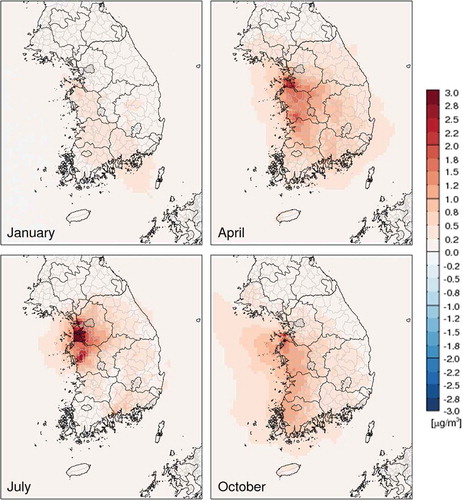
presents the monthly average PM2.5 at monitors in the SCA and contributions from fossil-fuel power plants. The largest PM2.5 contribution from power plants occurred in July, and the smallest contribution was observed in January. At the same time, the highest monthly average PM2.5 concentrations were modeled in January. Similar to the daily PM2.5 concentrations, the model estimated the lowest PM2.5 concentrations in July. However, we anticipate that the fossil-fuel power plant contribution in July would be much larger when the model performance is improved. We estimated the annual PM2.5 contribution of 0.63 µg/m3 from fossil-fuel power plants by taking averages of monthly contributions estimated for January, April, July, and October. This amounted to about 2.4% of the annual PM2.5 NAAQS, 25 µg/m3, in South Korea. Figure 7 shows the spatial distribution of fossil-fuel power plant contributions for the monthly average PM2.5.
Table 4. Monthly average PM2.5 concentrations in the SCA and contributions from fossil-fuel power plants for days showing maximum daily average PM2.5 concentrations.
The results of this study will be useful for South Korean air quality managers to estimate the amount of emission controls needed to meet air quality standards in the SCA considering anticipated emission increases due to future energy supply plans. For example, we can estimate that the anticipated electricity generation with new fossil-fuel power plants according to the “6th Electricity Supply Plan” will be 120 TWhr by assuming a 90% capacity factor. Since the current contribution, 0.63 µg/m3, results from 314,272 GWhr, we can estimate 2 µg/m3 per 1000 TWhr. We expect a 0.24 µg/m3 increase in PM2.5 if increased power production occurs at the same locations and proportional to existing fossil-fuel power plants as of 2010.
According to the “2nd Metropolitan Air Quality Control Master Plan,” the South Korean government plans to reduce region-wide annual PM2.5 concentrations to 20 µg/m3 by 2024 from the 27 µg/m3 level observed in 2010. The estimated current annual contribution accounts for 9% of the reduction goal and the anticipated future incremental contribution would be 3.4% of the reduction goal. Thus, the total future contribution of fossil-fuel power plants would be 12.4% of the reduction goal of annual PM2.5 concentrations by 2024. Using data available from Leem et al. (Citation2015), we estimated an approximate premature death rate due to PM2.5. The paper estimated that 14,915 (4275–26,017 with 95% confidence interval) annual premature deaths in the SCA are preventable if emission controls are in place to meet a PM2.5 goal of 20 µg/m3 as compared with the SCA-wide aerial average PM2.5 concentration, 32.8 µg/m3, resulting from a scenario in which no additional controls are in place in 2024. We approximated that the average premature death rate in 2024 will be 1169 persons per µg/m3 by dividing 14,915 persons by 12.8 µg/m3. Therefore, we conclude that the total PM2.5 contribution resulting from existing fossil-fuel power plants, 0.63 µg/m3, in 2024 would result in an estimated 736 premature deaths. We recognize that recent studies (Thurston et al., Citation2015, and references therein) indicate that different PM2.5 constituents may have different health effects. For this study, however, we followed commonly accepted information, such as provided by the EPA (EPA, Citation2009), which estimates premature deaths based on the total PM2.5 mass. We acknowledge that, in the future, this paradigm can shift once scientific communities reach a consensus on the different effects of PM2.5 constituents on premature deaths.
Conclusion
In this study, we estimated the contribution of domestic fossil-fuel power plant emissions to the surface PM2.5 concentrations in the SCA, South Korea, where more than 25 million people live. We performed 4-month simulations for January, April, July, and October to account for seasonal variations in environmental conditions in the SCA. The maximum daily PM2.5 concentrations in January, April, July, and October were 74.52, 42.05, 40.62, and 63.00 µg/m3, respectively. Contributions of fossil-fuel power plants for these days were 0.28, 1.42, 2.69, and 2.14 µg/m3, respectively. The average monthly PM2.5 contributions from fossil-fuel power plants were 0.16 out of 30.13 µg/m3 in January, 0.76 out of 21.43 µg/m3 in April, 1.11 out of 14.87 µg/m3 in July, and 0.49 out of 23.77 µg/m3 in October. The estimated annual average PM2.5 contribution was 0.63 out of 22.55 µg/m3. A previous study indicated that the relative contribution of foreign sources to the surface PM2.5 in the SCA is about 25–30% (Kim, Citation2006). indicates that potential quantities of PM2.5 transported to downwind countries are negligible. At the same time, we recognize that different atmospheric conditions can lead to non-negligible contributions to downwind countries such as Japan. Therefore, a long-range transport assessment is desirable.
Figure 7. Spatial distribution of fossil-fuel power plant contributions for monthly average PM2.5.
As of 2014, all coal-fired power plants are required to operate bag houses for fly ash and flue gas desulfurization to control SO2 emissions. In addition, selective catalytic reduction devices to control NOx emissions have been mandated for all fossil-fuel power plants. These stringent controls are required for newly constructed fossil-fuel power plants as well. Therefore, we anticipate that the future SO2 and NOx emission increments will be proportional to the planned electricity generation by assuming that the future fleet type mix and spatial distribution of fleets remain close to the current status. Based on the results of this study and the gross load of fossil-fuel power plants in 2010, we estimate that the annual PM2.5 concentration increase in the SCA will be 2.0 µg/m3 per 1000 TWhr due to additional electricity generation.
According to the “2nd Metropolitan Air Quality Control Master Plan,” the South Korean government plans to reduce region-wide annual PM2.5 concentrations to 20 µg/m3 by 2024 from the 27 µg/m3 level observed in 2010. The results of this study will be useful for South Korean air quality managers to estimate the amount of emission controls needed to meet air quality standards in the SCA considering anticipated emission increases due to future energy supply plans such as the “6th Electricity Supply Plan.” For example, we can estimate that anticipated electricity generation with new fossil-fuel power plants according to the “6th Electricity Supply Plan” will be 120 TWhr by assuming a 90% capacity factor. We expect a 0.24 µg/m3 increase in PM2.5 if increased power generation occurs at the same locations and proportional to existing fossil-fuel power plants as of 2010. Therefore, we estimated that the total future contribution of fossil-fuel power plants will be 0.87 µg/m3, which is 12.4% of the target amount of the annual PM2.5 concentration reduction by 2024, and premature deaths due to the existing fossil-fuel power plant contribution would be 736. In addition, we demonstrated that seasonal variations in PM2.5 components need to be addressed in the future to meet daily PM2.5 standards in the SCA. Finally, since the proximity of power plants to the SCA and the fuel types used significantly impact these estimations, further studies are warranted on the impact of physical parameters of plants, such as location and stack height, on PM2.5 concentrations in the SCA due to each precursor. In addition, we recognize that the spatiotemporal limit of the current study on the impact of PM2.5 concentration changes. We recommend that future studies include higher resolution modeling and observational analyses using remote sensing data.
Funding
The authors would like to thank the Korea Ministry of Environment and the PM2.5 Research Center, supported by the Ministry of Science, ICT, and Future Planning, and the National Research Foundation of Korea (2014M3C8A5030624) for their support.
Additional information
Funding
Notes on contributors
Byeong-Uk Kim
Byeong-Uk Kim is an environmental modeler at the Georgia Environmental Protection Division, Atlanta, GA.
Okgil Kim
Okgil Kim is a graduate student in the Department of Environmental Engineering, Ajou University, Suwon, South Korea.
Hyun Cheol Kim
Hyun Cheol Kim is a research scientist at the NOAA/Air Resources Laboratory, College Park, MD, and UMD/Cooperative Institute for Climate and Satellites, College Park, MD.
Soontae Kim
Soontae Kim is an associate professor in the Department of Environmental Engineering, Ajou University, Suwon, South Korea.
References
- Abdalmogith, S.S., and R.M. Harrison. 2005. The use of trajectory cluster analysis to examine the long-range transport of secondary inorganic aerosol in the UK. Atmos. Environ. 39:6686–6695. doi:10.1016/j.atmosenv.2005.07.059
- Bartnicki, J. 1999. Computing source-receptor matrices with the EMEP Eulerian Acid Deposition Model. http://emep.int/publ/reports/1999/note5_99.pdf ( accessed February 29, 2016).
- Carmichael, G., and Z. Wang. 2013. MICS-Asia Phase III Work Plan—2013 + MICS-Asia III. www.htap.org/meetings/2013/2013_04/files/Presentations/21%20Thurs/07%20MICSIII_Geneva_HTAP_final_final.pdf (accessed February 29, 2016)
- Cohan, D. S., J. W. Boylan, A. Marmur, and M. N. Khan. 2007. An integrated framework for multipollutant air quality management and its application in Georgia. Environ. Manage. 40:545–554. doi:10.1007/s00267-006-0228-4
- Dennis, R. L., P. V. Bhave, and R. W. Pinder. 2008. Observable indicators of the sensitivity of PM2.5 nitrate to emission reductions. Part II: Sensitivity to errors in total ammonia and total nitrate of the CMAQ-predicted non-linear effect of SO2 emission reductions. Atmos. Environ. 42:1287–1300. doi:10.1016/j.atmosenv.2007.10.036
- Dockery, D. W., C. A. Pope, X. Xu, J. D. Spengler, J. H. Ware, M. E. Fay, B. G. Ferris, and F. E. Speizer. 1993. An association between air pollution and mortality in six U.S. cities. N. Engl. J. Med. 329:1753–1759. doi:10.1056/NEJM199312093292401
- Electric Power Statistics Information System. 2011. 2010 Electricity Generation Status. https://epsis.kpx.or.kr/epsis/ekkn/board/n/list.do?bbs_id=100243&cd_upper=100200&left_pos=100243 (accessed February 29, 2016).
- Energy Information Administration. 2014. International Energy Data and Analysis: Korea, South. http://www.eia.gov/beta/international/analysis_includes/countries_long/Korea_South/south_korea.pdf (accessed February 29, 2016).
- Guenther, A., T. Karl, P. Harley, C. Wiedinmyer, P. I. Palmer, and C. Geron. 2006. Estimates of global terrestrial isoprene emissions using MEGAN (Model of Emissions of Gases and Aerosols from Nature). Atmos. Chem. Phys. Discuss. 6:107–173. doi:10.5194/acpd-6-107-2006
- Hallquist, M., J. C. Wenger, U. Baltensperger, Y. Rudich, D. Simpson, M. Claeys, J. Dommen, et al. 2009. The formation, properties and impact of secondary organic aerosol: Current and emerging issues. Atmos. Chem. Phys. 9:5155–5236. doi:10.5194/acp-9-5155-2009
- Kelly, J. T., P. V. Bhave, C. G. Nolte, U. Shankar, and K. M. Foley. 2010. Simulating emission and chemical evolution of coarse sea-salt particles in the Community Multiscale Air Quality (CMAQ) model. Geosci. Model Dev. 3:257–273. doi:10.5194/gmd-3-257-2010
- Kim, S., C. Bae, E. Kim, B. U. Kim, H. Kim, J. H. Woo, C. K. Song, et al. 2015. Improving air quality forecasting systems in Korea. Presented at the 7th International Workshop on Air Quality Forecasting Resarch, College Park, MD, September 1–3, 2015.
- Kim, S.W., S.C. Yoon, J. Kim, and S.Y. Kim. 2007. Seasonal and monthly variations of columnar aerosol optical properties over East Asia determined from multi-year MODIS, LIDAR, and AERONET sun/sky radiometer measurements. Atmos. Environ. 41:1634–1651. doi:10.1016/j.atmosenv.2006.10.044
- Kim, Y., S.W. Kim, S.C. Yoon, M.H. Kim, and K.H. Park. 2014. Aerosol properties and associated regional meteorology during winter pollution event at Gosan Climate Observatory, Korea. Atmos. Environ. 85:9–17. doi:10.1016/j.atmosenv.2013.11.041
- Kim, Y. P. 2006. Air pollution in seoul caused by aerosols. J. Korean Soc. Atmos. Environ. 5:535–553.
- Korea Energy Economics Institute. 2013. Mid-term Korea Energy Demand Outlook. http://www.keei.re.kr/keei/download/outlook/MOL14e.pdf (accessed February 29, 2016).
- Kwok, R. H. F., S. L. Napelenok, and K. R. Baker. 2013. Implementation and evaluation of PM2.5 source contribution analysis in a photochemical model. Atmos. Environ. 80:398–407. doi:10.1016/j.atmosenv.2013.08.017
- Lee, S., C.H. Ho, Y. G. Lee, H.J. Choi, and C.K. Song. 2013. Influence of transboundary air pollutants from China on the high-PM10 episode in Seoul, Korea for the period October 16–20, 2008. Atmos. Environ. 77:430–439. doi:10.1016/j.atmosenv.2013.05.006
- Leem, J. H., S. T. Kim, and H. C. Kim. 2015. Public-health impact of outdoor air pollution for 2(nd) Air Pollution Management Policy in Seoul Metropolitan Area, Korea. Ann. Occup. Environ. Med. 27:7. doi:10.1186/s40557-015-0058-z
- Levy, J. I., and J. D. Spengler. 2002. Modeling the benefits of power plant emission controls in Massachusetts. J. Air Waste Manag. Assoc. 52:5–18. doi:10.1080/10473289.2002.10470753
- Lim, H., and B. J. Turpin. 2002. Origins of primary and secondary organic aerosol in Atlanta: Results of time-resolved measurements during the Atlanta Supersite Experiment. Environ. Sci. Technol. 36:4489–4496. doi:10.1021/es0206487
- Liu, H. 2003. Transport pathways for Asian pollution outflow over the Pacific: Interannual and seasonal variations. J. Geophys. Res. 108(D20):8786. doi:10.1029/2002JD003102
- Ministry of Environment. 2014. 2nd Metropolitan Air Quality Control Master Plan (or 2nd Seoul Metropolitan Air Quality Improvement Plan). http://eng.me.go.kr/eng/web/index.do?menuId=238 (accessed February 29, 2016).
- Ministry of Knowledge Economy. 2013. The Sixth Basic Plan for Long-Term Electricity Supply and Demand (BPE) (2013–2027). http://www.motie.go.kr/common/download.do?fid=bbs&bbs_cd_n=37&bbs_seq_n=104486&file_seq_n=1 (accessed February 29, 2016).
- National Center for Atmospheric Research. 2015. NCEP FNL operational model global tropospheric analyses, continuing from July 1999. http://rda.ucar.edu/datasets/ds083.2/ (accessed February 29, 2016).
- National Institute of Environmental Research. 2012. Joint Research on Long-Range Transboundary Air Pollutants. http://www.prism.go.kr/homepage/researchCommon/downloadResearchAttachFile.do;jsessionid=E601A3BBD286FFE25217BDD56715EA6D.node02?work_key=001&file_type=CPR&seq_no=004&pdf_conv_yn=Y&research_id=1480000-201300192 (accessed February 29, 2016).
- National Institute of Environmental Research. 2014. Clean Air Policy Support System. http://capmos.nier.go.kr/sub_03_01.jsp?pseq=10 (accessed February 29, 2016).
- North American Research Strategy for Tropospheric Ozone (NARSTO). 2004. Particulate Matter Science for Policy Makers: A NARSTO Assessment, ed. J.V.P. McMurry and M. Shepherd. Cambridge, UK: Cambridge University Press.
- Polidori, A., B. J. Turpin, H.J. Lim, J. C. Cabada, R. Subramanian, S. N. Pandis, and A. L. Robinson. 2006. Local and regional secondary organic aerosol: Insights from a year of semi-continuous carbon measurements at Pittsburgh. Aerosol Sci. Technol. 40:861–872. doi:10.1080/02786820600754649
- Pope, C. A., M. Ezzati, and D. W. Dockery. 2009. Fine-particulate air pollution and life expectancy in the United States. N. Engl. J. Med. 360:376–386. doi:10.1056/NEJMsa0805646
- Robinson, A. L., N. M. Donahue, M. K. Shrivastava, E. A. Weitkamp, A. M. Sage, A. P. Grieshop, T. E. Lane, J. R. Pierce, and S. N. Pandis. 2007. Rethinking organic aerosols: Semivolatile emissions and photochemical aging. Science 315:1259–1262. doi:10.1126/science.1133061
- Statistics Korea. 2016. National Indicator System. http://www.index.go.kr/potal/main/EachDtlPageDetail.do?idx_cd=1007 (accessed February 29, 2016).
- Streets, D. G. 2003. An inventory of gaseous and primary aerosol emissions in Asia in the year 2000. J. Geophys. Res. 108(D21):8809. doi:10.1029/2002JD003093
- Thurston, G. D., R. T. Burnett, M. C. Turner, Y. Shi, D. Krewski, R. Lall, K. Ito, et al. 2015. Ischemic heart disease mortality and long-term exposure to source-related components of U.S. fine particle air pollution. Environ. Health Perspect. in press. doi:10.1289/ehp.1509777
- United Nations. 2011. Demographic Yearbook 2009–2010. New York: United Nations. http://unstats.un.org/unsd/demographic/products/dyb/dybsets/2009-2010.pdf (accessed February 29, 2016).
- U.S. Environmental Protection Agency. 2009. Final Report: Integrated Science Assessment for Particulate Matter. Washington, DC: U.S. Environmental Protection Agency. http://cfpub.epa.gov/ncea/cfm/recordisplay.cfm?deid=216546#Download (accessed February 29, 2016).
- U.S. Environmental Protection Agency. 2014. Modeling Guidance for Demonstrating Attainment of Air Quality Goals for Ozone, PM2.5, and Regional Haze (Draft). http://www.epa.gov/ttn/scram/guidance/guide/Draft_O3-PM-RH_Modeling_Guidance-2014.pdf (accessed February 29, 2016).
- Yarwood, G., R. E. Morris, and G. M. Wilson. 2007. Particulate Matter Source Apportionment Technology (PSAT) in the CAMx Photochemical Grid Model. Air Pollut. Model. Its Appl. XVII:478–492. doi:10.1007/978-0-387-68854-1_52
- Zhang, W., S. L. Capps, Y. Hu, A. Nenes, S. L. Napelenok, and A. G. Russell. 2012. Development of the high-order decoupled direct method in three dimensions for particulate matter: Enabling advanced sensitivity analysis in air quality models. Geosci. Model Dev. 5:355–368. doi:10.5194/gmd-5-355-2012