
ABSTRACT
Petroleum coke or “petcoke” is a solid material created during petroleum refinement and is distributed via transfer facilities that may be located in densely populated areas. The health impacts from petcoke exposure to residents living in proximity to such facilities were evaluated for a petcoke transfer facilities located in Chicago, Illinois. Site-specific, margin of safety (MOS) and margin of exposure (MOE) analyses were conducted using estimated airborne and dermal exposures. The exposure assessment was based on a combined measurement and modeling program that included multiyear on-site air monitoring, air dispersion modeling, and analyses of soil and surfaces in residential areas adjacent to two petcoke transfer facilities located in industrial areas. Airborne particulate matter less than 10 microns (PM10) were used as a marker for petcoke. Based on daily fence line monitoring, the average daily PM10 concentration at the KCBX Terminals measured on-site was 32 μg/m3, with 89% of 24-hr average PM10 concentrations below 50 μg/m3 and 99% below 100 μg/m3. A dispersion model estimated that the emission sources at the KCBX Terminals produced peak PM10 levels attributed to the petcoke facility at the most highly impacted residence of 11 μg/m3 on an annual average basis and 54 μg/m3 on 24-hr average basis. Chemical indicators of petcoke in soil and surface samples collected from residential neighborhoods adjacent to the facilities were equivalent to levels in corresponding samples collected at reference locations elsewhere in Chicago, a finding that is consistent with limited potential for off-site exposure indicated by the fence line monitoring and air dispersion modeling. The MOE based upon dispersion model estimates ranged from 800 to 900 for potential inhalation, the primary route of concern for particulate matter. This indicates a low likelihood of adverse health effects in the surrounding community. Implications: Handling of petroleum coke at bulk material transfer facilities has been identified as a concern for the public health of surrounding populations. The current assessment, based on measurements and modeling of two facilities located in a densely populated urban area, indicates that petcoke transport and accumulation in off-site locations is minimal. In addition, estimated human exposures, if any, are well below levels that could be anticipated to produce adverse health effects in the general population.
Introduction
Petcoke is an international commodity used primarily as a fuel but also as a feedstock in manufacture of steel, paper, brick, glass, and titanium dioxide (American Fuel & Petrochemical Manufacturers [AFPM], Citation2014; Andrews and Lattanzio, Citation2013). Calcined petcoke is the major raw material used to make carbon anodes used in processing alumina into aluminum metal. Production of petcoke is increasing in the United States as a result of increased refining of heavier crude oils imported from foreign countries. Petcoke is a product created during petroleum refinement and is a black solid composed primarily of carbon and residual components, including elemental forms of sulfur, metals, and nonvolatile inorganic compounds. The composition of petcoke depends, in part, on the composition of the starting materials in the petroleum refinement, and so petcoke composition can vary (Andrews and Lattanzio, Citation2013).
Petcoke is formulated as either green coke (CAS 64741-79-3) or calcined coke (CAS 64743-05-1). Both green coke and calcined coke have similar manufacturing processes and similar physical and chemical characteristics (High Production Volume Testing Group [HPV], Citation2007). The additional thermal processing of green coke removes residual hydrocarbons and volatile matter, increasing the percentage of carbon, creating calcined coke (Andrews and Lattanzio, Citation2013), which is approximately 98% carbon. Green coke toxicity data are used to predict data for assessments on calcined coke, as green coke has a higher concentration of hydrocarbons and metals than calcined coke and is expected to be more toxic (HPV, Citation2007).
Petcoke is typically transported from refineries to end users by rail, barge, or truck and often is held temporarily at bulk material transfer stations with multimodal transport capability. These facilities tend to be located in industrial areas adjacent to waterways, railroads, and major roadways. The potential health risks posed to communities located adjacent to petcoke transfer facilities is an important research question. Regulatory and other government organizations have conducted few screening level assessments of petcoke facilities (e.g., Caruso et al., Citation2015).
In order to address this research question, we conducted a risk assessment of two facilities located in Chicago, Illinois, that transfer petcoke and coal. Air emissions from these bulk handling facilities potentially result in residential inhalation exposure of fugitive petcoke dust and dermal exposure. We conducted an exposure and risk assessment based in part on a multiyear investigation of potential exposures to petcoke at these facilities. In addition, since residential exposure limits for fugitive petcoke dust do not exist and since health risks for potential residential inhalation exposures from fugitive dusts have been established by the U.S. National Ambient Air Quality Standard (NAAQS) for particulate matter (aerodynamic diameter <10 μm; PM10), this assessment was also based in part on a margin of safety (MOS) approach using the NAAQS PM10 as a safe dose. A margin of exposure (MOE) was also developed with experimental animal data to evaluate exposures that occasionally exceeded the NAAQS PM10 value so as to offer another perspective of potential health risk. Dermal exposure was also evaluated with a MOE approach using detection limits for petcoke based on the signature analytes vanadium and nickel.
Methods
Site description
Koch KCBX Terminals Company handles petcoke and coal at two facilities in the Greater Calumet Industrial Area in the southeastern section of Chicago, Illinois. The 45-acre KCBX North Terminal at 3259 E. 100th Street, Chicago, is approximately 1.5 km due north of the 80-acre South Terminal at 10730 South Burley Avenue, Chicago. The terminals have operated at these locations for more than 20 yr. The North Terminal was closed in 2015, whereas the South Terminal remains operational. The area encompassing the terminals is bordered to the south by a zinc smelter and abandoned industrial properties. To the north, the facilities are bordered by a power plant, metal recycling facilities, and scrap yards. A concrete plant, other bulk material transfer stations, and manufacturing facilities are located between the North and South terminals. Railways and the Calumet River are immediately to the west and east of the two facilities, beyond which are zoned residential areas primarily consisting of stand-alone homes, multitenant residential buildings, and commercial buildings typical of urban communities. Both terminals operate fugitive dust suppression systems consisting of water cannons (19 and 42 cannons at the North and South facilities, respectively) that wet the material piles, water trucks, and hard-top, on-site roads. The associated storm water management systems are operated under permits issued by the State of Illinois.
Hazard identification and dose-response
Studies of petcoke exposure to humans and experimental animals have focused on inhalation as the principle route of exposure (see Table S1). The epidemiological analyses of petcoke exposures were assessed in only one cohort, in Canadian petroleum workers (Lewis et al., Citation2003; Schnatter et al., Citation2012). Although the earlier analysis of this cohort (Lewis et al., Citation2003) indicated a significant increase in lung cancer incidence related to cumulative petcoke exposures greater than 0.07 mg/m3-yr, an enhanced statistical analysis of the same cohort using additional data on smoking habits and asbestos exposure (Schnatter et al., Citation2012) determined that the observed increases in lung cancer incidence were unlikely to be related to petcoke exposure. Multiple occupational epidemiology studies investigated health effects amongst coke oven workers but did not assess the risks of petcoke specifically and are confounded by other industrial exposures (Caruso et al., Citation2015; Constantino et al., 1995; Boffetta et al., Citation1997; Miller et al., Citation2013; Lewis et al., Citation2003; Schnatter et al., Citation2012; Wu et al., Citation1988; Chau et al., Citation1993; Swaen et al., Citation1991).
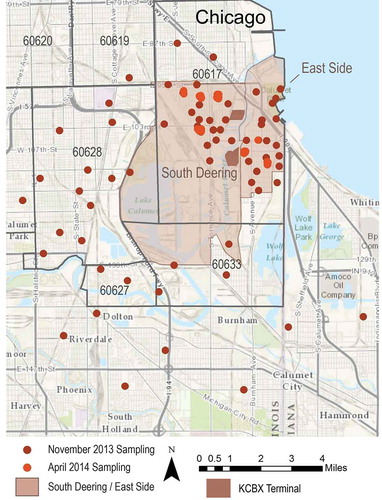
Studies on the relationship between nonoccupational petcoke exposure and community health outcomes are extremely limited. ToxStrategies (Citation2015) used publicly available health outcome data to compare asthma hospitalization rates and cancer incidence between ZIP code 60617, which includes the South Deering and East Side neighborhoods, and all other ZIP codes in Chicago (see map in ). Asthma hospitalization rates were obtained from the Chicago data portal (City of Chicago, 2015). Cancer incidence data were obtained from the Illinois Department of Public Health (IDPH) Illinois State Cancer Registry (IDPH, 2015). Population demographic data were obtained by ZIP code from the U.S. Census Bureau (2015a, 2015b), the Chicago data portal (City of Chicago, 2015), and the Social IMPACT Research Center (2015). Neither univariate nor multivariate regression analysis indicated that residing in close proximity to the KCBX facilities (ZIP code 60617) increased asthma hospitalization or cancer incidence, compared with other areas of Chicago. However, these findings are limited due to the absence of defined population exposures, the unknown length of residence, confounding factors of various industrial exposures, and in the case of cancer, whether the length of exposures matched the latency period for cancers of concern.
Figure 1. Air monitoring locations at KCBX North and South transfer facilities.
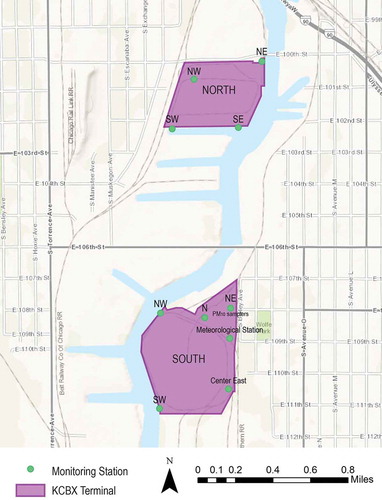
Figure 2. Wind rose developed from on-site meteorological measurements.
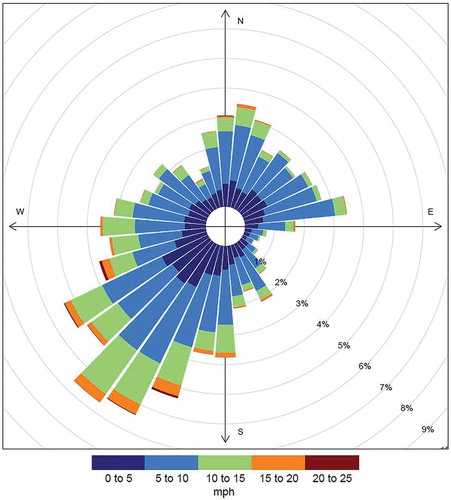
Figure 3. Locations of soil and wipe sampling near KCBX Terminals in Chicago, Illinois.
Due to the lack of clear evidence between residential exposure and human health outcomes, petcoke toxicity data from rats, mice, and monkeys were investigated. These human and experimental animal data are summarized in Supplemental Material (Table S1). In the inhalation key study used in this site-specific exposure assessment, rats did not show any systemic toxicity from exposure of air concentrations of petcoke of 10,000 or 30,000 μg/m3 6 hr/day, 5 days/week for 2 yr (Klonne et al., Citation1987), but did demonstrate increased lung weights and accumulation of petcoke in the lungs and in lymph nodes at both concentrations and lung inflammation. Thus, the lowest observed adverse effect concentration (LOAEC) was identified and used in this study was 10,000 μg/m3. For shorter-term exposures, specifically 6 hr/day for 5 days, the most sensitive LOAEC was in rats where lung inflammation occurred at an air concentration of 45,000 μg/m3 (Huntingdon Life Sciences [HLS], Citation1999). In a dermal exposure study, mice did not exhibit any consistent toxicity when petcoke was applied to skin at concentrations of 250,000 μg of petcoke per milliliter in mineral oil administered three times per week for a lifetime (reported by Wingate and Hepler, 1982, as cited in HPV, Citation2007). Some thickening of skin was observed in the area of treatment.
Exposure assessment
The purpose of the exposure assessment was to develop exposure estimates to be used to assess risks from potential migration of particular matter (PM) from the facilities. To assess exposure, we used air dispersion modeling, on-site air monitoring, and field sampling outside the property lines of the bulk material facility. The exposure assessment for this study entailed synthesis of existing information from numerous regulatory-related activities, including permitting processes and State of Illinois routine air quality monitoring, combined with new measurement and modeling activities sponsored by the property owner and U.S. Environmental Protection Agency (EPA) to assess potential impacts to the neighborhood from the facility. The primary components of the exposure assessment are described in Supplemental Material (Table S2).
Source characterization
We collected bulk samples of petcoke (n = 6) and coal (n = 11) from the surfaces of the largest storage piles at each terminal on November 26–27, 2013, to assess chemical profiles of source materials. The samples were analyzed for semivolatile organic compounds based on the EPA Standard Operating Procedure (SOP) SW-846 Method 8270C, for trace metals by inductively coupled plasma mass spectrometry (ICP-MS) according to EPA Method 6020A, and mercury by cold-vapor atomic absorption via EPA Method 7471A (STAT Analysis Corporation, Chicago, IL). The information on chemical composition of petcoke and coal was used to establish a “signature” for the petcoke and coal at the stations that are compared to the test results for environmental media collected from off-site locations.
The EPA Region 5 (R5) also determined the chemical composition of petcoke from the two transfer stations. On April 2, 2014, EPA R5 collected five petcoke samples from the North transfer station and six petcoke samples from the South transfer station and analyzed by the EPA Chicago Regional Laboratory (CRL) for trace metals using ICP-AES in accordance with CRL SOP Metals S004, Revision 7.2 (EPA Method 200.7).
The City of Chicago Department of Public Health (CDPH) engaged in source characterization for the transfer stations (Whiting, Citation2014). CDPH prepared a composite sample of petcoke by combining portions of the 11 petcoke samples and 1 duplicate sample collected by EPA R5. The composite sample was analyzed for trace metals by EPA Method 200.7, mercury by EPA Method 7471B, and total sulfur by EPA Method E3.2.3 during October 2014 (Test America Laboratories, Denver, CO). A portion of the composite sample was submitted to the University of Colorado Laboratory for Environmental Geological Sciences in Boulder, Colorado, for evaluation of individual grains of dust by scanning electron microscopy and electron microprobe analyses (Whiting, Citation2014).
Air monitoring
To determine the concentrations of particles in the air, fence line air monitoring was conducted at the North and South terminals from February 2014 to the present using Federal Equivalent Method (FEM) PM10 monitoring stations (BAM-1020 monitors). The monitors provide 1-hr average PM10 measurements on a continuous basis, with five monitors at the South Terminal and four at the North Terminal (). At one of the monitoring locations at each terminal, 24-hr PM10 filter samples are collected every 3 days and analyzed for elemental and organic carbon (EC/OC) and heavy metals (i.e., petcoke and coal constituents). In addition, meteorological measurements (wind speed, wind direction, temperature, and barometric pressure) are collected on-site at the South Terminal, as shown in . A wind rose developed from on-site meteorological data collected from February 18, 2014, through April 4, 2015, shows that winds are predominantly from the southwest ().
The PM10 monitors are located within the facility fence lines and measure ambient air on areas of the property not accessible by the public. The measured levels are therefore not subject to the NAAQS for PM10. Nonetheless, the NAAQS for PM10 of 150 μg/m3 on a 24-hr average basis does provide a point of reference as an indicator of exposure that can be used for analyzing the human health risk with a MOS approach. The Cook County Department of Environmental Control has also operated an hourly PM10 monitoring site approximately ½ mile southeast of the southern bulk transfer facility since 2001. We include the NAAQS and observations from the community monitoring station when describing the PM10 measurements from our fence line monitoring networks.
AERMOD modeling
EPA-approved AERMOD (American Meteorological Society/U.S. Environmental Protection Agency Regulatory Model) air quality modeling was used to evaluate the dispersion of PM10 emissions from the KCBX North and South terminals. This air dispersion modeling was performed to supplement the fence line PM10 measurements, which do not provide direct information on off-site air quality impacts; rather, they reflect background PM10 concentrations and the impact of local emission sources other than the KCBX material piles. AERMOD was run using emissions data compiled by the facilities for 2013, and the model included emission estimates for vehicle traffic, material transfers, and windblown erosion from stockpiles. For 2013, estimated PM10 emissions totaled 22.9 tons for the South Terminal and 40.2 tons for the North Terminal, whereas PM2.5 emissions totaled 2.6 tons for the South Terminal and 5.6 tons for the North Terminal. Thus, although PM2.5 monitoring data are not available, PM2.5 emissions account for only about 13% of the PM10 emitted at the two terminals combined.
AERMOD inputs also included 5 yr (2009–2013) of surface meteorological data from Chicago Midway Airport (KMDW) and upper air data from Davenport Airport (KDVN) in Iowa. The use of 5 yr of meteorological data from these sites provided an evaluation of PM10 dispersion under a wider range of meteorological conditions than would be possible using the 1-yr meteorological data available from on-site measurements. Additional details on the AERMOD simulations are provided in Supplemental Material.
Off-site sampling
To determine the chemical composition of soil and surface dust in the vicinity of the facilities, we collected soil and surface dust samples from publicly accessible parks, bus stops, and rights of way located throughout the East Side and South Deering neighborhoods of southeast Chicago that abut the facilities (). An attempt was made to collect samples from all parks in the two neighborhoods; bus stops and rights of way were sampled in locations without parks. To obtain a reference set of data, we collected soil and surface dust samples from more than nine Chicago neighborhoods that are comparatively distant (minimum of approximately 1.6 km) from the facilities. In the abutting neighborhoods, approximately half of the samples were collected from rights of way adjacent to roads, whereas most (88%) samples in the reference neighborhoods were obtained from parks. In both the abutting and reference areas, we obtained samples from exposed soil, benches, bleachers, shelters, and buildings. These locations were selected as reasonable surrogates of homes, buildings, and yards on private property, since windblown petroleum coke and coal would be expected to impact public and private spaces similarly.
We gathered soil and surface dust samples during two time periods that were selected to represent meteorological conditions that would be unlikely to underestimate potential transport of petcoke from the facilities and accumulation in the surrounding community. We obtained 43 samples of soil and surface dust (86 total) in the abutting area and 26 of each sample type in the reference area on November 26, 27, and 29, 2013, a period preceded by 9–12 days of dry conditions following precipitation on November 17, 2013. We returned on April 2, 2014, following a 24-hr period with wind gusts of more than 40 miles per hour and obtained an additional 8 samples of soil and 39 samples of surface dust from the abutting area. A total of 77 soil samples (51 from the abutting area, 26 from the control area) and 108 surface wipe samples were collected (82 from the abutting area, 26 from the control area). The soil samples were collected following a similar method to the Illinois EPA (IEPA)-approved field sampling plan used by the U.S. Geological Survey (USGS, Citation2003), whereas the corresponding surface dust samples were collected following American Society for Testing and Materials (ASTM) Methods D6966-13 and D6661-10. The soil and surface wipe samples were analyzed for trace metals and semivolatile organic compounds according to EPA Method 6020A and EPA SOP SW-846 Method 8270C, respectively (STAT Analysis Corporation, Chicago, IL). Detection limits for the wipe samples were 2.5 μg per 100 cm2 for V and Ni, and 1 μg per 100 cm2 for polycyclic aromatic hydrocarbons (PAHs).
EPA R5 collected one surface dust sample from each of 14 residential addresses less than 0.5 km from either the North or South station on April 17, 2014. The samples were analyzed by CRL. Metals analysis was performed by EPA Method 200.7, which utilizes inductively coupled plasma optical emission spectroscopy (ICP-OES) for the determination of metals. PAHs were determined with EPA Method 8270.
As with the source characterization activities, CDPH also engaged in evaluation of off-site conditions. On September 19, 2014, CDPH directed collection of three samples of dust from sections of concrete sidewalk alongside South Buffalo Avenue between East 108th, 109th, and 110th Streets and less than 1 km east/northeast of the South transfer station (Whiting, Citation2014). The samples were submitted to University of Colorado Laboratory for Environmental and Geological Sciences in Boulder, Colorado, for evaluation of individual grains of dust by scanning electron microscopy and electron microprobe analyses.
Data analysis
A range of comparative statistical analyses were done to determine whether facility-related indicators of petcoke and coal were present in the abutting neighborhoods at levels different from reference data or “anthropogenic background” for the area. The reference data that we relied upon are described in .
Table 1. Reference data used for comparison with on-site measurements.
Descriptive analyses of trace metal and PAH concentrations in petcoke, coal, and reference data for soil, surface dust, and air in Chicago were used to identify types of chemical indicators for coal and petcoke signatures at the transfer stations. We found two primary types of indicators:
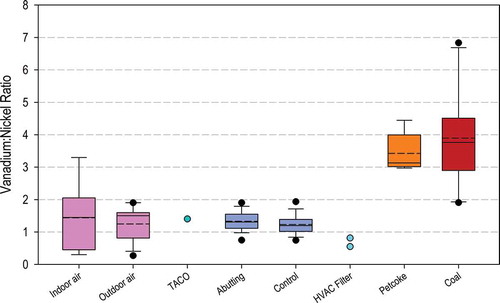
Element ratio: approximately 3.5-fold enrichment for the ratio of vanadium to nickel in petcoke and coal in comparison with the reference data (see )
Proportions of 16 PAHs in soil samples compared with proportions in petcoke, coal, and reference data (see Tables S4 and S5).
Table 2. Composition data for different mixture types of petcoke.
We used two-sample t-tests to test the hypothesis that the level of a chemical indicator was greater in the neighborhoods abutting the facilities than the corresponding level in each of the applicable reference data sets. Because motor vehicles and their fuels and lubricants can be sources of heavy metals and PAHs, we used multivariate regression that included a dummy variable for samples collected along roads and railways to account for differences in the proportion of samples collected along rights of way between the abutting and control areas. We also evaluated concordance of the distribution of PAH concentrations between the abutting and reference data sets. For this analysis, we calculated the median concentration of each PAH in each data set (i.e., abutting area, reference area, and other reference data sets). Next, we calculated the Pearson correlation coefficient between each possible pair of vectors of median PAH concentrations and tested whether a given coefficient was statistically significant and whether pairs of coefficients were different from each other.
In addition to making comparisons between locations, we also tested if the chemical indicators decreased with increasing distance from the facilities within the abutting neighborhoods. We used a geographic information system (Environmental Systems Research Institute [ESRI], Citation2012) to determine the nearest straight-line distance between a sample location and any point on the property line of the North and South terminals. Next, we calculated the Spearman correlation coefficient between distance and the level of each indicator and tested the hypothesis that the coefficient was less than zero.
All calculations and statistical analyses were performed with R (R Core Team, Citation2012). Analyses were limited to parameters for which more than 60% of the observations were greater than the analytical limit of detection.
Quality assurance
A series of quality assurance steps were performed. A chain of custody form followed each physical sample from the field, to the laboratory, and finally to the database manager. All gravimetric and chemical analyses were performed in accordance with quality assurance measures prescribed by the methods and are reported elsewhere. Limits of detection and spike recoveries were determined for each metal and organic species tested. Field blanks were collected at a rate of approximately 10% for wipe samples, and duplicate field samples were obtained at rate of approximately 20% of soil and 10% of wipe samples. The on-site beta attenuation monitor underwent leak, flow, and temperature/pressure checks twice monthly. For PM10 filter measurements, laboratory quality control for metals analysis included the analysis of a calibration blank before each analyzer run.
Risk characterization
Our assessment is based in part on findings of other organizations and on an independent literature review, using methods more fully described by the EPA (EPA, Citation1986, Citation2000, 2002, 2005). MOEs are used to assess hazard for health effects using methods as defined by Barnes and Dourson (Citation1988) and the International Programme on Chemical Safety (IPCS, Citation2004). Here, the MOE is defined as the magnitude by which the no observed adverse effect concentration (NOAEC) or other point of departure of the critical toxic effect exceeds the estimated exposure dose (EED), where both are expressed in the same units. This is shown in eq 1:
When the MOE is equal to or greater than the underlying uncertainty factors, the need for regulatory concern is likely to be small. The appropriate size of the underlying uncertainty factors relies on expert judgment. A related concept, the MOS is also used in this assessment based on the IPCS (Citation2004). The MOS is defined as the margin between the safe dose or concentration and the estimated exposure dose or EED. This is shown in eq 2:
When the MOS is equal to or greater than 1, the need for regulatory concern is small.
Results
Hazard identification and dose-response
When data on specific “whole mixtures” toxicity are unavailable, as is the case with the neighborhoods under consideration, surrogate data of a “sufficiently similar” mixture is used (EPA, Citation1986, Citation2000; Marshall et al., Citation2013; Stork et al., Citation2008; Seed et al., Citation1995) to provide an estimate of the toxicity of the mixture under investigation. The EPA and others consider the different petcoke mixture types in the same chemical category, and the petcoke mixtures are evaluated for toxicology in the same manner and can be used for read-across data for assessments on calcined coke. This is because green coke has a higher concentration of hydrocarbons and metals than calcined coke, which makes it more likely to be toxic than calcined coke (HPV, Citation2007; Andrews and Lattanzio, Citation2013). We have used the toxicity of green coke in our assessment as well. Consistency of toxic effect is evident across studies and species, however, regardless of composition of the petcoke that was tested (HLS, Citation1999; Klonne et al., Citation1987; McKee et al., Citation2013). All the forms of petcoke (green and calcined) tested exhibited portal of entry effects. For example, Klonne et al. (Citation1987) identified portal of entry inflammatory effects in rats exposed to delayed-process micronized green coke. This portal of entry effect is consistent with exposure to insoluble inert particulates of this size range.
Because the available epidemiology literature is limited, the experimental animal studies were used for toxicity end points. For longer-term chronic exposures, the most sensitive LOAEC was in rats where increased lung weights, accumulation of petcoke, and signs of lung inflammation were seen at an air concentration of 10,000 μg/m3 (Klonne et al., Citation1987). For shorter-term exposures, the most sensitive LOAEC was in rats where lung inflammation occurred at an air concentration of 45,000 μg/m3 (HLS, Citation1999). For dermal exposures, mice did not exhibit any consistent toxicity when petcoke was applied to skin at concentrations of 250,000 μg of petcoke per milliliter in mineral oil three times per week for a lifetime (reported by Wingate and Hepler, 1982, as cited in HPV, Citation2007). Some thickening of skin was observed in the area of treatment, so this level can also be considered a LOAEC.
Exposure assessment
Source characterization
Trace element and PAH concentrations measured in bulk samples of petcoke and coal obtained from the transfer facilities in Chicago by the present authors and by EPA R5 are summarized in Supplemental Material (Tables S4 and S5). The concentrations of metals from our analyses were generally greater than those reported by EPA R5. However, as highlighted in , a higher proportion of vanadium compared with nickel was measured in the EPA R5 samples (V:Ni range: 3.6–12.1) compared with our samples (V:Ni range: 3.0–4.4). The corresponding V:Ni ratios reported by the EPA are approximately 2–3 times greater than those we report. The V:Ni ratios derived by both groups are greater than those derived from anthropogenic background levels of vanadium and nickel in soil and other common environmental media. Therefore, our findings and those of EPA R5 support the use of the V:Ni ratio as a chemical indicator for coal and petcoke. Because the V:Ni ratios from our analyses are closer to anthropogenic background and hence more conservative for purposes of signal detection, we chose to use those values in our analyses of potential off-site impacts.
Table 3. Summary of vanadium and nickel in source materials.
Furthermore, in a side-by-side comparison, our chemical analyses of petcoke from the facility in Chicago demonstrate a high degree of similarity with green petcoke described by other researchers, as shown in . Thus, the source material in Chicago falls within a sufficiently similar range to the petcoke that has been tested in experimental animals, and it follows that these latter data can be used with confidence to project the likely mode of action and critical effect of petcoke to humans in this environment.
Measured and modeled PM10 concentrations
A total of 3646 validated 24-hr average PM10 observations were obtained from the nine monitors comprising the networks around the two transfer facilities from February 18, 2014, through April 4, 2015. The average daily PM10 concentration at the KCBX Terminals was 32 μg/m3. As shown in , 89% of 24-hr average PM10 concentrations at the KCBX Terminals were below 50 μg/m3, whereas 99% of the 24-hr average PM10 concentrations were below 100 μg/m3. Four (0.1%) of the daily measurements exceeded 150 μg/m3 at 155, 156, 156, and 175 μg/m3.
Figure 4. Histogram of 24-hr average PM10 concentrations at the KCBX Terminals, February 18, 2014, to April 4, 2015.
Analysis of the speciated PM10 data obtained from filter samples indicated that, on average, the target species (heavy metals and EC/OC) accounted for less than 40% of total PM10 mass. This analysis provides an upper-bound estimate on the contribution of petcoke and coal dust to measured PM10 concentrations, as other sources of heavy metals and EC/OC are present in the vicinity of the terminals. Additional information on the speciated PM10 data is provided in Supplemental Material (Figures S1, S2, and S3).
PM10 monitoring at the KCBX Terminals was supplemented by AERMOD to isolate the impact of on-site emission sources (as PM10 measurements include the impact of other sources) and to evaluate potential off-site impacts of PM10 emissions from the terminals. AERMOD predictions were consistent or somewhat lower than PM10 on-site measurements, as 99% of daily PM10 concentrations predicted for monitor locations at the North and South terminals were below 50 μg/m3. The peak (worst case) daily impacts predicted by AERMOD at the terminal fence lines were 115 μg/m3 at the North Terminal and 70 μg/m3 at the South Terminal. These modeled values are lower than the peak observed concentrations, the latter of which captured influences (e.g., background PM10 concentrations and off-site emission sources) not considered in the AERMOD modeling.
At residential locations beyond the terminal fence lines, the peak daily PM10 concentrations predicted by AERMOD were 54 μg/m3 or lower for residences near the North Terminal, and 26 μg/m3 or lower for residences near the South Terminal, as shown in .The residences where peak modeled impacts occurred were 75–90 m from the facility fence lines. also shows the peak annual average PM10 concentrations predicted by AERMOD for residential locations.
Table 4. AERMOD modeling predictions for maximum annual average and daily PM10 concentrations at residences near KCBX Terminals.
Table 5. Average (standard deviation) concentrations of sulfur, vanadium, and nickel in KCBX petcoke and grains of sidewalk dust.a
Modeling results showed that PM10 concentrations associated with emissions from the KCBX Terminals decrease sharply with increasing distance from the facility. For example, shows modeled PM10 concentrations along a transect representing the predominant wind for a selected date (January 15, 2013). This figure indicates that PM10 concentrations decreased rapidly within 100 m of the facility fence line, dropping from 72 to 25 μg/m3 over that downwind distance.
Figure 5. AERMOD-predicted PM10 concentrations with downwind distance from the KCBX South Terminal for January 15, 2013.
Off-site sampling
shows the ratios of vanadium to nickel measured in samples collected in the abutting and control neighborhoods; in petcoke and coal from the facility; and in relevant reference data. The reference data include previous studies of indoor air (Habre et al., Citation2014; Kinney et al., Citation2002; Clougherty et al., Citation2011; Graney et al., Citation2004; Yankoleva et al., Citation1999), ambient air in Chicago (AirData; EPA, Citation2013), as well as the V:Ni ratios derived from background levels in soil established by the State of Illinois Tired Approach for Corrective Action (TACO) program (Illinois Administrative Code, Citation2013). The average V:Ni ratios found in the abutting neighborhood soil samples were significantly lower than those measured in petcoke (mean difference = −2.10, P < 0.01, confidence intervals [CI] = −2.71, −1.48) and coal (mean difference = −2.57, P < 0.01, CI = −3.60, −1.53). There was no significant difference between the average V:Ni ratios in the abutting and reference area soil samples (mean difference = 0.10, P = 0.23, CI = −0.06, 0.26).
Figure 6. Vanadium-to-nickel ratios for source materials (petcoke and coal) compared with measured indicators.
shows the relative proportions of 16 PAHs measured in soil in the abutting and control neighborhoods as well as in source material from the facility. The relative proportions of these PAHs are also compared with those reported by USGS and TACO for Chicago urban soils. The composition of PAHs in soil measured in the abutting neighborhood was very similar to those found in the reference neighborhoods (r = 0.99, P = < 0.01) and not associated with the distribution of PAHs in petcoke from the facility (r = 0.38, P = 0.15). In addition, the composition of PAHs in soil of the abutting neighborhood was strongly and positively correlated with PAHs in soil reported by USGS (r = 0.97, P = < 0.01) and TACO (r = 0.98, P = < 0.01). Thus, PAH composition were not increased or altered in abutting neighborhoods.
Figure 7. Correlation matrix of proportions of PAHs in abutting, control, reference, and source materials.
A spatial gradient consistent with wind-borne transport of petcoke from the KCBX Terminals was not present. Vanadium-to-nickel ratios did not show a trend with distance (r = −0.08, P = 0.59, 95% CI = −0.35, 0.20), whereas the correlation coefficients between PAH profiles in petcoke and soil samples were weakly inversely correlated with distance from the terminals (r = −0.32, P = 0.02, CI = −0.54, −0.04).
Chemical indicators for petcoke and coal were rarely detected on the surfaces sampled from both the abutting and control neighborhoods. Both V and Ni levels were above the reporting limits in only one sample from the abutting neighborhoods, whereas one metal but not the other was present above the reporting limit in four samples from the abutting neighborhoods. Similarly, V and Ni were present above the reporting limits in only two samples from the control neighborhoods. One or more PAHs were measured above the detection limit in only 6 of 122 wipe samples from the abutting neighborhood.
In the three samples of bulk material collected from sidewalks in the abutting neighborhood, the City of Chicago tentatively identified 12 grains of dust as petcoke. The concentrations of sulfur, vanadium, and nickel reported for those grains of material are presented in as reproduced from Whiting (Citation2014). In a two-sample t test, we found that the average concentrations of S, V, and Ni reported for the sidewalk dust particles tentatively identified as petcoke were significantly different from the corresponding concentrations reported for S, V, and Ni in the samples of petcoke from the facilities (P = 0.0008, 0.005, and 0.008, respectively).
Risk characterization
Based on the results of hazard identification and dose-response assessment of petcoke (Table S1), and exposure assessment of PM10 values around the chosen site as described in , a MOS analysis was conducted for potentially inhaled petcoke dust using the existing NAAQS PM10 standard of 150 µg/m3 of EPA (CFR 71 FR 61144, 2006) as the safe concentration. This analysis was based on the predicted worst 1-day average PM10 over 5 yr of 54 µg/m3 and the 5-yr PM10 average of 11 µg/m3 as a safe concentration. Using eq 2, MOSs were approximately 3 and 14, respectively (MOS = 150 µg/m3 ÷ 54 µg/m3 ≈ 3; or MOS = 150 µg/m3 ÷ 11 µg/m3 ≈ 14). These MOSs suggest adverse effects are not expected from the inhalation of petcoke dust at this site, including adverse effects in sensitive subgroups, since values of 1 and above mean that the existing PM10 standard is at or greater than the worst 1-day average PM10 over 5 yr or the 5-yr PM10 average.
Occasionally the 1-day average exposure to PM10 was above 150 µg/m3. In such cases a MOE analysis was used to characterize potential health risk. MOEs were developed by dividing the most appropriate NOAEC or LOAEC by either the predicted worst 1-day average PM10 in 5 yr of 54 μg/m3 or the 5-yr PM10 average of average of 11 μg/m3. The most appropriate LOAEC to compare with the 1-day average PM10 exposure is the short-term inhalation exposure to rats of 45,000 μg/m3 from Table S1 (end points included no mortalities or clinical findings other than discoloration of fur and red tears, and lung inflammation for calcined petcoke). The resulting MOE is ~800 (45,000 μg/m3 ÷ 54 μg/m3 ≈ 800). The most appropriate LOAEC to compare with the 5-yr PM10 exposure is the longer-term inhalation exposure to rats of 10,000 μg/m3, described earlier (end points included increased lung weights, accumulation of petcoke, and signs of lung inflammation). The resulting MOE is ~900 (10,000 μg/m3 ÷ 11 μg/m3 ≈ 900). Similar to the MOS analysis, these MOEs of ~800 or ~900 indicate little to no expected effects from exposure at this site, since MOEs greater than a value of about 100 (depending on data set and a number of chemical-specific parameters) mean that the existing exposures are lower than duration-specific safe concentrations.
A lifetime dermal carcinogenicity study conducted in male and female c3H/HeJ mice provides a LOAEC of 250,000 μg/mL (HPV, Citation2007). Similar to the previous MOE analysis, a dermal MOE was determined using the detection limits for V and Ni (2.5 μg/cm2, or 8 μg/mL). The dermal MOE is >30,000, indicating that dermal exposures are not expected to be with any adverse effect, including in sensitive subgroups.
Discussion
Our analysis of the available information indicates exposure to petcoke dust is not associated with systemic toxicity to humans at low exposure concentrations or experimental animals at higher concentrations. Petcoke dust was not found to cause cancer in humans; or mortality, developmental or reproductive toxicity, genotoxicity, mutagenicity, or cancer following repeated high-concentration exposures in laboratory animals. The only adverse effects in laboratory animals were pulmonary inflammation following exposure to high concentrations of petcoke dust via inhalation and skin irritation following dermal exposure. These findings are consistent with those of the American Conference of Governmental Industrial Hygienists (ACGIH, Citation2013), where petroleum coke meets the ACGIH guidelines for particles not otherwise specified. Specifically, petcoke is insoluble or poorly soluble and has “low toxicity” explicitly defined as a lack of chemical reaction with lung tissue and the absence of toxic effects other than inflammation of the lung, or “lung overload.” Thus, the toxicity of petcoke is more closely related to a nuisance dust, similar to other common dusts such as soil ordinarily found in one’s backyard, on a playground, or on a baseball field.
The lone, local community–based epidemiological study of potential risks related to these petcoke transfer facilities that we identified is consistent with the findings of our hazard characterization (ToxStrategies, Citation2015). In that study, asthma hospitalization and cancer rates were not different between community areas classified as “exposed” and “unexposed” to the facility. However, the report describes associations between exposure and outcomes and cannot be used alone to draw conclusions. Uncertainties of this analysis include the length of time it takes cancer to develop and be diagnosed. For example, cancer latency depends on type of cancer and ranges from 2 to more than 50 yr, and the petcoke storage facility has only been in the present locations for approximately 20 yr (Nadler and Zurbenko, Citation2014). Other uncertainties include the likely presence of the confounding effects of various exposures in this highly industrialized area, population exposures were not specifically monitored, and the residence time of the population was not measured and may likely be variable. These epidemiology findings could be strengthened with more detailed studies that involve estimates of personal exposure, prospective follow-up, or other enhancements to the study design to evaluate exposure-outcome relationships.
The nine FEM monitors operating since February 2014 at the KCBX Terminals provide a robust data set for evaluating on-site PM10 concentrations. These measurements capture impacts from on-site emission sources and the influence of background PM10 concentrations and off-site emission sources. Although located within the KCBX Terminals fence lines, the PM10 levels at the fence line are generally similar to concentrations reported from an ambient air quality monitor located 1 km (0.62 miles) to the southeast and operated by Cook County. Fence line, 24-hr PM10 levels were less than 50 µg/m3 on 89% of the days and below 100 µg/m3 on 99% of the days. In comparison, ambient air PM10 concentrations in the community abutting the facility were less than 50 µg/m3 on 94% of the days and less than 100 µg/m3 on 99% of the days over the 5-yr period 2009–2013. The highest PM10 concentrations at the ambient air monitoring site occurred on days with prevailing southerly and southwesterly winds, conditions during which the ambient air quality monitor is upwind of the facility. These fence line measurements are not expected to occur at the nearest residential locations due to the rapid decrease with distance over time. The ambient PM10 data generally corroborate the observations from our network of fence line monitors.
To augment the PM10 monitoring, AERMOD modeling was performed to determine the impact of KCBX emission sources on PM10 concentrations within and beyond the terminal fence lines. The modeling results indicate that peak PM10 concentrations at nearby residences are significantly lower than peak PM10 concentrations at the facility fence lines. In addition, the levels predicted with AERMOD are well below the NAAQS for PM10, which is defined as a 24-hr average concentration of PM10 not to be exceeded more than once per year on average over a 3-yr period. Although our findings indicate that potential airborne impacts of the facilities, if any, are negligible, supplemental monitoring in the surrounding community could be performed to investigate human exposures further and to provide additional verification of modeling results. Furthermore, future air monitoring work might involve the characterization of particle size distribution so that the proportion of the PM10 measurements due to PM2.5 or less can be determined. These, more fully characterized, distributions could then be more readily compared with the known particle size distributions from the experimental animal studies of petcoke.
Similar to the results of the fence line monitoring and air dispersion modeling, our assessment of off-site environmental media indicates that potential community exposures to petcoke are minimal. A recent risk characterization of a petcoke handling and calcining facility has reached similar conclusions to those presented in this study (Singh et al., Citation2015). We found that deposition and accumulation of petcoke in off-site locations in neighborhoods abutting the facility, if any, is insufficient to alter concentrations of trace elements and PAHs in the soil and on surfaces examined. As a result, levels of chemical indicators of petcoke, such as the V:Ni ratio and distributions of PAHs, in neighborhoods that abut the facility were no different from levels in soil elsewhere in Chicago. In addition, a spatial gradient of petcoke indicators in soil of the abutting neighborhood consistent with wind-borne transport was not identified. These same indicator chemicals were rarely present on the surfaces that we sampled and when present were well within levels of typical anthropogenic background. EPA R5 obtained additional surface wipe samples from buildings and parks near the facilities and also found no evidence of petcoke accumulation. As described earlier, the concentrations of S, V, and Ni reported in independent analyses of sidewalk dust performed by the City of Chicago are inconsistent with petcoke from the facilities and therefore generally consistent with our findings
Although our off-site assessment did not identify consistent patterns of petcoke accumulation in neighborhoods abutting the facilities, we did observe chemical profiles with some similarity to petcoke in a small number of samples. Those samples were primarily located along roadways that are frequently trafficked by heavy-duty vehicles or railways and therefore could reflect transportation-related sources of heavy metals and PAHs. In addition, the locations of these samples are not consistent with wind-borne transport of petcoke from the facilities. In addition, six samples (five abutting, one control) obtained from parks and not immediately adjacent to roads or railways contained a detectable level of 2-methylnaphthalene, a PAH commonly present in petcoke but rarely detected in background soil. Yet, the V:Ni ratios in those samples ranged from 1.0 to 1.6 and thus are typical of background soil, as indicated by levels measured in control areas in our samples and by the State of Illinois (see ). Another relevant consideration here is that the chemical indicators of petcoke that we evaluated are also present in other petroleum products such as motor oil, home heating oil, and diesel exhaust emissions (Agency for Toxic Substances and Disease Registry [ATSDR], Citation1995, Citation2005; Wang et al., Citation2003). As evidenced by our own data and the reference data that we considered, occasional occurrences of these chemical indicators is typical of soil in Chicago.
In summary, the available data indicate the amount of trace metal and PAH accumulations in nearby communities attributable to the facility are minimal in comparison with anthropogenic background levels. Contributions by the facility to community exposure appear to be well below levels that are typical of Chicago and other urban areas of the United States. When epidemiology and experimental animal information on petcoke is integrated with exposure assessment information for the KCBX site, initial risk characterization conclusions can be drawn as follows:
A MOS of inhalation exposure of 3 or 14 exist between the NAAQS PM10 level of 150 µg/m3 and either the worst 1-day average PM10 in 5 yr of 54 µg/m3 or the 5-yr PM10 average of 11 μg/m3 found in the East Side and South Deering neighborhoods respectively.
A MOE of inhalation exposure of ~800 or ~900 exist between the short-term LOAEC of 45,000 µg/m3 and the worst 1-day average of 54 µg/m3 or the longer-term LOAEC of 10,000 µg/m3 and the 5-yr PM10 average of 11 µg/m3, respectively.
A MOE analysis for dermal exposures is above a value of 30,000 using a rodent LOAEC of 250,000 μg/mL and the detection limits for V and Ni (2.5 μg/cm2, or 8 μg/mL).
If one uses the highest measured perimeter fence line value of 175 µg/m3, the acute 1-day MOE is ~260 (i.e., 45,000 µg/m3 ÷ 175 µg/m3 = 260). Although this MOE is lower than the one derived from an average exposure, the acute toxicity value used is based on a rodent study with exposures of 6 hr/day for 5 days and is not representative of the highest measure value. Moreover, this fence line measurement is not representative of a community value, although it might be compared with the occupational ACGIH guidance for use of particles not otherwise specified. Given the low toxicity of petcoke generally, the low measured and modeled particulate concentrations from the KCBX facility in particular, and the MOS/MOE values that indicate no expected toxicity, even in sensitive individuals, it is not expected that the human health of residents in these neighborhoods would be impacted by the KCBX facility. Additional information assisting in the interpretation of these findings would include particulate matter sources other than from the KCBX facility, sources of other chemical exposures from other facilities, and personal monitoring and health effects information from the communities living adjacent to this KCBX facility.
Supplementary Materials
Download Zip (746.8 KB)Funding
Funding for this research was provided by Koch Industries. Several of the authors (M. Dourson, D. MacIntosh, L. Chinkin) are retained experts for litigation purposes, and were retained prior to authoring this paper. Koch Industries was involved in the problem formulation phase of this research. However, the research hypotheses addressed, findings, and conclusions expressed in this paper are solely those of the authors and not necessarily those of Koch Industries. The authors accept responsibility for any errors or omissions.
Supplemental Material
Supplemental data for this article can be accessed on the publisher’s website.
Additional information
Funding
Notes on contributors
Michael L. Dourson
Michael L. Dourson is professor of environmental health at the College of Medicine, Department of Environmental Health, University of Cincinnati, Cincinnati, OH, and director of its Toxicology Excellence for Risk Assessment Center.
Lyle R. Chinkin
Lyle R. Chinkin is the president of Sonoma Technology, Inc., Petaluma, CA.
David L. MacIntosh
David L. Macintosh is chief science officer at Environmental Health & Engineering, Inc., Needham, MA.
Jennifer A. Finn
Jennifer A. Finn is a staff scientist at Environmental Health & Engineering, Inc., Needham, MA.
Kathleen W. Brown
Kathleen W. Brown is a senior scientist at Environmental Health & Engineering, Inc., Needham, MA.
Stephen B. Reid
Stephen B. Reid is a senior atmospheric scientist at Sonoma Technology, Inc., Petaluma, CA.
Jeanelle M. Martinez
Jeanelle M. Martinez is a Research Scientist at the Toxicology Excellence for Risk Assessment Center, Department of Environmental Health, College of Medicine, University of Cincinnati, Cincinnati, OH.
Related Research Data
References
- Agency for Toxic Substances and Disease Registry. 1995. Toxicological Profile for Polycyclic Aromatic Hydrocarbons. Atlanta, GA: U.S. Department of Health and Human Services, Public Health Service, Agency for Toxic Substances and Disease Registry.
- Agency for Toxic Substances and Disease Registry. 2005. Toxicological Profile for Naphthalene, 1-Methylnaphthalene, and 2-Methylnaphthalene. Atlanta, GA: U.S. Department of Health and Human Services, Public Health Service, Agency for Toxic Substances and Disease Registry.
- American Conference of Governmental Industrial Hygienists. 2013. TLVs and BEIs. Threshold Limit Values for Chemical Substances and Physical Agents. Cincinnati, OH: American Conference of Governmental Industrial Hygienists.
- American Fuel & Petrochemical Manufacturers. 2014. Petroleum coke fact sheet. http://kcbxchicago.com/wp-content/uploads/2013/12/Petroleum-Coke-Fact-Sheet.pdf (accessed May 2015).
- Andrews, A., and R.K. Lattanzio. 2013. Petroleum Coke: Industry and Environmental Issues, In: CRS Report Prepared for Members and Committees of Congress. Washington, DC: Congressional Research Service. www.crs.gov.
- ASTM D6966-13. Standard Practice for Collection of Settled Dust Samples Using Wipe Sampling Methods for Subsequent Determination of Metals. 2013. ASTM International: West Conshohocken, PA. www.astm.org
- ASTM D6661-10, Standard Practice for Field Collection of Organic Compounds from Surfaces Using Wipe Sampling. 2010. ASTM International: West Conshohocken, PA. www.astm.org
- Barnes, M.D., and M. Dourson. 1988. Reference dose (RfD): Description and use in health risk assessments. Regul. Toxicol. Pharmacol. 8:471–486. doi:10.1016/0273-2300(88)90047-5
- Boffetta, P., N. Jourenkova, and P. Gustavsson. 1997. Cancer risk from occupational and environmental exposure to polycyclic aromatic hydrocarbons. Cancer Causes Control 8:442–472. doi:10.1023/A:1018465507029
- Caruso J.A., K. Zhang, N.J. Schroeck, B. McCoy, and S.P. McElmurry. 2015. Petroleum coke in the urban environment: A review of potential health effects. Int. J. Environ. Res. Public Health 12:6218–6231. doi:10.3390/ijerph120606218
- Chau, N., J.P. Bertrand, J.M. Mur, A. Figueredo, A. Patris, J.J. Moulin, and Q.T. Pham. 1993. Mortality in retired coke oven plant workers. Br. J. Ind. Med. 50:127–135. doi:10.1136/oem.50.2.127
- Clougherty, J.E., E.A. Houseman, and J.I. Levy. 2011. Source apportionment of indoor residential fine particulate matter using land use regression and constrained factor analysis. Indoor Air 21:53–66. doi:10.1111/ina.2010.21.issue-1
- Environmental Systems Research Institute. 2012. ArcGIS Desktop: Release 10.1. Redlands, CA: Environmental Systems Research Institute.
- Graney, J.R., M.S. Landis, and G.A. Norris. 2004. Concentrations and solubility of metals from indoor and personal exposure PM2.5 samples. Atmos. Environ. 38:237–247. doi:10.1016/j.atmosenv.2003.09.052
- Habre, R., B.A. Coull, E. Moshier, J. Godbold, A. Grunin, A. Nath, W. Castro, N. Schachter, A. Rohr, M. Kattan, J.D. Spengler, and P. Koutrakis. 2014. Sources of indoor air pollution in New York City residences of asthmatic children. J. Expos. Sci. Environ. Epidemiol. 24:269–278. doi:10.1038/jes.2013.74
- High Production Volume Testing Group. 2007. Petroleum Coke Category Analysis and Hazard Characterization. Submitted to the U.S. Environmental Protection Agency by the American Petroleum Institute Petroleum HPV Testing Group.
- Huntingdon Life Sciences. 1999. Study No. 97-6119. Calcined Coke (F284) & Green Coke (F-285): Fibrogenic Screening Study in the Rat. Report submitted to ARCO (Atlantic Richfield Company), 20 October 1999. La Palma, CA: Huntingdon Life Sciences.
- Illinois Administration Code. 2013. Title 35, Subtitle G, Chapter I, SubChapter f, Part 742: Tiered Approach to Corrective Action Objectives, Appendix A, Tables G and H. Joint Committee on Administrative Rules.
- International Programme on Chemical Safety. 2004. Risk Assessment Terminology Part 1: IPCS/OECD Key Generic Terms used in Chemical Hazard/Risk Assessment. Geneva, Switzerland: International Programme on Chemical Safety, World Health Organization.
- Kinney, P.L., S.N. Chillrud, S. Ramstrom, J. Ross, and J.D. Spengler. 2002. Exposures to multiple air toxics in New York City. Environ. Health Perspect. 110:539–546. doi:10.1289/ehp.02110s4539
- Klonne, D.R., J.M. Burns, C.A. Halder, C.E. Holdsworth, and C.E. Ulrich. 1987. Two-year inhalation toxicity study of petroleum coke in rats and monkeys. Am. J. Ind. Med. 11:375–389. doi:10.1002/(ISSN)1097-0274
- Lewis, R.J., A.R. Schnatter, I. Drummond, N. Murray, F.S. Thompson, A.M. Katz, G. Jorgensen, M.J. Nicolich, D. Dahlman, and G. Theriault. 2003. Mortality and cancer morbidity in a cohort of Canadian petroleum workers. Occup. Environ. Med. 60:918–928. doi:10.1136/oem.60.12.918
- Marshall, S., C. Gennings, L.K. Teuschler, L.G. Stork, R. Tornero-Velez, K.M. Crofton, and G.E. Rice. 2013. An empirical approach to sufficient similarity: Combining exposure data and mixtures toxicology data. Risk Anal. 33:1582–1595. doi:10.1111/risa.2013.33.issue-9
- McKee, R.H., D. Herron, P. Beatty, P. Podhasky, G.M. Hoffman, J. Swigert, C. Lee, and D. Wong, D. 2013. Toxicological assessment of green petroleum coke. Int. J. Toxicol. 33: 156S–167S. doi:10.1177/1091581813504187
- Miller, B.G., E. Doust, J.W. Cherrie, and J.F. Hurley. 2013. Lung cancer mortality and exposure to polycyclic aromatic hydrocarbons in British coke oven workers. BMC Public Health 13:962. doi:10.1186/1471-2458-13-962.
- Nadler, D.L., and I.G. Zurbenko. 2014. Estimating cancer latency times using a Weibull model. Adv. Epidemiol. 2014:746769. doi:10.1155/2014/746769
- Polidori, A., K.L. Cheung, M. Arhami, R.J. Delfino, J.J. Schauer, and C. Sioutas. 2009. Relationships between size-fractionated indoor and outdoor trace elements at four retirement communities in southern California. Atmos. Chem. Phys. 9:4521–4536. doi:10.5194/acp-9-4521-2009
- R Core Team. 2012. A language and environment for statistical computing. R Foundation for Statistical Computing. http://www.R-project.org (accessed November 2013).
- Schnatter, A.R., M.J. Nicolich, R.J. Lewis, F.L. Thompson, H.K. Dineen, I. Drummond, D. Dahlman, A.M. Katz, and G. Theriault. 2012. Lung cancer incidence in Canadian petroleum workers. Occup. Environ. Med. 69:877–882. doi:10.1136/oemed-2011-100641
- Seed, J., R.P. Brown, S.S. Olin, and J.A. Foran. 1995. Chemical mixtures: Current risk assessment methodologies and future directions. Regul. Toxicol. Pharmacol. 22:76–94. doi:10.1006/rtph.1995.1071
- Singh, D., G.T. Johnson, and R.D. Harbison. 2015. Human health risk characterization of petroleum coke calcining facility emissions. Regul. Toxicol. Pharmacol. 73:706–711. doi:10.1016/j.yrtph.2015.10.025.
- Stork, L.G., C. Gennings, W.H. Carter, L.K. Teuschler, and E.W. Carney. 2008. Empirical evaluation of sufficient similarity in dose-response for environmental risk assessment of chemical mixtures. J. Agric. Biol. Environ. Sci. 13:313–333. doi:10.1198/108571108X336304
- Swaen, G.M., J.J. Slangen, A. Volovics, R.B. Hayes, T. Scheffers, and F. Sturmans. 1991. Mortality of coke plant workers in The Netherlands. Br. J. Ind. Med. 48:130–135. doi:10.1136/oem.48.2.130
- ToxStrategies. 2015. Assessment of asthma hospitalization, cancer incidence, and cancer mortality in areas near KCBX North and South. May 29, 2015. http://kcbxchicago.com/environmental-reporting/(accessed May 31, 2016).
- U.S. Environmental Protection Agency. 1986. Guidelines for the Health Risk Assessment of Chemical Mixtures. EPA/630/R-98/002. Washington, DC: U.S. Environmental Protection Agency, Risk Assessment Forum.
- U.S. Environmental Protection Agency. 2000. Supplementary Guidance for Conducting Health Risk Assessment of Chemical Mixtures. EPA/630/R-00/002. Washington, DC: U.S. Environmental Protection Agency, Risk Assessment Forum.
- U.S. Environmental Protection Agency. 2011. Screening-Level Hazard Characterization. Petroleum Coke Category. Hazard Characterization Document. Available from: http://www.petroleumhpv.org/~/media/PetroleumHPV/Documents/Category_Petroleum%20Coke_June_2011.pdf?la=en (accessed May 31, 2016).
- U.S. Environmental Protection Agency. 2013. AirData database. http://www3.epa.gov/airquality/airdata/( accessed November 2013).
- U.S. Geological Survey. 2003. Concentrations of Polynuclear Aromatic Hydrocarbons and Inorganic Constituents in Ambient Surface Soils, Chicago, Illinois: 2001–02. Water-Resources Investigations Report 03-4105. Urbana, IL: U.S. Geological Survey.
- Van Winkle, M.R., and P.A. Scheff. 2001. Volatile organic compounds, polycyclic aromatic hydrocarbons and elements in the air of ten urban homes. Indoor Air 11:49–64. doi:10.1034/j.1600-0668.2001.011001049.x
- Wang, Z., B.P. Hollebone, M. Fingas, B. Fieldhouse, L. Sigouin, M. Landriault, P. Smith, J. Noonan, and G. Thouin. 2003. Characteristics of Spilled Oils, Fuels, and Petroleum Products: 1. Composition and Properties of Selected Oils. EPA/600/R-03/072. Washington, DC: National Exposure Research Laboratory, Office of Research and Development, U.S. Environmental Protection Agency.
- Watson, J.G., and J.C. Chow. 2000. Reconciling Urban Fugitive Dust Emission Inventory and Ambient Source Contribution Estimates: Summary of Current Knowledge and Needed Research. DRI Document No. 6110.4F. Reno, NV: Desert Research Institution.
- Whiting, K. 2014. Memorandum to Chicago Department of Public Health, Subject: Electron Microscopy Study Technical Memorandum, CDM Smith. http://www.cityofchicago.org/content/dam/city/depts/cdph/environmental_health_and_food/App4CDMSmithTechMemoreElectronMicro. (accessed April 12, 2016).
- Wu, W. 1988. Occupational cancer epidemiology in the People’s Republic of China. J. Occup. Med. 30:968–974. doi:10.1097/00043764-198812000-00017
- Yankoleva, E., P.K. Hopke, and L. Wallace. 1999. Receptor modeling assessment of particle total exposure assessment methodology data. Environ. Sci. Technol. 33:3645–3652.