
ABSTRACT
The electric system is experiencing rapid growth in the adoption of a mix of distributed renewable and fossil fuel sources, along with increasing amounts of off-grid generation. New operational regimes may have unforeseen consequences for air quality. A three-dimensional microscale chemical transport model (CTM) driven by an urban wind model was used to assess gaseous air pollutant and particulate matter (PM) impacts within ~10 km of fossil-fueled distributed power generation (DG) facilities during the early afternoon of a typical summer day in Houston, TX. Three types of DG scenarios were considered in the presence of motor vehicle emissions and a realistic urban canopy: (1) a 25-MW natural gas turbine operating at steady state in either simple cycle or combined heating and power (CHP) mode; (2) a 25-MW simple cycle gas turbine undergoing a cold startup with either moderate or enhanced formaldehyde emissions; and (3) a data center generating 10 MW of emergency power with either diesel or natural gas-fired backup generators (BUGs) without pollution controls. Simulations of criteria pollutants (NO2, CO, O3, PM) and the toxic pollutant, formaldehyde (HCHO), were conducted assuming a 2-hr operational time period. In all cases, NOx titration dominated ozone production near the source. The turbine scenarios did not result in ambient concentration enhancements significantly exceeding 1 ppbv for gaseous pollutants or over 1 µg/m3 for PM after 2 hr of emission, assuming realistic plume rise. In the case of the datacenter with diesel BUGs, ambient NO2 concentrations were enhanced by 10–50 ppbv within 2 km downwind of the source, while maximum PM impacts in the immediate vicinity of the datacenter were less than 5 µg/m3.
Implications: Plausible scenarios of distributed fossil generation consistent with the electricity grid’s transformation to a more flexible and modernized system suggest that a substantial amount of deployment would be required to significantly affect air quality on a localized scale. In particular, natural gas turbines typically used in distributed generation may have minor effects. Large banks of diesel backup generators such as those used by data centers, on the other hand, may require pollution controls or conversion to natural gas-fired reciprocal internal combustion engines to decrease nitrogen dioxide pollution.
Introduction
The electricity system is experiencing rapid growth in the adoption of a mix of distributed renewable and fossil fuel sources. This will likely also include increasing amounts of off-grid generation, in addition to utility-operated distributed generation. New operational regimes may have unforeseen consequences for air quality. It is therefore important to conduct early-stage screening assessments of expected distributed generation (DG) deployment scenarios.
Distributed power generation is intended to produce tens of megawatts of electricity based on the small turbine, reciprocating internal combustion engine (RICE), or other small-scale energy technologies to meet peak load demand and supplement renewable resources. In addition to the increased use of DG to supplement more centralized electric generation utilities on a regular basis, there is also the potential concentration of backup generators (BUGs) to provide independent emergency power for vital activities, such as health care and, more recently, the continuous provision of services over the Internet through large data centers, which in 2011 consumed approximately 1.5% of all electricity worldwide (Liu et al., Citation2013).
Borbely and Kreider (Citation2001) provided an early overview of the technologies associated with distributed power generation, both traditional and emerging, with an emphasis on feasible near-term options. Allison and Lents (Citation2002) assessed the level of polluting emissions associated with a range of DG technologies and fuel types and concluded that when air pollution issues are considered, combined cycle power production, which routes the waste heat from a natural gas turbine to a steam turbine to generate extra power, was the most competitive approach.
A literature review of studies examining the air quality impacts of DG was recently conducted by the Electric Power Research Institute (EPRI, Citation2015a). Most of the existing studies have focused on California (e.g., Allison and Lents, Citation2002; Heath et al., Citation2006; Venkatram et al., Citation2010), and to a lesser extent the northeastern United States (e.g., Carreras-Sospedra et al., Citation2008). These impact assessments have ranged in scale from local to regional. Local impact studies have mostly used Gaussian dispersion models without chemistry to assess near-source exposure to particulate matter (PM) and the gaseous pollutant NO2 (e.g., Jing and Venkatram, Citation2011), although the recent study of the air quality impacts of diesel BUGs by Tong and Zhang (Citation2015) improved on this by employing a large eddy simulation (LES) model with limited NOx chemistry. Regional impact studies have employed three-dimensional (3D) Eulerian chemical transport models (CTMs) to assess issues related to ozone or PM attainment under the U.S. Clean Air Act (e.g., Vutukuru et al., Citation2011). The emphasis of these previous studies has mainly been on the so-called criteria pollutants, with little attention to hazardous air pollutants that are products of incomplete combustion, such as formaldehyde.
The goal of this paper is to assess the potential microscale air quality impacts of DG facilities on primary PM and on chemically reactive gases in the presence of mobile sources of pollution and a realistic urban canopy. Tong and Zhang (Citation2015) simulated impacts on a very fine scale in the immediate vicinity of buildings and less than 1 km downwind of an emission source, using explicit computational fluid dynamics. In contrast, our study deploys a more extensive photochemical reaction set over a wider horizontal domain (8 km × 8 km). To accomplish this, we use the HARC model, a high-resolution 3D Eulerian CTM with a customized chemical mechanism that has been thoroughly tested against data from field studies and regulatory monitoring stations (Olaguer, Citation2012a, Citation2012b, Citation2013; Olaguer et al., Citation2013) as the basic tool to assess near-source air quality impacts of criteria pollutants (NO2, CO, O3, PM), and the hazardous air pollutant formaldehyde (HCHO). The CTM is driven by winds from the Quick Urban Industrial Complex (QUIC) model (Singh et al., Citation2008) based on 3D Lidar data for urban morphology, so that our assessment can account for the impacts of realistic buildings on pollutant dispersion. Though our treatment of transport within the urban canopy does not have the same degree of detail as the study of Tong and Zhang (Citation2015), our approach is complementary to theirs in focusing on more reactive chemistry.
We have chosen a representative urban setting in the city of Houston for this assessment, with a mix of public facilities (e.g., hospitals and a major university), businesses, and residential areas surrounded by a network of freeways and other roads with frequent motor vehicle traffic.
Methodology
Emission scenarios
We consider three types of DG scenarios with a total of six cases: (1) a 25-MW natural gas turbine operating under steady state in either simple cycle (Case SSS) or combined heating and power (Case CHP) mode; (2) a 25-MW simple cycle gas turbine undergoing a cold start-up with either moderate (Case CSU) or enhanced (Case FSU) HCHO emissions; and (3) a data center generating 10 MW of emergency power with either diesel (Case DLB) or natural gas-fired (Case NGB) BUGs without pollution controls. The hypothetical emissions from each of the six cases are assumed to last for 2 hr, and to occur at the same location. They reflect expected strategies for peak load generation via a more flexible electrical grid.
The relevant emission scenarios are summarized in to 3. Note that in all DG cases, emissions of nitrous acid (HONO), an important radical and ozone precursor, are assumed to be 0.8% of NOx emissions (Kleffmann et al., Citation2003). DG emissions of the reactive species propylene, toluene, and xylenes were included due to their importance to near-source chemistry.
Table 1. Steady-state turbine emission scenarios.
The steady-state turbine scenarios assume emission factors appropriate to a GE LM6000 gas turbine (heat rate = 8.198 MMbtu/MWhr) with selective catalytic reduction (SCR) and oxidation catalysis controls, as reported by the Bay Area Air Quality Management District (BAAQMD) in the evaluation of a facility in Livermore, CA (BAAQMD, Citation2010). The combined cycle variant of this scenario assumes additional emissions from a duct burner (size = 106.4 MMbtu/hr) typical of combined heating and power (CHP) applications, as reported by the San Joaquin Valley Air Pollution Control District (SJVAPCD) in the review of a permit application for a CHP cogeneration system (SJVAPCD, Citation2013). In the case of formaldehyde, propylene, toluene, and xylenes, the ratios of duct burner emissions of these species to total duct burner emissions of volatile organic compounds (VOC) were assumed to be the same as for turbine emissions. Our adopted steady-state turbine emission factors are within the range of more comprehensive data surveyed by EPRI in a recent report (EPRI, Citation2015b).
Note that for all turbine scenarios, a 75/25 percentage split for NO/NO2 in NOx emissions was assumed based on an assessment of several data sources. These include NO2/NOx ratios recommended by the SJVAPCD, the U.S. Environmental Protection Agency (EPA) in-stack ratio database (http://www3.epa.gov/scram001/no2_isr_database.htm), facility permit documents, and limited preliminary test data collected by EPRI from one combined-cycle and several single-cycle gas-fired power plants (S. Shaw, personal communication).
For Case CSU, emission factors were also derived from BAAQMD (Citation2010), with the same ratios of HCHO, propylene, toluene, and xylenes to VOC as in Case SSS. Case FSU differs from Case CSU only in that the HCHO emission rate was set at a value compatible with the largest emission factor measured in tests of stationary gas-fired combustion turbines documented by the EPA in support of the National Emission Standards for Hazardous Air Pollutants (http://www3.epa.gov/airtoxics/turbine/turbinepg.html).
According to BAAQMD (Citation2010), a typical startup of the GE LM6000 lasts for 30 min, during most of which time the normal pollution controls are inoperative. However, it is known that turbine startup durations vary depending on the length of time between episodes of steady-state operation, with “cold” startups taking longer than “warm” or “hot” ones (Bivens, Citation2002). In our startup scenarios, we assume that cold conditions result in a 2-hr startup duration, with the same average emission rates as in a normal 30-min startup.
In the BUG scenarios, we assume that there are five 2-MW engines operating without controls to provide a total of 10 MW of emergency power. Diesel RICE emission factors were obtained from University of California at Riverside (Citation2005) in a report to the California Energy Commission. For species other than HCHO (for which emission test data are rare), these emission factors, including an explicit one for NO2, were appropriate to a 2.2-MW CAT 3516 engine, whereas the HCHO emission factor was appropriate to a 0.4-MW CAT 3406C engine. Gas-fired RICE emission factors for NOx and CO appropriate to a 3-MW CAT G3616 4-stroke lean-burn engine were obtained from the National Renewable Energy Laboratory (NREL, Citation2003), whereas the corresponding emission factors for HCHO and particulate matter (PM) were obtained from the EPA AP-42 database (see http://www3.epa.gov/ttnchie1/ap42/). Emissions of NO2 for gas-fired RICE were assumed to be 18% of corresponding NOx emissions based on an appropriate average of data from the EPA in-stack ratio database. RICE emissions of olefins and aromatics were ignored due to the lack of compatible data to enable a fair comparison between the two BUG cases.
For all DG scenarios, plume rise was explicitly taken into account. The Briggs (Citation1965) formulation was used to compute the effective release height of hot engine exhaust plumes at a downwind distance of 100 m from the source (half the model horizontal grid resolution) using stack parameters as specified by BAAQMD (Citation2010) in the case of the turbine scenarios, and by Tong and Zhang (Citation2015) in the case of the BUG scenarios. Adopted stack parameter values are displayed in . A background wind speed of 3 m/sec was assumed in all cases. Application of the plume rise parameterization resulted in effective release heights above ground level (AGL) of 136 m for the gas turbine and 29 m for BUG scenarios. Building downwash effects are partly accounted for by the QUIC model-generated wind field, although the effects of tilted plume geometry downwind of the source are ignored.
Table 2. Turbine startup emission scenarios.
Table 3. BUG emission scenarios.
Table 4. Stack parameters for emission scenarios.
Mobile sources
In urban areas, point source emissions do not exist in isolation, as they are accompanied, and in many cases dominated, by emissions from mobile as well as area sources. Secondary pollutants such as ozone are sensitive to the mix of chemically reactive gases coming from all sources, as are the atmospheric lifetimes, and thus the dispersion, of the primary pollutants emitted by DG facilities.
In regional air quality modeling for U.S. regulatory applications, mobile emissions are usually estimated by running a travel demand model together with the Motor Vehicle Emission Simulator (MOVES) model (EPA, Citation2014). Rather than run the MOVES model ourselves, we requested appropriate MOVES data files from the Texas Commission on Environmental Quality (TCEQ), which is responsible for conducting regional air quality modeling in support of ozone attainment demonstrations for the state of Texas.
The TCEQ provided link-based motor vehicle activity files and vehicle fleet emission factors for various roadway types in Harris County, Texas, for a 2018 summer weekday scenario generated by the Texas Transportation Institute (TTI). We used this information to construct approximate link-based hourly emissions of NOx and CO for the area of interest. We then used observed near-road or large-scale urban ratios of HONO to NOx and various VOCs to CO to obtain other species emissions required by the HARC model, as listed in . While the resulting mobile source emissions are not identical to those used in the TCEQ State Implementation Plan (SIP) for ozone attainment, which were intended for coarse grid air quality model simulations, they are representative of these emissions for our purpose.
Table 5. Mobile source speciation factors.
Note that we do not include PM emissions in our mobile source inventory. We treat PM as a passive tracer in our near-source impact assessment, as did Tong and Zhang (Citation2015); hence there is no chemical interaction between mobile and DG point sources of PM. The simulated PM impacts are therefore due to the DG sources alone, and are limited to primary PM impacts.
Model setup
The HARC CTM was configured to run over a horizontal domain of 8 km × 8 km with a horizontal resolution of 200 m × 200 m. The vertical domain extends to 1 km AGL, with 20 layers, a vertical resolution that increases towards the surface, and a minimum thickness of 2 m near the ground. The hypothetical time period covered by the simulation is August 1, 12:00 pm – 2:00 pm LST, with a time resolution of 20 s.
The HARC chemical mechanism has 47 gas phase reactions, with a special emphasis on those governing highly reactive VOCs, mainly olefins. Also explicitly treated are formaldehyde, the aromatics, toluene and xylenes, and the biogenic compound isoprene. Chemical species not explicitly included in the mechanism are less reactive compounds such as alkanes. The impact of unresolved VOCs is nonetheless accounted for through the surrogate species, BVOC, and an associated background OH reactivity of 4 s−1. This mimics the effect of unresolved VOCs on the radical budget and NOx inter-conversions, and through these on ozone.
As mentioned previously, PM is treated as a passive tracer, so that there is no secondary inorganic or organic aerosol formation in the HARC model. PM size distributions and gravitational settling are ignored. The PM dry deposition velocity is set at 0.001 cm/sec, based on data from Lin et al. (Citation1994) for low wind speeds and particle sizes less than 1 µm.
lists the chemical species that are subject to transport in the HARC model, along with the assumed inflow boundary conditions for these species. Chemical boundary conditions are specified from typical ambient concentrations measured at the University of Houston during the 2006 TexAQS II Radical and Aerosol Measurement Project (TRAMP; Chen et al., Citation2010).
Table 6. Transported species in the HARC model.
The background horizontal wind (3 m/sec, 100°) roughly corresponds to days when the wind curves around from the Houston Ship Channel. The assumed relative humidity and surface temperature are 45% and 307 K (= 92.9°F) respectively. Vertical extrapolation of the background wind is based on a logarithmic wind profile with a roughness length of 0.1 m and a Monin–Obukhov length of –100 m. The surface temperature is vertically extrapolated assuming an unstable lapse rate of 12 K/km. The planetary boundary-layer height, on which the vertical diffusivity profile depends, is set at 1 km.
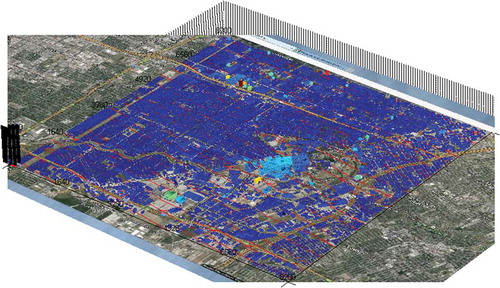
Horizontal extrapolation of the background wind is performed with the QUIC model based on Lidar data for Houston urban morphology obtained from the National Geospatial-Intelligence Agency. The QUIC model grid has a much finer horizontal resolution (10 m × 10 m) than the CTM grid to better account for urban morphology impacts on wind flow. It also has a slightly larger horizontal domain size (8.2 km × 8.2 km) and doubled vertical resolution compared to the CTM grid to enable mass-consistent wind fields to be derived for use in the CTM based on an Arakawa C-grid. displays wind streamlines in the presence of the urban canopy for the model simulations presented here.
Figure 1. Wind streamlines (red arrows) indicating flow around buildings in the model domain. The urban canopy is represented mostly by blue colors indicating lower building height, while other colors indicate taller structures. The leftmost grid axis points north. Both grid axes are labeled with distances from the origin (SW corner) in meters.
Results and discussion
In considering the results of the various emission scenarios, we treat the gaseous species separately from PM. The ambient concentrations of NO2, O3, HCHO, and CO near the surface at the end of the 2-hr simulation period resulting from mobile sources only, referred to as Case MOB, are displayed in . This represents a typical urban emission source pattern. The differences in surface concentrations of gaseous species between the turbine or BUG scenarios and Case MOB are displayed in to 8. Note that for the BUG scenarios, we have compressed the grid area to within ~2 km downwind of the source in displaying the appropriate mixing ratio contours. In all cases, there are insufficient radical sources to overcome NOx titration of ozone near the source, so that ozone is always depressed by DG emissions within the model domain. This is true even when the formaldehyde emission factor is enhanced under startup conditions.
Figure 2. Gaseous air pollutant impacts associated with Case MOB.
Figure 3. Gaseous air pollutant impacts associated with Case SSS.
For gases other than ozone, almost none of the turbine scenarios result in ambient concentration enhancements greater than 1 ppbv. Enhancements above 1 ppbv occur only in the startup cases, in particular for HCHO in Case FSU within ~1 km of the source, and for CO, for which the near-source enhancements are always less than 10 ppbv. Note that the TCEQ 24-hr HCHO Effects Screening Levels for cancer and noncancer endpoints are 4.5 ppbv and 2.7 ppbv, respectively (http://www.tceq.state.tx.us/toxicology/esl/list_main.html), and that the 8-hr U.S. National Ambient Air Quality Standard (NAAQS) for CO is 9 ppmv. From this we conclude that gas turbines used in DG applications are unlikely to create substantial adverse air quality impacts even very near the source, and even when uncontrolled (as in the startup cases).
More significant air quality impacts occur in the datacenter BUG scenarios, for which the effective plume release height is much lower than in the turbine cases. For diesel BUGs, ambient NO2 concentrations are enhanced by 10–50 ppbv within 2 km downwind of the source, while the enhancements of NO2 by gas-fired BUGs are about a factor of 5 less. For comparison, the 1-hr NAAQS for NO2 is 100 ppbv. HCHO concentration enhancements in the data-center scenario with natural gas-fired BUGs did not exceed 1 ppbv except in the immediate vicinity (within ~100 m) of the source.
displays the PM impacts for cases SSS, CSU, DLB, and NBG. Cases CHP and FSU are not included in the comparison because their PM emission rates are either similar or identical to that of Case CSU. Except for Case DLB, the associated PM impacts are less than 1 µg/m3, compared to a 24-hr average NAAQS of 35 µg/m3 and an annual mean NAAQS of 12 µg/m3 for particulates with a diameter less than 2.5 µm (PM2.5). For diesel BUGs, maximum PM impacts are between 1 and 5 µg/m3 within a few hundred meters of the source.
Figure 4. Gaseous air pollutant impacts associated with Case CHP.
Figure 5. Gaseous air pollutant impacts associated with Case CSU.
Figure 6. Gaseous air pollutant impacts associated with Case FSU.
Figure 7. Gaseous air pollutant impacts associated with Case DLB. Note compressed grid area.
Figure 8. Gaseous air pollutant impacts associated with Case NGB. Note compressed grid area.
Figure 9. Surface PM impacts associated with Cases SSS, CSU, DLB, and NGB. Note compressed grid area in bottom figures.
Conclusion
Our assessment of DG impacts on local air quality is the first to consider realistic emission scenarios amid a 3D urban canopy, including both point and mobile sources and reactive VOCs such as formaldehyde, propylene, toluene, and xylenes. The only scenario that generated impacts of potential concern was a data center operating a bank of diesel generators for emergency power. Sporadic operation of these generators without controls may enhance ambient NO2 within 2 km downwind by 10–50 ppbv over mobile source-generated concentrations. From this point of view, gas-fired generators may be preferable to diesel. Gas-fired generators would also reduce PM impacts relative to diesel BUGs.
Natural-gas-fired turbines do not appear to have any significant near-source air quality impacts even under uncontrolled startup conditions, although it is possible that their longer range impacts on ozone may need further examination, especially if their formaldehyde emissions are enhanced. The multiple occurrences of DG facilities in an urban setting may also increase their impacts beyond the results of this assessment. Note that the lesser near-source impacts of gas turbines compared to those of emergency generators are partly attributable to the greater release heights of gas turbine emissions.
Our straightforward screening analysis considers only a limited number of power generation and meteorological scenarios to assess whether potential air quality impacts could be significant. The selected wind direction was intended to maximize the simulated ambient exposure to pollution in residential areas due to both the hypothetical DG facility and nearby major roads. While additional scenarios could provide a more complete picture, more stagnant winds may not automatically imply less plume dilution, as the plume rise in the immediate vicinity of the source is inversely proportional to wind speed. Nevertheless, it is conceivable that there are situations in which ambient concentrations may be enhanced relative to our assessment. For example, the compression of the atmospheric boundary layer at night may lead to greater near-source concentrations of toxic formaldehyde, even though ozone chemistry and associated secondary formaldehyde production would be largely suppressed by the absence of photolysis.
The results of our study can inform both energy and environmental policy. The new tools we have brought to bear especially help to address the complexity of air quality decision making related to power generation. This complexity will be compounded by the electricity system’s shift to a more flexible and distributed network with entirely new operational regimes, including much more frequent startup and shutdown of facilities as they adjust to a wider mix of fuels and technologies.
Funding
This paper was the result of a project by the Houston Advanced Research Center (HARC) funded by the Electric Power Research Institute (EPRI).
Additional information
Funding
Notes on contributors
Eduardo P. Olaguer
Eduardo P. Olaguer is the Program Director for Air Quality Science at HARC.
Eladio Knipping
Eladio Knipping is a Senior Technical Manager at EPRI.
Stephanie Shaw
Stephanie Shaw is a Senior Technical Leader at EPRI.
Satish Ravindran
Satish Ravindran is a Senior Research Associate at HARC.
References
- Allison, J.E., and J. Lents. 2002. Encouraging distributed generation of power that improves air quality: Can we have our cake and eat it too? Energy Policy 30:737–52. doi:10.1016/S0301-4215(01)00135-5
- Bay Area Air Quality Management District. 2010. Final Determination of Compliance: Mariposa Energy Project. Application 20737, San Francisco, CA.
- Bivens, R.J. 2002. Startup and shutdown NOx emissions from combined-cycle combustion turbine units. Presented at the EPRI CEM User Group Meeting, May 24, Chicago, IL.
- Borbely, A.-M., and J.F. Kreider. 2001. Distributed Generation: The Power Paradigm for the New Millennium. Boca Raton, FL: CRC Press. doi:10.1080/00022470.1965.10468404
- Briggs, G.A. 1965. A plume rise model compared with observations. J. Air Pollut. Control Assoc. 15:433–38. doi:10.1080/00022470.1965.10468404
- Carreras-Sospedra, M., D. Dabdub, J. Brouwer, E. Knipping, N. Kumar, K. Darrow, A. Hampson, and B. Hedman. 2008. Air quality impacts of distributed energy resources implemented in the northeastern United States. J. Air and Waste Management Assoc. 58:902–12. doi:10.3155/1047-3289.58.7.902
- Chen, S., X. Ren, J. Mao, Z. Chen, W.H. Brune, B. Lefer, B. Rappenglück, J. Flynn, J. Olson, and J. H. Crawford. 2010. A comparison of chemical mechanisms based on TRAMP-2006 field data. Atmos. Environ. 44:4116–25. doi:10.1016/j.atmosenv.2009.05.027
- Electric Power Research Institute. 2015a. Program on Technology Innovation: Literature Review of the Potential Air Quality Impacts of Fossil-Based Distributed Generation. Final Report 3002005008, Palo Alto, CA.
- Electric Power Research Institute. 2015b. Program on Technology Innovation: The Evolving Emissions Profile of Distributed Energy Resources Technology. Final Report 3002004874, Palo Alto, CA.
- Heath, G.A., P.W. Granvold, A.S. Hoats, and W.W. Nazaroff. 2006. Intake fraction assessment of the air pollutant exposure implications of a shift toward distributed electricity generation. Atmos. Environ. 40: 7164–7177. doi:10.1016/j.atmosenv.2006.06.023
- Jing, Q., and A. Venkatram. 2011. The relative impacts of distributed and centralized generation of electricity on local air quality in the South Coast Air Basin of California. Energy Policy 39:4999–5007. doi:10.1016/j.enpol.2011.05.056
- Karl, T., E. Apel, A. Hodzic, D.D. Riemer, D.R. Blake, and C. Wiedinmyer. 2009. Emissions of volatile organic compounds inferred from airborne flux measurements over a megacity. Atmos. Chem. Phys. 9:271–85. doi:10.5194/acp-9-271-2009
- Kleffmann, J., R. Kurtenbach, J.C. Lörzer, P. Wiesen, N. Kalthoff, N. Vogel, and B. Vogel. 2003. Measured and simulated vertical profiles of nitrous acid. Part I: field measurements. Atmos. Environ. 37:2949–55. doi:10.1016/S1352-2310(03)00242-5
- Lin, J.J., K.E. Noll, and T.M. Holsen. 1994. Dry deposition velocities as a function of particle size in the ambient atmosphere. Aerosol Sci. Technol. 20:239–52. doi:10.1080/02786829408959680
- Liu, Z., A. Wierman, Y. Chen, B. Razon, and N. Chen. 2013. Data center demand response: Avoiding the coincident peak via workload shifting and local generation. Performance Evaluation 70:770–91. doi:10.1016/j.peva.2013.08.014
- National Renewable Energy Laboratory. 2003. Gas-Fired Distributed Energy Resource Technology Characterization. NREL/TP-620-34783, Golden, CO.
- Olaguer, E.P. 2012a. The potential near source ozone impacts of upstream oil and gas industry emissions. J. Air Waste Manage. Assoc. 62:966–77. doi:10.1080/10962247.2012.688923
- Olaguer, E.P. 2012b. Near source air quality impacts of large olefin flares. J. Air Waste Manage. Assoc. 62:978–88. doi:10.1080/10962247.2012.693054
- Olaguer, E.P. 2013. Application of an adjoint neighborhood-scale chemistry transport model to the attribution of primary formaldehyde at Lynchburg Ferry during TexAQS II. J. Geophys. Res. Atmos. 118:4936–46. doi:10.1002/jgrd.50406
- Olaguer, E.P., S.C. Herndon, B. Buzcu Guven, C.E. Kolb, M.J. Brown, and A.E. Cuclis. 2013. Attribution of primary formaldehyde and sulfur dioxide at Texas City during SHARP/formaldehyde and olefins from large industrial releases (FLAIR) using an adjoint chemistry transport model. J. Geophys. Res. Atmos. 118:11317–26. doi:10.1002/jgrd.50794
- Rappenglück, B., G. Lubertino, S. Alvarez, J. Golovko, B. Czader, and L. Ackermann. 2013. Radical precursors and related species from traffic as observed and modeled at an urban highway junction. J. Air Waste Manage. Assoc. 63:1270–86. doi:10.1080/10962247.2013.822438
- San Joaquin Valley Air Pollution Control District. 2013. Authority to Construct Application Review: Cogeneration System Consisting of One Natural Gas-Fired Turbine and Duct Burner. July 26, Fresno, CA.
- Singh, B., B.S. Hansen, M.J. Brown, and E.R. Pardyjak. 2008. Evaluation of the QUIC-URB fast response urban wind model for a cubical building array and wide building street canyon. Environ. Fluid Mech. 8:281–312. doi:10.1007/s10652-008-9084-5
- Tong, Z., and K.M. Zhang. 2015. The near-source impacts of diesel backup generators in urban environments. Atmos. Environ. 109:262–71. doi:10.1016/j.atmosenv.2015.03.020
- United States Environmental Protection Protection Agency (EPA). 2014. MOVES 2014a User Guide. EPA-420-B-15-095, Office of Transportation and Air Quality: Washington, DC.
- University of California at Riverside. 2005. Air Quality Implications of Backup Generators in California; Volume Two: Emission Measurements from Controlled and Uncontrolled Backup Generators. California Energy Commission, Public Interest Energy Research (PIER) Program, CEC 500-2005-049. Riverside, CA.
- Venkatram, A., S. Lee, Q. Jing, and W. Qian. 2010. Evaluation of the Near Source Air Quality Impact of Distributed Generation. California Energy Commission, PIER Energy-Related Environmental Research Program, MAQ-07-03: Sacramento, CA.
- Vutukuru, S., M. Carreras-Sospedra, J. Brouwer, and D. Dabdub. 2011. Future impacts of distributed power generation on ambient ozone and particulate matter concentrations in the San Joaquin Valley of California. J. Air Waste Manage. Assoc. 61:1319–33. doi:10.1080/10473289.2011.603990
- Warneke, C., S.A. McKeen, J.A. de Gouw, P.D. Goldan, W.C. Kuster, J.S. Holloway, E.J. Williams, B.M. Lerner, D.D. Parrish, M. Trainer, F.C. Fehsenfeld, S. Kato, E.L. Atlas, A. Baker, and D.R. Blake. 2007. Determination of urban volatile organic compound emission ratoips and comparison with an emissions database. J. Geophys. Res. 112:D10S47. doi:10.1029/2006JD007930