
ABSTRACT
Airborne particulate matter (PM) is derived from diverse sources—natural and anthropogenic. Climate change processes and remote sensing measurements are affected by the PM properties, which are often lumped into homogeneous size fractions that show spatiotemporal variation. Since different sources are attributed to different geographic locations and show specific spatial and temporal PM patterns, we explored the spatiotemporal characteristics of the PM2.5/PM10 ratio in different areas. Furthermore, we examined the statistical relationships between AERONET aerosol optical depth (AOD) products, satellite-based AOD, and the PM ratio, as well as the specific PM size fractions. PM data from the northeastern United States, from San Joaquin Valley, CA, and from Italy, Israel, and France were analyzed, as well as the spatial and temporal co-measured AOD products obtained from the MultiAngle Implementation of Atmospheric Correction (MAIAC) algorithm. Our results suggest that when both the AERONET AOD and the AERONET fine-mode AOD are available, the AERONET AOD ratio can be a fair proxy for the ground PM ratio. Therefore, we recommend incorporating the fine-mode AERONET AOD in the calibration of MAIAC. Along with a relatively large variation in the observed PM ratio (especially in the northeastern United States), this shows the need to revisit MAIAC assumptions on aerosol microphysical properties, and perhaps their seasonal variability, which are used to generate the look-up tables and conduct aerosol retrievals. Our results call for further scrutiny of satellite-borne AOD, in particular its errors, limitations, and relation to the vertical aerosol profile and the particle size, shape, and composition distribution. This work is one step of the required analyses to gain better understanding of what the satellite-based AOD represents.
Implications: The analysis results recommend incorporating the fine-mode AERONET AOD in MAIAC calibration. Specifically, they indicate the need to revisit MAIAC regional aerosol microphysical model assumptions used to generate look-up tables (LUTs) and conduct retrievals. Furthermore, relatively large variations in measured PM ratio shows that adding seasonality in aerosol microphysics used in LUTs, which is currently static, could also help improve accuracy of MAIAC retrievals. These results call for further scrutiny of satellite-borne AOD for better understanding of its limitations and relation to the vertical aerosol profile and particle size, shape, and composition.
Introduction
Airborne particulate matter (PM) is derived from diverse sources—natural and anthropogenic. In many urban environments, particles are emitted mainly from combustion processes (e.g., stationary sources such as power plants and mobile sources such as vehicles). In other areas, crustal material and natural sources (e.g., sea spray) contribute significant amounts of suspended matter, normally in the coarser size fraction (Deshmukh et al., Citation2012; Laden et al., Citation2000). PM is usually characterized by its physical and chemical properties, which are affected by its diverse sources and by the aging processes it has experienced. Hence, the PM optical properties (i.e., reflectance, absorbance, and scattering) also vary across particle size and show spatiotemporal variation (Pelletier et al., Citation2007).
PM mass concentrations are measured at ground monitoring stations that monitor fine particles (PM2.5, particles with an aerodynamic diameter <2.5 µm) and/or coarse particles (PM10, particles with an aerodynamic diameter <10 µm). Moreover, associations between ground PM observations and satellite-based aerosol optical depth (AOD) retrievals have been studied extensively in many geographical regions worldwide, using different statistical models for estimating the PM2.5 or PM10 concentrations based on AOD retrievals (e.g., Sorek-Hamer et al. Citation2015; Song et al. Citation2014; Kloog et al. Citation2014; Chudnovsky et al. Citation2014; Strawa et al. Citation2013; Nordio et al. Citation2013; Wu et al. Citation2012; Guo et al. Citation2009; Gupta and Christopher Citation2008; Engel-Cox et al. Citation2004; Wang and Christopher Citation2003). Satellite aerosol products have also been studied for differentiating between PM size fractions and aerosol types, mainly using the Ångström exponent (AE) that qualitatively represents the spectral dependence of AOD. In some areas the AE has been found to be inversely related to the average size of the aerosol particles—that is, the smaller the particles, the larger is the AE (Dubovik et al., Citation2002; Kaskaoutis et al., Citation2006). Although different AOD-based methods for characterizing PM types (e.g., mineral/dust, secondary aerosols, black carbon, etc.) were proposed (Liu et al., Citation2007a, Citation2007b; Russell et al., Citation2010), it is recognized that the current operational algorithms have limited ability to reliably derive the aerosol size fraction (over land) based on current scanning radiometers such as the Moderate Resolution Imaging Spectroradiometer (MODIS). Hence, MODIS Dark Target Collection 06 algorithm stopped reporting the AE (Levy et al. Citation2013). Similarly, the current version of the MultiAngle Implementation of Atmospheric Correction (MAIAC) algorithm provides high-resolution AOD but does not report the AE. To our best understanding, there is still a large ambiguity regarding the extent to which specific parameters (e.g., the vertical profile of the aerosol concentration, particle size distribution, aerosol composition, particle shape, etc.) affect AOD retrievals, which leaves a clear need to further analyze the PM–AOD relationships.
The common notion is that anthropogenic particulate emissions mostly fall under the PM2.5 category, whereas natural emissions are mostly of coarser particle size, PM10-2.5 (Kaufman et al., Citation2002; Deshmukh et al., Citation2012; European Environment Agency [EEA], Citation2012). Hence, the ratio of the observed PM mass fractions at the ground has been suggested for studying the relative strength of the two major sources of PM concentrations: natural and anthropogenic emissions (Gomišček et al., Citation2004; Sharma and Maloo, Citation2005; Zhou, Citation2015). Previously reported average PM2.5-to-PM10 ratios in Europe, the United States, and Beijing had ranges of 0.52–0.75, 0.50–0.75, and 0.53–0.86, respectively (Eldred et al., Citation1997; Gomišček et al., Citation2004; Zhou, Citation2015), suggesting that on average the fine fraction dominates the measured PM, probably due to considerable urban pollution in these areas. Moreover, in spite of large spatial disparity in land use and land cover, only small differences in the ratios of the PM size fractions are evident among these areas.
In this study, we further examine the spatiotemporal patterns of ground monitoring PM records (concentrations and mass fraction ratio) from different geographic locations. In addition, we study the statistical relationships of these parameters with sunphotometer-derived AOD and with satellite-based AOD. Although the particle number size concentration has a clear theoretical basis for its relationship with the retrieved AOD (Dubovik and King, Citation2000), the sensitivity of AOD to the distinct PM mass fractions is not clear. To provide a wide perspective to our results and be able to generalize them, we examined the relationships between different aerosol size fractions and various AOD products for three continents, North America, Europe, and Asia, in areas that are characterized by distinct climate and land cover. The multilocation study strengthens our results also due to the spatially limited AERONET data availability.
Data
Study area
Data from four different countries, Israel, Italy, France, and the United States, were used (), with each country having typical characteristics:
Israel is located in the East Mediterranean, near the North Africa and Saudi Arabia deserts, and is therefore routinely affected by desert dust.
Italy is located in southern Europe and due to its geography is affected by the Mediterranean in the south (e.g., sea spray) and by the high mountainous Alp ridge in the north. It is also affected by dust intrusions from North Africa.
France is further north than Italy, with its northern regions experiencing temperate climate and its southern regions experiencing Mediterranean climate (except for the Alpine and the Pyrenees regions). Except for the mountainous areas it is mostly planar, with most of the coastline facing the Atlantic Ocean, which is stormier and colder than the Mediterranean Sea.
The northeastern United States (NE-USA) refers to the states of Maine, Massachusetts, New Hampshire, New Jersey, New York, and Vermont, with an eastern coastline facing the North Atlantic Ocean. Major urban areas included in this region are Boston and New York, although most of the population resides in the more rural areas (Kloog et al., Citation2014b). The coastal plain areas are generally low and flat and the highlands, which represent the majority of the area, are generally heavily forested.
The San Joaquin Valley (SJV), CA, is an agricultural area characterized by poor air quality (Rosen et al., Citation2006; Sorek-Hamer et al., Citation2013), located southeast of San Francisco between the Coastal Mountain Range to the west and the Sierra Nevada Range to the east (Strawa et al., Citation2013), and experiences a semi-Mediterranean climate.
Table 1. Number of available simultaneous observations of PM concentrations in both fractions.
Ground PM observations
In all the study areas, daily ground PM concentrations have been obtained for three consecutive years (2009–2011) from stations that simultaneously monitor both PM2.5 and PM10 concentrations. summarizes the data availability. Data from Israel were obtained from the Technion Center of Excellence in Exposure Science and Environmental Health (TCEEH) air pollution monitoring database (TAPMD). Monitoring in Israel is conducted by different local Municipalities Associations for the Environment (MAE), and regulated by the Ministry of Environmental Protection (MoEP). The measurements are performed using tapered element oscillating microbalance (TEOM) continuous monitoring instruments, which are operated and maintained according to U.S. EPA guidelines and have a typical accuracy of ±5%. In France, PM data were obtained from the French National center for Industrial Safety and Environmental Protection (INERIS). PM mass concentrations were measured by TEOM, filter dynamics measurement system (FDMS), or beta gauge devices, with uncertainty of ±10%. In Italy, PM data were obtained from the Italian National Institute for Environmental Protection and Research (ISPRA). The quality of the monitoring instruments is equivalent to the gravimetric technique, and they are authorized for ambient monitoring by the framework of the European Community (EC) Directive on ambient air quality and cleaner air for Europe (2008/50/EC). Data for the U.S. PM monitoring stations was obtained from the EPA website (http://www3.epa.gov/airquality/airdata/ad_data_daily.html). PM monitoring in the United States is done by the gravimetric FRM method. The PM was monitored every 3 or 6 days according to the EPA guidelines, with quality performance requirement of ±10% total bias (https://www.law.cornell.edu/cfr/text/40/part-58/appendix-A).
Sunphotometer data
Daily average aerosol optical depth (AOD) at 470 nm, 500 nm, and 870 nm (Level 2 AOD) were obtained from the Aerosol Robotic Network (AERONET, Holben et al., Citation2001) (http://aeronet.gsfc.nasa.gov/cgi-bin/combined_data_access_new) with a calibration uncertainty of 1% (Sinyuk et al., Citation2012). The fine-mode AERONET AOD at 500 nm was also extracted based on the spectral curvature algorithm (SDA; O’Neill Citation2003). Only AERONET stations located less than 20 km from a ground PM station whose data were available for us were included in this study. The number of relevant AERONET stations used in France, Israel, Italy, SJV, and NE-USA was 6, 1, 4, 7, and 3, respectively ().
Table 2. Correlations between AERONET AOD, MAIAC AOD, PM2.5, and the PM ratio (2009–2011) (DS1).
Satellite observations
The Aerosol Optical Depth (AOD) at 470 nm was retrieved using the MAIAC algorithm that operates on MODIS L1B data. MAIAC provides daily AOD for cloud-free grid cells and has a spatial resolution of 1 km (Lyapustin et al., 2011a, 2011b). Daily MAIAC-AQUA AOD (overpass local time ~13:30) in grid cells at which PM monitoring stations that measure both PM fractions are located were used. Furthermore, Dark Target and Deep Blue AOD retrievals from MODIS-AQUA L2 at 10 km grid resolution were also obtained (for further details on MODIS products see Sayer et al., Citation2014; Levy et al., Citation2013).
Methods
PM ratio
The PM ratio was calculated as the ratio between the daily averaged fine (PM2.5) and inhalable (PM10) ground PM mass fractions, measured at the same site. Thus, it is defined as
Equation 1 shows that the PM10 is composed of coarse particles with an aerodynamic diameter between 2.5 μm and 10 μm (PM2.5-10) and from fine particles with an aerodynamic diameter below 2.5 μm (PM2.5). Hence, a PM ratio <0.5 represents conditions (location and time) where the observed PM levels are dominated by coarse particles (with aerodynamic diameter between 2.5 μm and 10 μm), while PM ratios >0.5 characterize cases with a dominant fine particle fraction (with aerodynamic diameters <2.5 μm). It is noteworthy that the PM ratio is not sensitive to the total PM10 concentration, since it is a relative measure. Descriptive statistics of the PM fractions and the PM ratio and their monthly trends and spatial patterns in the different study areas are presented as a preliminary analysis step.
Associations between AOD and the PM ratio
The associations between AOD products, PM mass concentrations and PM ratio were examined in two main stages:
Overall, we had 1,355 observations that contained all the studied parameters: AERONET AOD, 440–870 nm, AE, fine-mode AOD; MAIAC, AOD; and ground monitoring, PM2.5, PM10. This database is designated hereinafter DS1. Based on this data set, we define the PM ratio and the AERONET AOD ratio, with the latter being the ratio of the AERONET fine mode AOD to the total AERONET AOD (eq 2):
where(2)
A second database (DS2), which contained only MAIAC AOD, PM concentrations, and the PM ratio, was built. This dataset included 51,781 complete observations that contained all these parameters. MAIAC AOD was obtained for collocated grid cells where the PM stations are located, and correlations between the AOD, month, geographic location of the monitoring station, PM concentrations, and the PM size fraction ratio were examined.
Results
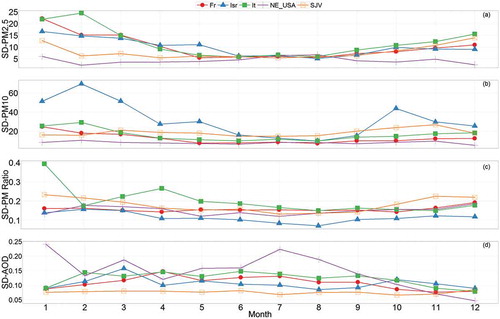
Descriptive statistics of the PM2.5 and PM10 concentrations and of the PM ratio are presented in , with the boxplot representing the interquartile (IQ) range and the horizontal line the median of the whole study period. Higher PM10 concentrations are observed in Israel, while the lowest median and IQ range for both PM2.5 and PM10 concentrations have been reported in NE-USA. However, in SJV higher PM10 concentrations are reported than in NE-USA. The European countries experience similar PM2.5 concentrations (mean ~20 μg/m3), which is only marginally higher than in the SJV stations. Interestingly, in spite of the noticeable differences in particle concentrations of both size fractions, the median PM ratio in Israel and that in NE-USA are similar (~0.5). In SJV, the PM ratio is lower than in all the other areas, suggesting a higher load (on average) of coarse particles (PM10-2.5). In SJV, days with PM ratio >0.5 were observed only in the winter (18.8% of the total number of analyzed days). In Israel, PM ratio >0.5 was observed mainly in the summer (47% of the total number of analyzed days). In Italy and France more than 90% of the days were characterized by PM ratio >0.5, and in NE-USA, PM ratio >0.5 occurred in 66% of the days with no clear seasonal trend. demonstrates the seasonal trend of the monthly average parameters whose statistics appear in . The highest PM10 concentrations for all months are in Israel, while in NE-USA, very low and uniform PM2.5 and PM10 concentrations are evident but MAIAC AOD is rather highly varying. The PM ratio in NE-USA also shows considerable seasonal variability. In SJV, the highest PM ratio occurs in December–January, like in NE-USA and in agreement with previous published results (Held et al., Citation2004), but the seasonal variability of the PM ratio is smaller while for both PM fractions it is somewhat larger. Israel experiences a seasonal trend opposite that in SJV, with higher PM ratios in the summer. This pattern is partially related to dust events, which affect both PM fractions but to a distinct extent. The seasonality of the standard deviations (SD) of these parameters is presented in . Israel experiences the lowest SD of the PM ratio throughout the year (), with higher levels in the winter (~0.15). In the other locations the SD ranges between approximately 0.1 and 0.15 in spring and summer, with slightly higher levels in the winter and fall. In all locations except Israel, the SD of PM10 is more uniform than the SD of PM2.5. In Israel, the high SD values in the fall and winter (of both fractions) are due to frequent occurrence of dust events on these months (Yuval et al., Citation2015).
Figure 1. Descriptive statistics of (a) daily PM2.5 concentrations, (b) daily PM10 concentrations, (c) PM ratio, and (d) MAIAC AOD for the whole study period (2009–2011). For visualization purposes, the y-axis was limited in (a) and (b) to 150 μg/m3 and in (d) to 1.5. There are very few higher PM concentrations and AOD records in the database. The boxplots represent the interquartile (IQ; 25%–75%) range of values and the horizontal lines are the median of the whole study period.
Figure 2. Monthly averages of (a) PM2.5 concentrations, (b) PM10 concentrations, (c) PM ratio, and (d) MAIAC AOD in the different study areas during 2009–2011.
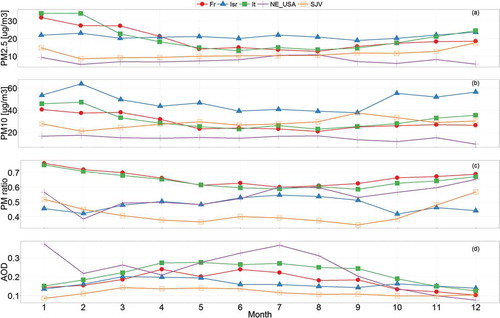
Figure 3. Monthly standard deviations of (a) PM2.5 concentrations, (b) PM10 concentrations, (c) PM ratio, and (d) MAIAC AOD, in the geographic regions studied (2009–2011).
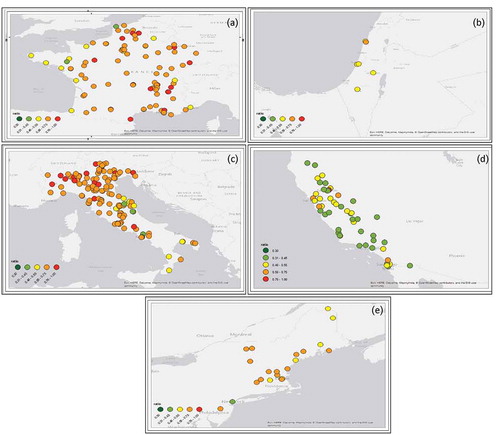
The annual mean PM ratio in each station () further demonstrates that in the majority of the stations, fine (respirable) particles (PM2.5) dominate the ambient inhalable particle concentrations (PM10). Although latitudinal differences could be expected due to prevailing winds, climatology, and land cover, the PM ratio did not reveal an apparent latitudinal pattern, either locally or globally.
Figure 4. Spatial distribution of the annual mean (2011) PM ratio in (a) France, (b) Israel, (c) Italy, (d), SJV, CA, and (e) NE-USA. Green symbols represent a dominant coarse fraction, orange-red symbols represent dominant fine fraction, and yellow symbols represent an approximately equal share of the PM fractions.
The AERONET AE product had better availability than the AERONET fine-mode product and a high correlation to the AERONET AOD rati; nonetheless, using it to proxy the PM fractions resulted in poorer correlations than using the AERONET fine-mode AOD. This result may reflect the additional information (beyond the AE) carried by the fine-mode AOD (O’Neill Citation2003). In all the study areas, good correlations were obtained between AERONET AOD and MAIAC AOD (r = 0.62–0.78; ). Interestingly, in Israel the AERONET AOD ratio showed the highest correlation with the ground PM ratio (r = 0.7; ), whereas both the AERONET AOD and the MAIAC AOD had extremely low correlations with the PM ratio. Moreover, the daily PM2.5 concentrations in Israel showed a very low correlation with the AERONET fine-mode AOD, and moderate correlation with both the AERONET AOD and the MAIAC AOD (). It is noteworthy that the highest correlation of either the MAIAC AOD or AERONET AOD and the PM ratio was obtained for the SJV monitoring data ().
Figure 5. Comparison between AERONET and MAIAC AOD variables to the PM ratio (upper panel) and to PM2.5 concentrations (lower panel) (based on DS1).
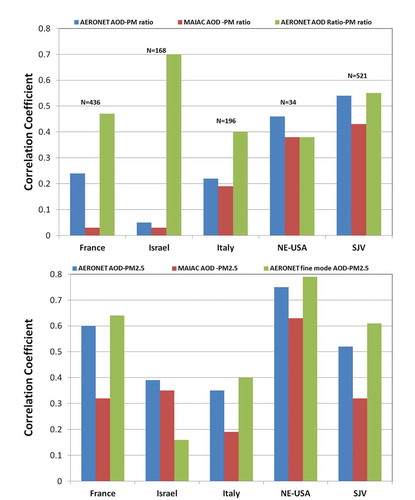
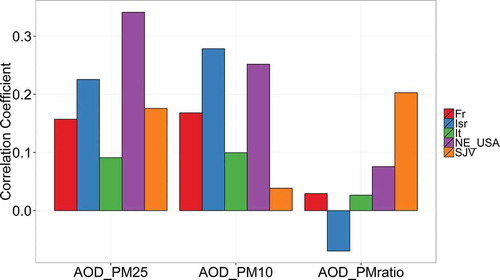
The correlation between the PM ratio and the AERONET AOD ratio in the different study areas ranged between 0.4 and 0.7 (). While these values are higher than the correlations between the MAIAC AOD and the PM ratio (r = 0.03–0.43; ), they are spatially limited to AERONET stations with available data in the study areas. Using MAIAC AOD (instead of AERONET AOD) could overcome this limitation, since MAIAC AOD is available over much larger (and continuous) areas and can potentially track mesoscale spatial variations. As expected, the total number of available observations that include all the parameters except the AERONET AOD increased dramatically (NDS2 =51,781, compared to NDS1 =1,355). However, due to low MAIAC AOD availability in the winter (as a result of cloud masking), there were fewer days in the winter with both MAIAC AOD and PM observations, which represents a considerable seasonal bias. Despite small differences in the median AOD among the study areas (), the seasonal AOD patterns are distinct (). SJV and Israel experience low seasonal variability of MAIAC AOD, with the average MAIAC AOD <0.2 throughout the year. Italy and France are characterized by a slightly higher average MAIAC AOD (>0.2) in the spring and summer months (April–July), and a lower average MAIAC AOD in the winter. The low MAIAC AOD values in the winter are evident in all the geographic regions except for January in NE-USA, which is derived by an insufficient number of observations and an outlier, which probably resulted from residual snow. The SD of the monthly average AOD in most locations ranges between 0.05 and 0.15 (), with NE-USA revealing a fluctuating signal that can be probably attributed to the inaccuracies already discussed. presents the Pearson correlation coefficients between collocated MAIAC AOD, PM concentrations, and the PM ratio (i.e., DS2). The correlation of MAIAC AOD and the PM ratio for each station over the whole study period (see Supplementary Information, ) depicts poor (negative or positive) correlations at most stations (we do not have any explanation for the negative correlations). Although clear differences in the correlations between MAIAC AOD and all the parameters are observed across the study areas (), these differences are not spatially (geographically) consistent, and in particular low correlations were obtained between the MAIAC AOD and the PM ratio (except for SJV). Also, the spatial variability of the correlations shows no apparent pattern in relation to geo-climatic conditions (i.e., with respect to distance to the coast line, mountainous terrain, urbanization, etc.).
Figure 6. Correlation coefficients between collocated MAIAC AOD and PM2.5 concentrations, PM10 concentrations, and PM ratio for the whole study period (2009–2011) (DS2).
Discussion
Apart from distinct seasonal patterns of the PM ratio in the different study areas (), no clear latitudinal patterns nor geographic explanations could shade light on the variability of the results reported in this work, either on a global or on a local scale (). The spatial variability might be related to local emissions, for which data were not available for us, but we suspect that local emissions cannot explain all the differences. On average, the PM ratio in NE-USA is only slightly higher than in Israel (0.56 vs. 0.48, respectively) while in SJV it is much lower (0.33), suggesting that the latter region is mostly dominated by coarse particles throughout the year compared to the northeastern United States (see also Green et al. Citation2009). Thus, despite the high PM10 concentrations in Israel as a result of dust events occurrence (Yuval et al. Citation2015), these do not have a large effect on the multi-annual average PM ratio.
AERONET AOD variables clearly demonstrate, in all the locations studied, better relationships to the PM ratio and the PM2.5 concentrations than MAIAC AOD. This demonstrates the importance of using AERONET as a proxy to ground PM concentrations and PM ratio, but also emphasizes the limitations of this data source (e.g., the large difference in number of observations between DS1 and DS2). However, although accounting for MAIAC AOD (instead of AERONET AOD) increased dramatically the number of observations available for the analysis, the correlations between MAIAC AOD and PM2.5 were rather low. To examine the representativeness of the MAIAC data, correlations between MAIAC AOD and PM2.5 were calculated for two data sets: (a) MAIAC AOD collocated at all the PM2.5 stations, and (b) MAIAC AOD collocated only at PM stations that report both PM fractions (PM2.5 and PM10). Using these two data sets, the difference between the results was hardly 1–2%, suggesting that the data we used (collocation at stations that monitor both PM fractions) are representative of all the other stations. Furthermore, the correlations between the Dark Target and Deep Blue MODIS AOD (10 km) and the PM ratio over NE-USA and Israel were also very low (). This demonstrates that the insensitivity of the AOD to the PM ratio is not specific to the MAIAC retrieval algorithm (note though that all the retrieval algorithms tested are based on the same MODIS L1B data). In particular, the seasonal patterns of the MAIAC AOD and of the PM ratio show different patterns, with opposing trends in Italy, France, and SJV. NE-USA experienced the lowest PM concentrations and variability of both PM fractions, but the highest MAIAC AOD levels (–) and relatively high correlations between the MAIAC AOD and both PM fractions. It is noteworthy that the correlations between MAIAC AOD and PM2.5 for NE-USA were lower than those obtained between AERONET AOD and PM2.5, in agreement with Chudnovsky et al. (Citation2013). This possibly results from MAIAC AOD calibration, which is based on AERONET data (like all other MODIS-based AOD products). Furthermore, the number of available days with complete data was significantly lower in NE-USA (monthly average of n =15) than in all other locations (monthly average of n = 70–87). Figure 2s (in the Supplementary Information) demonstrates the monthly correlations compared to the multi-annual correlation presented in . Since the AERONET fine fraction AOD and the AERONET AOD ratio showed relatively high correlations with PM2.5 concentrations and the PM ratio (; note the very small number of stations in Israel, ), we recommend incorporating the AERONET fine-mode AOD in the MAIAC calibration process. Possibly, a calibrated MAIAC fine-mode AOD product can overcome the spatial limitations of the AERONET data and open new channels for linking satellite AOD retrievals and ground PM concentrations.
Table 3. Correlations between AOD, PM2.5, and the PM ratio using satellite-based AOD retrievals by different algorithms (2009–2011).
The results presented in this work demonstrate the spatiotemporal characteristics of the PM ratio and the MAIAC AOD in different regions, with the MAIAC AOD retrievals not showing much seasonal or conspicuous geographic variability (). The PM ratio did not reveal an apparent latitudinal pattern, either locally nor globally. Our results agree with previously reported average PM2.5-to-PM10 ratios in Europe, the United States and Beijing (Eldred et al., Citation1997; Gomišček et al., Citation2004; Zhou, Citation2015), suggesting that on average the fine fraction dominates the ambient PM in most areas, and that only small differences in the PM ratios are evident.
Although higher correlations were found between the PM ratio and the AERONET AOD ratio than to the MAIAC AOD, the spatial availability of AERONET data is very limited (for applications such as environmental health studies). Moreover, although AOD has been extensively used for PM prediction of both PM fractions (e.g., Streets et al. Citation2013; Wu et al. Citation2012; Guo et al. Citation2009; Liu, Paciorek, and Koutrakis Citation2009), the poor raw correlation between AOD and the measures tested in this study and the spatial extent of our results suggest that further meticulous study is needed for better understanding the association between satellite-based AOD and ground PM concentrations. For example, the relatively high R2 reported sometimes could, in part, be attributed to explained variability coming from other (hidden) variables, such as the date, seasonality, and long-period averaging.
Conclusions
Different PM measures and AOD products from several sources have been examined across different geographic regions. Monthly trends were observed for both the PM and AOD parameters, representing the seasonality of these parameters but also attributed to sampling bias related to the day of the year. In contrast, spatial (geographic) patterns have not been observed for any of these parameters. In particular, MAIAC AOD variations in the different regions did not correspond to those of the PM concentration or of the PM ratio, nor have clear associations been found between the MAIAC AOD and the month, region, or PM concentrations. Although the correlations between the PM ratio and the AERONET AOD ratio were found to be higher than the correlations between any MODIS-based AOD and the PM ratio, the AERONET data are spatially limited (i.e., scarce stations). Using the MAIAC AOD (instead of the AERONET AOD) as a means to overcome this limitation, since MAIAC AOD has a continuous high-resolution spatial coverage, did not provide the expected results (). We found that whenever both the AERONET AOD and the AERONET fine-mode AOD are available, the AERONET AOD ratio can proxy reasonably well the ground PM ratio. Therefore, we recommend incorporating the fine-mode AERONET AOD in MAIAC calibration. Specifically, this indicates the need to revisit MAIAC regional aerosol microphysical model assumptions used to generate the look-up tables (LUTs) and conduct retrievals. Furthermore, relatively large variations in measured PM ratio show that adding seasonality in aerosol microphysics used in LUTs, which is currently static, could also help improve accuracy of MAIAC retrievals. Our results call for further scrutiny of satellite-borne AOD for better understanding its limitations and relation to the vertical aerosol profile and particle size, shape, and composition. This work is one step of the required analyses to gain better understanding of what the satellite-based AOD represents.
Supplementary files
Download PDF (680.1 KB)Acknowledgment
The research was partially done at the Technion Center of Excellence in Exposure Science and Environmental Health (TCEEH). We thank Giorgio Cattani and Alessandra Gaeta at the Italian National Institute for Environmental Protection and Research for providing PM data for Italy; Maxime Beauchamp and Mohammed Hamida at the French National Centre for Industrial Safety and Environmental Protection (INERIS) for providing PM data for France; the AERONET PI investigators and their staff for establishing and maintaining the sites used in this investigation; and our colleagues at NASA GSFC for providing the MODIS 10-km AOD products.
Supplemental data
Supplemental data for this article can be accessed on the publisher’s website.
Additional information
Notes on contributors
Meytar Sorek-Hamer
Meytar Sorek-Hamer is a research scientist with the Technion Center of Excellence in Exposure Science and Environmental Health (TCEEH), Technion Institute of Technology in Haifa, Israel, and at the Department of Geography and Environmental Development, Ben-Gurion University, in Beer-Sheva, Israel.
David M. Broday
David M. Broday is an associate professor at the Faculty of Civil & Environmental Engineering, and Director of the TCEEH, both at the Technion Institute of Technology in Haifa, Israel.
Robert Chatfield
Robert Chatfield is an atmospheric scientist with the Earth Science Division at NASA Ames Research Center, in Mountain View, CA.
Robert Esswein
Robert Esswein is a scientific analyst and programmer working with the Bay Area Environmental Institute at NASA Ames Research Center, in Mountain View, CA.
Massimo Stafoggia
Massimo Stafoggia is a statistician with the Etiological and Occupational Epidemiology unit at the Department of Epidemiology of the Regional Health Service–Lazio, in Rome, Italy.
Johanna Lepeule
Johanna Lepeule is a researcher with the Environmental Epidemiology Department at INSERM, Grenoble, Rhône-Alpes, France.
Alexei Lyapustin
Alexei Lyapustin is a research scientist at NASA Goddard Space Flight Center (GSFC), Greenbelt, MD.
Itai Kloog
Itai Kloog as a senior lecturer at the Department of Geography and Environmental Development, Ben-Gurion University in Beer-Sheva, Israel.
Related Research Data
References
- Chudnovsky, A., C. Tang, A. Lyapustin, Y. Wang, J. Schwartz, and P. Koutrakis. 2013. A critical assessment of high-resolution aerosol optical depth retrievals for fine particulate matter predictions. Atmos. Chem. Phys. 13:10907–17. doi:10.5194/acp-13-10907-2013
- Chudnovsky, A.A., P. Koutrakis, I. Kloog, S. Melly, F. Nordio, A. Lyapustin, Y. Wang, and J. Schwartz. 2014. Fine particulate matter predictions using high resolution aerosol optical depth (AOD) retrievals. Atmos. Environ. 89:189–98. doi:10.1016/j.atmosenv.2014.02.019
- Deshmukh, D.K., M.K. Deb, and S.L. Mkoma. 2012. Size distribution and seasonal variation of size-segregated particulate matter in the ambient air of Raipur city, India. Air Qual. Atmos. Health 10:259–76. doi:10.1007/s11869-011-0169-9
- Dubovik, O., B. Holben, T.F. Eck, A. Smirnov, Y.J. Kaufman, M.D. King, D. Tanré, and I. Slutsker. 2002. Variability of absorption and optical properties of key aerosol types observed in worldwide locations. J. Atmos. Sci. 59(3):590–608; doi:10.1175/1520-0469(2002)059<0590:VOAAOP>2.0.CO;2
- Dubovik, O., and M.D. King. 2000. A flexible inversion algorithm for retrieval of aerosol optical properties from Sun and sky radiance measurements. J. Geophys. Res. 105:20673. doi:10.1029/2000JD900282
- Eldred, R.A., T.A. Cahill, and R.G. Flocchini. 1997. Aerosols in the IMPROVE Network. J. Air Waste Manage. Assoc. 47:194–203. doi:10.1080/10473289.1997.10464422
- Engel-Cox, J.A., C.H. Holloman, B.W. Coutant, and R.M. Hoff. 2004. Qualitative and quantitative evaluation of MODIS satellite sensor data for regional and urban scale air quality. Atmos. Environ. 38:2495–509. doi:10.1016/j.atmosenv.2004.01.039
- European Environment Agency. 2012. Particulate matter from natural sources and related reporting under the EU Air Quality Directive in 2008 and 2009. doi:10.2800/55574
- Gomišček, B., H. Hauck, S. Stopper, and O. Preining. 2004. Spatial and temporal variations of PM1, PM2.5, PM10 and particle number concentration during the AUPHEP project. Atmos. Environ. 38:3917–34. doi:10.1016/j.atmosenv.2004.03.056
- Green, M., S. Kondragunta, P. Ciren, and C. Xu. 2009. Comparison of GOES and MODIS aerosol optical depth (AOD) to aerosol robotic network (AERONET) AOD and IMPROVE PM2.5 mass at Bondville, Illinois. J. Air Waste Manage. Assoc. 59:1082–91. doi:10.3155/1047-3289.59.9.1082
- Guo, J.-P., X.-Y. Zhang, H.-Z. Che, S.-L. Gong, X. An, C.-X. Cao, J. Guang, H. Zhang, Y.-Q. Wang, X.-C. Zhang, M. Xue, and X.-W. Li. 2009. Correlation between PM concentrations and aerosol optical depth in eastern China. Atmos. Environ. 43:5876–86. doi:10.1016/j.atmosenv.2009.08.026
- Gupta, P., and S.A. Christopher. 2008. Seven year particulate matter air quality assessment from surface and satellite measurements. Atmos. Chem. Phys. Discuss. 8:327–65. doi:10.5194/acpd-8-327-2008
- Held, T., Q. Ying, A.Kaduwela, and M. Kleeman. 2004. Modeling particulate matter in the San Joaquin Valley with a source-oriented externally mixed three-dimensional photochemical grid model. Atmos. Environ. 38:3689–711. doi:10.1016/j.atmosenv.2004.02.053
- Holben, B.N., D. Tanré, A. Smirnov, T.F. Eck, I. Slutsker, N. Abuhassan, W.W. Newcomb, J.S. Schafer, B. Chatenet, F. Lavenu, Y.J. Kaufman, J. Castle, A. Vande, Setzer, B. Markham, D. Clark, R. Frouin, R. Halthore, A. Karneli, N.T. O’Neill, C. Pietras, R.T. Pinker, K. Voss, and G. Zibordi. 2001. An emerging ground-based aerosol climatology: Aerosol optical depth from AERONET. J. Geophys. Res. 106:12067. doi:10.1029/2001JD900014
- Kaskaoutis, D.G., H. Kambezidis, A.D. Adamopoulos, and P.A. Kassomenos. 2006. On the characterization of aerosols using the Ångström exponent in the Athens area. J. Atmos. Solar-Terrestrial Phys. 68:2147–63. doi:10.1016/j.jastp.2006.07.008
- Kaufman, Y.J., D. Tanré, and O. Boucher. 2002. A satellite view of aerosols in the climate system. Nature 419:215–23. doi:10.1038/nature01091
- Kloog, I., A.A. Chudnovsky, A.C. Just, F. Nordio, P. Koutrakis, B.A. Coull, A. Lyapustin, Y. Wang, and J. Schwartz. 2014a. A new hybrid spatio-temporal model for estimating daily multi-year PM2.5 concentrations across northeastern USA using high resolution aerosol optical depth data. Atmos. Environ. 95:581–90. doi:10.1016/j.atmosenv.2014.07.014
- Kloog, I., F. Nordio, A. Zanobetti, B.A. Coull, P. Koutrakis, and J.D. Schwartz. 2014b. Short term effects of particle exposure on hospital admissions in the Mid-Atlantic states: A population estimate. PLoS ONE 9:e88578. doi:10.1371/journal.pone.0088578
- Laden, F., L.M. Neas, D.W. Dockery, and J. Schwartz. 2000. Association of fine particulate matter from different sources with daily mortality in six US cities. Environ. Health Perspect. 108:941. doi:10.2307/3435052
- Levy, R.C., S. Mattoo, L.A. Munchak, L.A. Remer, A.M. Sayer, F. Patadia, and N.C. Hsu. 2013. The Collection 6 MODIS aerosol products over land and ocean. Atmos. Meas. Tech. 6:2989–3034. doi:10.5194/amt-6-2989-2013
- Liu Y., P. Koutrakis, and R. Kahn. 2007a. Estimating fine particulate matter component concentrations and size distributions using satellite-retrieved fractional aerosol optical depth: Part 1—Method development. J. Air Waste Manage. Assoc. 57:1351–59. doi:10.3155/1047-3289.57.11.1351
- Liu Y., P. Koutrakis, R. Kahn, S. Turquety, and R.M. Yantosca. 2007b. Estimating fine particulate matter component concentrations and size distributions using satellite-retrieved fractional aerosol optical depth: Part 2—A case study. J. Air Waste Manage. Assoc. 57:1360–69. doi:10.3155/1047-3289.57.11.1351
- Liu, Y., C.J. Paciorek, and P. Koutrakis. 2009. Estimating regional spatial and temporal variability of PM2.5 concentrations using satellite data, meteorology, and land use information. Environ. Health Perspect. 117:886–92. doi:10.1289/ehp.0800123
- Nordio, F., I. Kloog, B.A. Coull, A. Chudnovsky, P. Grillo, P.A. Bertazzi, A.A. Baccarelli, and J. Schwartz. 2013. Estimating spatio-temporal resolved PM10 aerosol mass concentrations using MODIS satellite data and land use regression over Lombardy, Italy. Atmos. Environ. 74:227–36. doi:10.1016/j.atmosenv.2013.03.043
- O’Neill, N.T. 2003. Spectral discrimination of coarse and fine mode optical depth. J. Geophys. Res. 108:4559. doi:10.1029/2002JD002975
- Pelletier, B., R. Santer, and J. Vidot. 2007. Retrieving of particulate matter from optical measurements: A semiparametric approach. J. Geophys. Res. 112:D06208. doi:10.1029/2005JD006737
- Rosen, R., A. Chu, J.J. Szykman, R. DeYoung, J.A. Al-Saadi, A. Kaduwela, and C. Bohnenkamp. 2006. Application of satellite data for three-dimensional monitoring of PM2. 5 formation and transport in San Joaquin Valley, California. In SPIE Optics+ Photonics, 629904. San Diego, CA: International Society for Optics and Photonics. doi:10.1117/12.681649.
- Russell, P.B., R.W. Bergstrom, Y. Shinozuka, A.D. Clarke, P.F. DeCarlo, J.L. Jimenez, J.M. Livingston, J. Redemann, B. Holben, O. Dubovik, and A. Strawa. 2010. Absorption Angstrom Exponent in AERONET and related data as an indicator of aerosol composition. Atmos. Chem. Phys. Discuss. 9:21785–817. doi:10.5194/acpd-9-21785-2009
- Sai Suman, M.N., H. Gadhavi, V. Ravi Kiran, A. Jayaraman, and S.V.B. Rao. 2014. Role of Coarse and Fine Mode Aerosols in MODIS AOD Retrieval: a case study over southern India. Atmos. Meas. Tech. 7:907–17. doi:10.5194/amt-7-907-2014
- Sayer, A.M., L.A. Munchak, N.C. Hsu, R.C. Levy, C. Bettenhausen, and M.-J. Jeong. 2014. MODIS Collection 6 aerosol products: Comparison between Aqua’s e-Deep Blue, Dark Target, and “merged” data sets, and usage recommendations. J. Geophys. Res. Atmos. 119:13,965–89. doi:10.1002/2014jd022453
- Sharma, M., and S. Maloo. 2005. Assessment of ambient air PM10 and PM2.5 and characterization of PM10 in the city of Kanpur, India. Atmos. Environ. 39:6015–26. doi:10.1016/j.atmosenv.2005.04.041
- Sinyuk, A., B.N. Holben, A. Smirnov, T.F. Eck, I. Slutsker, J.S. Schafer, D.M. Giles, and M. Sorokin. 2012. Assessment of error in aerosol optical depth measured by AERONET due to aerosol forward scattering. Geophys. Res. Lett. 39. doi:10.1029/2012GL053894
- Song, W., H. Jia, J. Huang, and Y. Zhang. 2014. A satellite-based geographically weighted regression model for regional PM 2.5 estimation over the Pearl River Delta region in China. Remote Sens. Environ. 154:1–7. doi:10.1016/j.rse.2014.08.008
- Sorek-Hamer, M., I. Kloog, P. Koutrakis, A.W. Strawa, R. Chatfield, A. Cohen, W.L. Ridgway, and D.M. Broday. 2015. Assessment of PM2.5 concentrations over bright surfaces using MODIS satellite observations. Remote Sens. Environ. 163:180–85. doi:10.1016/j.rse.2015.03.014
- Sorek-Hamer, M., A.W. Strawa, R.B. Chatfield, R. Esswein, A. Cohen, and D.M. Broday. 2013. Improved retrieval of PM2.5 from satellite data products using non-linear methods. Environ. Pollut. 182:417–23. doi:10.1016/j.envpol.2013.08.002
- Strawa, A.W., R.B. Chatfield, M. Legg, B. Scarnato, and R. Esswein. 2013. Improving retrievals of regional fine particulate matter concentrations from Moderate Resolution Imaging Spectroradiometer (MODIS) and Ozone Monitoring Instrument (OMI) multisatellite observations. J. Air Waste Manage. Assoc. 63:1434–46. doi:10.1080/10962247.2013.822838
- Streets, D.G., T. Canty, G.R. Carmichael, B. de Foy, R.R. Dickerson, B.N. Duncan, D.P. Edwards, J.A. Haynes, D.K. Henze, M.R. Houyoux, D.J. Jacob, N.A. Krotkov, L.N. Lamsal, Y. Liu, Z. Lu, R.V. Martin, G.G. Pfister, R.W. Pinder, R.J. Salawitch, and K.J. Wecht. 2013. Emissions estimation from satellite retrievals: A review of current capability. Atmos. Environ. 77:1011–42. doi:10.1016/j.atmosenv.2013.05.051
- Wang, J., and S.A. Christopher. 2003. Intercomparison between satellite-derived aerosol optical thickness and PM 2.5 mass: Implications for air quality studies. Geophys. Res. Lett. 30:2095. doi:10.1029/2003GL018174
- Wu Y.R., J.P. Guo, X.Y. Zhang, X. Tian, J.H. Zhang, Y.Q. Wang, J. Duan, and X.W.Li. 2012. Synergy of satellite and ground based observations in estimation of particulate matter in eastern China. Sci. Total Environ. 433:20–30. doi:10.1016/j.scitotenv.2012.06.033
- Yuval, M. Sorek-Hamer, A. Stupp, P. Alpert, and D.M. Broday. 2015. Characteristics of the east Mediterranean dust variability on small spatial and temporal scales. Atmos. Environ. 120:51–60. doi:10.1016/j.atmosenv.2015.08.058
- Zhou, Y. 2015. Temporal and spatial characteristics of ambient air quality in Beijing, China. Aerosol Air Qual. Res. 15:1868–1880. doi:10.4209/aaqr.2014.11.0306