
ABSTRACT
In order to study effects of ambient particulate matter (PM) it was previously necessary to have access to a comprehensive air monitoring network. However, there are locations in the world where PM levels are above generally accepted exposure standards but lack a monitoring infrastructure. This is true in Iraq and other locations in Southwest Asia and Afghanistan where U.S. and other coalition troops were deployed beginning in 2001. Since aerosol optical depth (AOD), determined by satellite, and visibility are both highly related to atmospheric PM2.5 (particulate matter with an aerodynamic diameter ≤2.5 μm) concentrations, we employed a novel approach that took advantage of historic airport visibility measurements to calibrate the AOD–visibility relationship and determine visibility spatially and temporally (2006–2007) over an approximately 17,000 km2 region of Iraq. We obtained daily visibility predictions that were highly associated with satellite-based 1x1 km AOD daily observations (R2=0.87). Based on a previously derived calibration between PM2.5 and visibility, we were able to predict spatially and temporally resolved PM2.5 concentrations. Variability of PM2.5 among sites was high, with daily concentrations differing by as much as ~30 μg/m3. This study demonstrates the feasibility of characterizing historic PM2.5 exposures in Iraq and other locations in Southwest Asia and Afghanistan with similar climate characteristics. This is of utility for epidemiologists seeking to assess the potential health effects related to PM2.5 exposures among previously deployed military personnel and of the population of the region.
Implications: This study demonstrates the ability to utilize aerosol optical depth to successfully estimate visibility spatially and temporally in Southwest Asia and Afghanistan. This enables for the estimation of spatially resolved PM2.5 concentrations in the region. The ability to caracterize PM2.5 concentrations in Southwest Asia and Afghanistan is highly important for epidemiologists investigating the relationship between chronic exposure to PM2.5 and respiratory diseases among military personnel deployed to the region. This information will better position policy makers to draft meaningful legislation relating to military health.
Introduction
In the United States (U.S.) and much of Europe, the development of extensive PM monitoring networks has enabled the successful characterization of historic PM exposure over large regions. However, in most countries of the world, monitoring networks do not exist. This lack of quantitative PM exposure information, particularly in Southwest Asia and Afghanistan where PM values are known to be elevated, limits the assessment of potential health effects, both in the native population and in previously deployed military personnel. There are reports of asthma in returning deployers as well as elevated rates of encounters for asthma/chronic obstructive pulmonary disease (COPD) and allied conditions relative to soldiers at U.S. bases (Szema et al., Citation2010, Citation2011; Abraham et al., Citation2012, Citation2014).
Although several wealthier countries in the region such as Kuwait, Qatar, and the United Arab Emirates have established limited networks for monitoring PM10 (particulate matter with an aerodynamic diameter ≤10 μm) and several gaseous pollutants since the early 2000s, there are no networks designed to provide comprehensive air pollution data throughout the entire region, as exists in the U.S. and Europe. In several countries, limited PM2.5 measurements began only over the last 5 years and employ sampling methods that are inadequate to collect particles during dust storms, which are common occurrences each year (National Research Council [NRC], Citation2010).
In response to concerns about the respiratory effects of deployment in these regions, the Department of Defense (DoD) conducted the Enhanced Particulate Matter Surveillance Program (EPMSP) at military sites during 2006–2007, showing that mean concentrations of PM2.5 ranged from approximately 35 to 145 µg/m3 (NRC, Citation2010). This is considerably higher than the annual national average encountered in the U.S. during the same period (~12 µg/m3) and exceeds the 1-yr Military Exposure Guideline value (15 µg/m3) set by the U.S. Army Center for Health Promotion and Preventive Medicine (U.S. Environmental Protection Agency [EPA], 2016). This type of quantitative information, albeit on a greater spatial and temporal scale, is critical to enabling causal inference.
Sources of PM near military bases in Southwest Asia and Afghanistan include windblown dust and dust storms, as well as local combustion sources such as open-pit refuse burning, compression ignition vehicles, aircraft engines, diesel electric generators, and local industry (Institute of Medicine [IOM], Citation2011). This mix of pollution sources is different from that encountered in the U.S. and Europe, where most previous health studies have been conducted. Further, PM exposures in this region are orders of magnitude higher than those commonly found in the U.S., and last several months to several years depending on the length and numbers of deployments.
In a recent study, we established the relationship between visibility and PM2.5 in Southwest Asian and Afghanistan (Masri et al., Citationin press). This relationship with visibility is due to the light extinction (scattering and absorption) effects of particles with sizes similar to the wavelengths of visible light, which has been empirically shown in a number of studies (Burt, Citation1961; Noll et al., Citation1968; Charlson, Citation1969; Waggoner and Weiss, Citation1980; Abbey et al., Citation1995). Although visibility is a useful surrogate of human exposures to ambient particles, measurements are spatially limited by the number of existing monitoring stations.
An alternate measurement of light extinction by particles in the atmosphere is aerosol optical depth (AOD), collected by satellite. AOD is a vertical integration measure of the total abundance of particles in the entire atmospheric column, in contrast to visibility, which is a measure of the particle abundance near the ground. Satellite imagery of the earth’s surface and atmosphere represents an important tool for air quality and pollution monitoring due to its extensive spatial coverage and repeated observations. Like visibility, AOD can be used to estimate ground-level PM exposure. Our research team has previously developed methods for the application of high-resolution satellite data for exposure assessment and health effects studies (Kloog et al., Citation2011, Citation2012, Citation2014; Lee et al., Citation2011; Chudnovsky et al., Citation2013). Such work has enabled the reliable assessment of short- and long-term human exposures to PM2.5, allowing for the investigation of both the acute and chronic effects of ambient particles. Application of our exposure estimates include the assessment of the association of PM2.5 with both hospital admissions in New England and birth weight for all births in Massachusetts.
In the present study, we conducted a pilot assessment using previously collected AOD and visibility data in Iraq to model PM2.5 concentrations. Specifically, we used 1845 paired daily airport visibility and AOD measurements (1 × 1 km resolution) collected in Iraq to develop a calibration model that will be used to convert AOD to ground visibility estimates in the region. Using the relationship between visibility and PM2.5 from our previous work in the region, we estimated PM2.5 over an area of approximately 17,000 km2 in Iraq during a period of 2 yr (2006–2007).
Methods
Iraq is a large desert country located at the northern end of the Persian Gulf, to the west of Iran and east of Syria. The country experiences summers that are hot and dry, extending for roughly 4 months, from June to September, and with temperatures often in excess of 38 °C (~100 °F). Winters are long but mild, lasting from December to March, and with nighttime temperatures typically above freezing. Precipitation and humidity are low, with annual precipitation averaging less than 25 cm across most of the country. The general region is subject to Shamal winds, which generate intense dust storms, usually during the summer months of June and July (National Oceanic and Atmospheric Administration [NOAA], Citation2009).
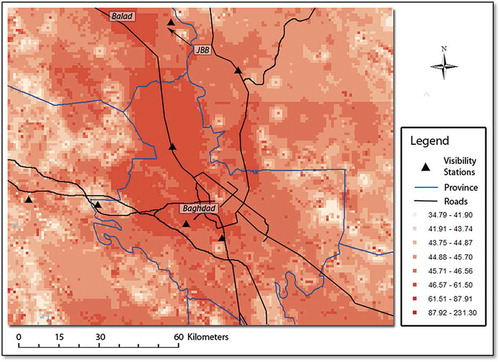
We selected a region in Iraq of approximately 17,000 km2 that includes Bagdad and Joint Base Balad (JBB). This region was selected because of its high yet variable air pollution levels and the presence of U.S. military personnel, which gives relevance to understanding such variability and pollution concentrations (Institute of Medicine, Citation2011). Additionally, the region is sufficiently large to encompass low population desert areas with fewer pollution sources, and in turn enable an understanding of the PM2.5 in the region.
Aerosol optical depth
AOD measurements were collected by the Moderate Resolution Imaging Spectroradiometer (MODIS), which sits on two Earth Observing System (EOS) satellites launched by the National Aeronautic and Space Administration (NASA), namely, Terra, launched in 1999, and Aqua, launched in 2002. The MODIS satellite provides daily AOD measurements for the entire Earth. Daily observations were retrieved for the years 2006 and 2007 for the entire area of Iraq. Recently, NASA developed a new algorithm, Multi-Angle Implementation of Atmospheric Correction (MAIAC), to process MODIS data. MAIAC retrieves aerosol parameters over land at a high resolution of 1 × 1 km, as compared with the previously reported 10 km. Our research team has evaluated the first and second generations of MAIAC products and have applied them successfully to assess PM2.5 exposures and health effects in New England (Fleisch et al., Citation2014). From our analyses, we have determined that MAIAC data can also be used for arid (desert) environments with high surface reflectance such as Iraq.
Visibility data
Visibility data were obtained from the U.S. Air Force 14th Weather Squadron and included seven sites across the study region and period. Visibility was measured continuously using either an AN/FMQ-19 Automatic Meteorological Station (Coastal Environmental Systems, Inc., Seattle, WA, USA) or a TMQ-53 Tactical Meteorological Observing System (Vaisala Inc., Vantaa, Finland), and was reported hourly. Most sensors measure visibility from approximately 400 to 9999 m. Maximum measurements exceeding this typical upper limit become less accurate, which can introduce error and affect the relationship between visibility and atmospheric particle mass. Measurements greater than this cutoff were therefore truncated to 9999 m in this analysis. In order to generate daily averages for use in model calibration, we averaged hourly measurements over 24-hr periods that coincided with daily AOD measurements. Rain and near-saturation periods, when relative humidity ≥98%, were not included in the analysis. However, since this region is arid with low rainfall, these conditions were observed for only a small fraction of days (~4%).
Statistical approach
To calibrate a model that uses AOD to predict visibility, we matched each of seven visibility monitoring stations with a corresponding 1 × 1 km AOD grid cell. Paired measurements were matched by selecting the AOD grid cell that contained the corresponding visibility station. In contrast to studies that use coarse resolution satellite data, our use of high-resolution (1 × 1 km) AOD measurements enabled more precise pairing of AOD with visibility, and therefore more accurate calibration of the AOD-visibility relationship. In total, 1845 paired AOD-visibility observations were used for model calibration, spanning a 2-yr period from January 2006 to December 2007. The locations of visibility monitoring stations are depicted in . Visibility monitoring sites used in model calibration were located in both rural and urban areas and contributed variable amounts of data for model calibration (not all stations contained 365 daily observations). In terms of total data used in model calibration, however, an approximately equal amount of rural (45%) and urban (55%) observations were represented. Using our AOD-visibility–matched measurements, we applied a mixed-effects model using AOD measurements as predictors to establish a relationship between visibility and AOD.
Figure 1. Map showing visibility monitoring stations in Iraq study region.
In order to estimate visibility and convert these estimates to PM2.5 in each grid cell on each day, we conducted the prediction process in four stages. Before presenting each stage, we will first summarize the stages here. The Stage 1 model calibrates the AOD grid-level observations to the visibility monitoring data collected within 1 km of an AOD reading by regressing visibility monitoring data on AOD values. Since the relationship between AOD and visibility varies from day to day (due to differences in mixing height, relative humidity, particle composition, vertical profiles, etc.), this calibration is performed on a daily basis. In Stage 2, we predict visibility concentrations in grid cells where no visibility monitoring exists but with available AOD measurements using the Stage 1 AOD-visibility relationship. This is achieved by applying the prediction equation obtained from the model fit in Stage 1 to these additional AOD values. In Stage 3, we fit a model using predicted visibility from Stage 2 and spatial associations among visibility values on a given day to estimate visibility in cells where both visibility and AOD data are missing. To convert visibility to PM2.5 concentrations in each grid cell, Stage 4 then applies coefficients of the relationship between visibility and PM2.5 demonstrated from previous work in the region. The four stages are applied to data at the 1 × 1 km grid cell level.
Stage 1
To predict visibility, we fit the following mixed-effects multiple linear regression model:
where is the visibility measured at site i corresponding to grid cell i on day j;
are the fixed and day-specific random intercepts, respectively;
is the AOD value in the grid cell i on day j;
are the fixed and day-specific random slopes for AOD;
N(0,
) is the error term at site i on day j; and
is the variance-covariance matrix for the day-specific random effects.
In this model, inverse AOD was used because AOD is a measure of particles in the atmospheric column, and the functional relationship between atmospheric particulate and visibility is known to be inverse. That is, as particulate concentrations increase (increasing AOD), visibility decreases. Since the relationship of AOD and visibility (surrogate for PM2.5) varies from day to day, calibration was performed on a daily basis. Other covariates were tested, such as season, weekday/weekend, elevation, wind direction, precipitation, and numerous land use variables (e.g., distance to oil fields, town centers, waterbodies, etc.), which were obtained either from the U.S. Air Force or ArcGIS (https://www.arcgis.com/features/index.html). Such terms, however, were either not statistically significant or did not improve model performance. After developing the model, predicted and measured daily visibility values were then assessed on a scatter plot.
For validation, we performed a 10-fold cross-validation analysis. This was accomplished by randomly sorting our data set and dividing it into 10 splits. The model, fit to 90% (nine splits) of the visibility data, was then used to predict visibility in the remaining 10% (one split). This process was repeated 10 times, with each iteration holding out a new 10% split of data. Model performance was examined by comparing predicted and measured visibility for each of the 10 cross-validation (CV) trials. Specifically, R2 values were computed and tabulated for each trial along with the square root of the mean squared prediction errors (RMSPE). Further, we estimated the temporal R2 by regressing the predicted ΔVISij against the measured ΔVISij, where predicted ΔVISij is the difference between the predicted VISij in a site corresponding to cell i on day j and its overall mean, and measured ΔVISij is defined similarly for the measured values. Lastly, we estimated the spatial R2 by regressing the site-specific predicted VIS means on the measured one.
Stage 2
To predict visibility for grid cells containing AOD but no visibility measurements, we used the calibrated coefficients and parameters fitted in Stage 1. This resulted in two one-year sets of visibility predictions for all day-AOD cell available combinations yet still no predictions in day-cell combinations with missing AOD data.
Stage 3
To predict visibility for grid cells that contain neither visibility nor AOD measurements (often due to cloud cover), we used the output of Stage 1 (visibility predictions) to predict daily visibility for all grid cells in the study domain. Specifically, we fit a generalized additive mixed model (GAMM) with a smooth function of latitude and longitude (using the grid cell centroids) and a random intercept for each cell. This is similar to other established interpolation techniques, such as universal kriging, that use nearby grid cells to fill missing points. However, in our analysis, we also regressed the daily visibility predictions on the average of those measured at the monitoring stations located within our study region. To allow for the visibility spatial patterns to vary with time, we fit a separate spatial surface for each 2-month period of each year. This enabled our model to incorporate additional information about visibility values that classic interpolation techniques do not utilize. Specifically, we fit the following semiparametric regression model:
where PresVISij is the Stage 2 predicted visibility at grid cell i on a day j; MVISij is the mean of visibility values monitored at the sites in our study region for cell i on a day j; α and ui are the fixed and grid cell–specific random intercepts, respectively; β1 and vi are the fixed and random slopes, respectively; Xi,Y1 are the latitude and longitude, respectively, of the centroid of grid cell i; and is a smooth function of location (modeled by thin plate splines) specific to the 2-month period k(j) in which day j falls, thus a separate spatial smooth was fit for each 2-month period.
As with model calibration, visibility predictions here were validated using 10-fold cross-validation. In this case, we randomly selected 10% of the data across all visibility monitoring sites (seven grid cells) to leave out of the Stage 3 model predictions. The 90% remaining data from the seven sites were then combined with all data from all other grid cells. This combined data set was then used to predict the 10% left out data from the seven monitoring sites. This process was repeated 10 times, with each iteration holding out a new 10% split of monitoring data. Goodness of fit and model bias were then assessed by regressing predicted and measured visibility at the 10% left out data, and calculating the corresponding R2 values for each of the 10 separate iterations. As with Stage 1, temporal and spatial cross-validation was also applied.
Stage 4
In our previous work, daily-integrated PM2.5 concentration data collected at several monitoring sites in Kuwait during the period 2004–2005 were used to calibrate a model for the relationship between PM2.5 and visibility, with relative humidity as a covariate (Masri et al., Citationin press). This study produced PM2.5 predictions that correlated well with observed averages (R2 = 0.84) and performed well through 10-fold internal cross-validation. Further, results from mixed-model regression in this study demonstrated that predictability did not depend on location within the region. To convert visibility to spatially and temporally resolved PM2.5 concentrations in the current study, we used the calibration equation coefficients generated from this previous work. The prediction equation is as follows:
where PredPM2.5ij is the predicted PM2.5 for cell i on a day j; PredVISij is the daily visibility predicted for cell i on a day j; RH2 is the square of relative humidity for cell i on day j; γo, γv, and γm are the coefficients estimated from our previous analysis, which are equal to +39.3691, +732372, and −0.00319, respectively (Masri et al., Citationin press). Grid- and day-specific PM2.5 predictions over varying periods were then calculated, and a map of grid cell–specific averaged PM2.5 estimates over the entire study period was projected onto a map for visual representation.
Results
depicts the relationship between predicted and measured daily visibility. Each point represents a single day for a single station within 1 yr. Importantly, there are only 1845 observations presented in the plot because visibility observations were available for only short periods at some of the visibility stations (not 365 days of the year). Regressing daily visibility resulted in a high R2 value of 0.87, indicating good model fit.
Figure 2. Relationship between predicted and measured daily average visibility.
presents results from Stage 1 cross-validation (CV) analysis. CV trials demonstrated good out-of-sample predictive ability, with a mean out-of-sample R2 value of 0.71 (range: 0.63–0.83). Overall, a significant association was found between visibility and AOD. also presents results for spatial and temporal CV analyses. Results for the spatial analysis showed a high mean R2 of 0.87 (range: 0.60–0.98). This demonstrates the ability of the model to predict well from site to site. Results for the temporal analysis showed an R2 of 0.60 (range: 0.51–0.73). The lower temporal R2 is likely due to our use of only 2 yr of data. Results nonetheless demonstrate that predictions behave similarly to observations over time. shows predicted and measured visibility for each of the 10 CV trials. The resulting plot shows a high R2 of 0.85, further illustrating the high predictive power of the model.
Table 1. Prediction accuracy for 10-fold cross-validation (CV) trials of Stage 1 calibration model.
Figure 3. Plot of predicted versus measured visibility averages for each of 10 CV trials.
presents results from Stage 3 cross-validation (CV) analyses after predicting visibility where neither AOD nor visibility measurements are available. CV trials suggested a very good model performance, with a mean out-of-sample R2 value of 0.84 (range: 0.78–0.91). This is a good performance, particularly considering the absence of both AOD and visibility measurements for the days and grid cells being predicted. also presents results for spatial and temporal CV analyses. The spatial analysis produced a high mean out-of-sample R2 of 0.91 (range: 0.69–0.99). Results for the temporal analysis were lower, but still good, with a mean out-of-sample R2 of 0.71 (range: 0.56–0.84). shows average predicted and measured visibility for each of the 10 CV trials.
Table 2. Prediction accuracy for 10-fold cross-validation (CV) of Stage 3 calibration model.
Prediction errors (RMSPE) for CV analyses of both models 1 and 2 were low on average (791 and 580 m, respectively), corresponding to an error of 9% and 7%, respectively, relative to the mean of visibility (~8500 m) across CV trials. This indicates strong model performance.
illustrates the spatial pattern of PM2.5 predictions, with a high resolution of 1 × 1 km, averaged over the 2-yr study period from 2006 to 2007. Major roadways as well as the city of Baghdad are labeled. The mean and median predicted PM2.5 concentrations for this study area were 45.4 and 39.3 µg/m3, respectively. The slightly skewed distribution of predicted concentrations is possibly due to episodic dust storms. In general, PM2.5 concentrations ranged greatly between grid cells. The interquartile range of mean estimated PM2.5 concentrations was 14.6 µg/m3 (34.2–48.8 µg/m3), with 10th and 90th percentiles of 28.8 and 66.7 µg/m3, respectively.
Figure 4. Spatial pattern of 1 × 1 km PM2.5 predictions averaged over 2 yr (2006–2007).
As seen in , PM2.5 predictions are highest in and around Baghdad and Balad as well as along certain roadways, with concentrations in the range of 46.6–61.5 µg/m3. Joint Base Balad (JBB) military base had high PM2.5 concentrations, although not as high as those of neighboring city centers.
PM2.5 monthly predictions for each of the seven military airport sites and their averages across sites during the 24-month study period are shown in . This figure demonstrates that predicted PM2.5 varied substantially by month and site. Monthly average predictions ranged from 32.7 to 63.5 µg/m3, with an overall mean of 45.4 µg/m3.
Figure 5. PM2.5 monthly predictions by site and across sites during the study period.
When looking at seasonal PM2.5 levels over the study period, summer had the highest predicted average, with a concentration of 51.8 µg/m3. This is consistent with seasonal patterns for this region, in which PM in summer is elevated due to seasonal Shamal winds. Averages across other seasons were markedly lower than summer and comparable to one another, with averages of 41.5, 43.7, and 44.6 µg/m3 for fall, spring, and winter, respectively. Mean predictions between the two study years were similar, with 2007 having a slightly higher average (47.6 µg/m3) compared with 2006 (43.3 µg/m3).
Over the 24-month study period, monthly average predictions across all sites ranged from 29.8 to 69.9 µg/m3, with mean and standard deviation of 46.0 and 7.8 µg/m3, respectively. When assessing intersite variability for individual months, monthly mean concentrations were somewhat but not highly variable. Intersite variability for fixed months ranged from 0.60 to 9.9 µg/m3. For specific months, sites did not deviate greatly from the mean, with a mean standard deviation of 1.4 µg/m3 across all months. This suggests that location explains approximately 20% of the variability in monthly mean PM2.5 estimates observed for the sites in this study. This is shown clearly in , where intermonth variability of predicted PM2.5 is high, whereas intersite variability within individual months is relatively low.
Discussion
In previous studies, the AOD-PM2.5 relationship has been calibrated in order to produce spatial PM2.5 estimates (Yanosky et al., Citation2008; Liu et al., Citation2009; Lee et al., Citation2011; Kloog et al., Citation2012). In Southwest Asia and Afghanistan, however, such PM2.5 measurements are mostly nonexistent. To overcome this limitation in the current study, we employed novel methodology using readily available airport visibility measurements to calibrate the AOD-visibility relationship and predict visibility over space and time, resulting in monthly average predictions that were highly associated with observed averages (R2 = 0.94). In previous work, we established and cross-validated a relationship between visibility and PM2.5 in Kuwait. Utilizing this work in the current study, we were able to convert spatial visibility predictions into PM2.5 estimates.
Previous studies using satellite observations to predict PM2.5 concentrations typically predict with a relatively coarse (10 × 10 km) spatial resolution and often present moderate predictive power (Lee et al., Citation2011; Kloog et al., Citation2012; Yanosky et al., Citation2008; Liu et al., Citation2009). A key advantage to our study is the fine 1 × 1 km resolution of predictions. This helps to reduce exposure error. Additionally, our models yielded high predictive power, in contrast to many other prediction models that assumed that the AOD-PM2.5 relationship remains constant over time (Gryparis et al., Citation2009; Yanosky et al., Citation2008; Aguilera et al., Citation2007). These results demonstrate the feasibility of using our methods to assess historical PM2.5 concentrations in Southwest Asian and Afghanistan, information that was previously not available.
Multiple means of validating the calibration model were employed in this analysis. Internal cross-validation results demonstrated the ability of the model to predict visibility well across randomly divided splits of data, with low prediction errors (~6%) on average. Additionally, roughly equal amounts of rural and urban observations were used in model calibration, which was important given the variability of pollution sources from both land use types.
Given that visibility monitors are restricted to finite maximum readings, a limitation in using visibility measurements is that they are inherently less accurate in cleaner atmospheres. For this reason, it may not be feasible to use visibility as an intermediate to relate AOD with PM2.5 mass in regions such as the U.S. where particulate levels are low. In the present study region, this is of little concern because the region is characterized by high concentrations of ambient PM2.5 (National Research Council, Citation2010). Additionally, use of visibility is particularly advantageous here given the absence of PM2.5 samplers in the study area and surrounding region. Through cross-validation, the model predicted well even towards the upper bound of visibility readings. Regarding precipitation, although excluding days with rain could overestimate PM exposure, this was of negligible concern in this study due to the low frequency of rain events in this region.
During the 2-yr period of this study, average predicted PM2.5 was 45.4 µg/m3. This estimate places Iraq in roughly the midrange of ambient PM2.5 levels relative to other countries in the region. For comparison, the World health Organization (WHO) reported PM2.5 in Lebanon (2010) and Saudi Arabia (2011) at 20 and 28 µg/m3, respectively, whereas Iran (2010) and Qatar (2012) had substantially higher reported PM2.5 at 102 and 93 µg/m3, respectively (WHO, Citation2014). Similarly, the DoD Enhanced Particulate Matter Surveillance Program reported average PM2.5 concentrations ranging from 33 to 117 µg/m3 across 15 sites in Southwest Asia and Afghanistan, with an average concentration of approximately 70 µg/m3 across all sites (Desert Research Institute, Citation2008). The average PM2.5 prediction in the current study is similar to that reported in neighboring Jordan (48 µg/m3) and Kuwait (45 µg/m3) (Brown et al., Citation2008; WHO, Citation2014). PM2.5 predictions were also the highest during the summer months, mostly due to episodic Shamal winds that generate severe dust storms. This pattern is consistent with previous PM studies in the area, including our previous work in Kuwait (National Resource Council, Citation2010). In addition, consistency with previously reported measurements reinforces the quality of PM2.5 estimates. Annually averaged predictions in this study exceeded EPA (12 µg/m3) and WHO (10 µg/m3) suggested annual standards.
We examined the spatial patterns of the 2-yr average PM2.5 estimates. Grid cells in and around Baghdad, Joint Base Ballad, and major roadways were characterized by the highest estimated PM2.5 levels (45–60 µg/m3). This is due to the presence of air pollution sources in these areas such as roadway traffic, industry, airports, and residential sources. Military bases often have additional sources from local diesel generators, heavy-duty vehicles, and open-pit waste incineration. Variability between sites was also high, with monthly averages differing by as much as ~30 µg/m3 between all sites over all months. Approximately 20% of between-site variability over time was attributable to location, whereas 80% was attributable to month of year. Importantly, this study focused on a specific region in Iraq over a 2-yr period. It is likely that the variability in PM2.5 estimates would be even greater when assessing a larger geographic area and over a longer period.
At present, very little PM2.5 exposure data exist in Southwest Asia and Afghanistan and are not available historically. Our results demonstrate the feasibility of using airport visibility and AOD data calibrated to ground-level PM2.5 to estimated exposures in this region.
Acknowledgment
The authors appreciate the assistance of Mike Hunsucker and Jeff Zautner, 14th Weather Squadron (U.S. Air Force), Asheville, NC.
Funding
This work was supported by the VA Cooperative Studies Program No. 595: Pulmonary Health and Deployment to Southwest Asia and Afghanistan, from the U.S. Department of Veterans Affairs, Office of Research and Development, Clinical Science Research and Development, Cooperative Studies Program. This publication was also made possible by U.S. Environmental Protection Agency (EPA) grant RD-83479801. Its contents are solely the responsibility of the grantee and do not necessarily represent the official views of the EPA, U.S. Department of Veterans Affairs, or U.S. Government.
Additional information
Funding
Notes on contributors
Shahir Masri
Shahir Masri is a doctor of science recently graduated from the Department of Environmental Health, Harvard T.H. Chan School of Public Health, in Boston, MA.
Eric Garshick
Eric Garshick is associate chief physician of the Pulmonary, Allergy, Sleep, and Critical Care Medicine Section of the V.A. Boston Healthcare System, and professor of medicine at the Harvard Medical School.
Brent A. Coull
Brent A. Coull is a professor of biostatistics at the Harvard T.H. Chan School of Public Health.
Petros Koutrakis
Petros Koutrakis is a professor of environmental sciences at the Harvard T.H. Chan School of Public Health.
References
- Abbey, D., B.E. Ostro, G. Fraser, T. Vancuren, and R.J. Burchette. 1995. Estimating fine particulate less than 2.5 microns in aerodynamic diameter (PM2.5) from airport visibility data in California. J. Expo. Anal. Environ. Epidemiol. 5:161–180.
- Abraham, J.H., S.F. DeBakey, L. Reid, J. Zhou, and C.P. Baird. 2012. Does deployment to Iraq and Afghanistan affect respiratory health of US military personnel? JOEM. 54:740–745. doi: 10.1097/JOM.0b013e318252969a.
- Abraham, J.H., A. Eick-Cost, L.L. Clark, Z. Hu, C.P. Baird, R. DeFraites, S.K. Tobler, E.E. Riohards, J.M. Sharkey, R.J. Lipnick, and S.L. Ludwig. 2014. A retrospective cohort study of military deployment and postdeployment medical encounters for respiratory condition. Military Medicine. 179:540–546. doi: 10.7205/MILMED-D-13-00443.
- Aguilera, I., J. Sunyer, R. Fernández-Patier, G. Hoek, A. AguirreAlfaro, K. Meliefste, M.T. Bomboi-Mingarro, M.J. Nieuwenhuijsen, D. Herce-Garraleta, and B. Brunekreef. 2007. Estimation of outdoor NOx, NO2, and BTEX exposure in a cohort of pregnant women using land use regression modeling. Environ. Sci. Technol. 42:815–821. doi: 10.1021/es0715492.
- Brown, K.W., W. Bouhamra, D.P. Lamoureux, J.S. Evans, and P. Koutrakis. 2008. Characterization of particulate matter for three sites in Kuwait. J. Air Waste Manage. Assoc. 58:994–1003. doi: 10.3155/1047-3289.58.8.994.
- Burt, E.W. 1961. A study of the relation of visibility to air pollution. Am. Ind. Hyg. Assoc. J. 2:102–108. doi: 10.1080/00028896109343378.
- Charlson, R.J. 1969. Atmospheric visibility related to aerosol mass concentration: Review. Environ. Sci. Technol. 3:913–918. doi: 10.1021/es60033a002.
- Chudnovsky, A., C. Tang, A. Lyapustin, Y. Wang, J. Schwartz, and P. Koutrakis. 2013. A critical assessment of high-resolution aerosol optical depth retrievals for fine particulate matter predictions. Atmos. Chem. Phys. 13:10907–10917. doi: 10.5194/acp-13-10907-2013.
- Desert Research Institute. 2008. Department of Defense Enhanced Particulate Matter Surveillance Program. 2215 Raggio Parkway Reno, NV 89512-1095.
- Fleisch, A.F., D.R. Gold, S.L. Rifas-Shiman, P. Koutrakis, J.D. Schwartz, I. Kloog, S. Melly, B.A. Coull, A. Zanobetti, M.W. Gillman, and E. Oken. 2014. Air pollution exposure and abnormal glucose tolerance during pregnancy: The Project Viva cohort. Environ. Health Perspect. 122:378–383. doi: 10.1289/ehp.1307065.
- Gryparis, A., C.J. Paciorek, A. Zeka, J. Schwartz, and B.A. Coull, 2009. Measurement error caused by spatial misalignment in environmental epidemiology. Biostatistics. 10:258–74. doi: 10.1093/biostatistics/kxn033.
- Institute of Medicine. 2011. Long-Term Health Consequences of Exposure to Burn Pits in Iraq and Afghanistan. Washington, DC: The National Academies Press.
- Kloog, I., A.A. Chudnovsky, A.C. Just, F. Nordio, P. Koutrakis, B.A. Coull, A. Lyapustine, Y. Wang, and J. Schwartz. 2014. A new hybrid spatio-temporal model for estimating daily multi-year PM2.5 concentrations across northeastern USA using high resolution aerosol optical depth data. Atmos. Environ. 95:581–590. doi: 10.1016/j.atmosenv.2014.07.014.
- Kloog, I., P. Koutrakis, B.A. Coull, H.-J. Lee, and J. Schwartz. 2011. Assessing temporally and spatially resolved PM2.5 exposures for epidemiological studies using satellite aerosol optical depth measurements. Atmos. Environ. 45:6267–6275. doi: 10.1016/j.atmosenv.2011.08.066.
- Kloog, I., F. Nordio, B.A. Coull, and J. Schwartz. 2012. Incorporating local land use regression and satellite aerosol optical depth in a hybrid model of spatiotemporal PM2.5 exposures in the Mid-Atlantic states. Environ. Sci. Technol. 46:11913−11921. doi: 10.1021/es302673e.
- Koutrakis, P., B.A. Coull, H.-J. Lee, and J. Schwartz. 2011. Assessing temporally and spatially resolved PM2.5 exposures for epidemiological studies using satellite aerosol optical depth measurements. Atmos. Environ. 45:6267–6275. doi: 10.1016/j.atmosenv.2011.08.066.
- Lee, H.-J. Y. Liu, B.A. Coull, J. Schwartz, and P. Koutrakis. 2011. A novel calibration approach of MODIS AOD data to predict PM2.5 concentrations. Atmos. Chem. Phys. 11:7991–8002. doi: 10.5194/acp-11-7991-2011.
- Liu, Y., C.J. Paciorek, and P. Koutrakis, 2009. Estimating regional spatial and temporal variability of PM2.5 concentrations using satellite data, meteorology, and land use information. Environ. Health Perspect. 117:886–892. doi: 10.1289/ehp.0800123.
- Masri, S.F., E. Garshick, J. Hart, W. Bouhamra, and P. Koutrakis. In press. Use of visual range measurements to predict PM2.5 exposures in Southwest Asia and Afghanistan. J. Air Waste Manage. Assoc. doi: 10.1080/10962247.2016.1243169.
- Morris, M.J., D.W. Dodson, P.F. Lucero, G.D. Haislip, R.A. Gallup, and K.L. Nicholson. 2014. Study of active duty military for pulmonary disease related to environmental deployment exposures (STAMPEDE). Ann. Am. Thorac. Soc. 190:77–84. doi: 10.1164/rccm.201402-0372OC.
- National Research Council. 2010. Review of the Department of Defense Enhanced Particulate Matter Surveillance Program Report. Washington, DC: The National Academies Press.
- National Oceanic and Atmospheric Administration. 2009. National Climatic Data Center: Climate of Iraq. http://www.ncdc.noaa.gov/oa/climate/afghan/iraq-narrative.html (accessed May 10, 2016).
- Noll, K.E., P.K. Mueller, and M. Imada. 1968. Visibility and aerosol concentration in urban air. Atmos. Environ. 2:465–475. doi: 1016/0004-6981(68)90040-1.
- Roberts, A.L., K. Lyall, J.E. Hart, F. Laden, A.C. Just, J.F. Bobb, K.C. Koenen, A. Ascherio, and M.G. Weisskopf. 2013. Perinatal air pollutant exposures and autism spectrum disorder in the children of Nurses’ Health Study II participants. Environ. Health Perspect. 121:978–984. doi: 10.1289/ehp.1206187.
- Roop, S.A., A.S. Niven, B.E. Calvin, J. Bader, and L.L. Zacher. 2007. The prevalence and impact of respiratory symptoms in asthmatics and nonasthmatics during deployment. Mil Med. 172:1264–1269. doi:10.7205/MILMED.172.12.1264
- Smith, B., C.A. Wong, T.C. Smith, E.J. Boyko, G.D. Gackstetter, and M.A.K. Ryan. 2009. Newly reported respiratory symptoms and conditions among military personnel deployed to Iraq and Afghanistan: A prospective population-based study. Am. J. Epidemiol. 170:1433–1442. doi: 10.1093/aje/kwp287.
- Szema, A.M., M.C. Peters, K.M. Weissinger, C.A Gagliano, and J.J. Chen. 2010. New-onset asthma among soldiers serving in Iraq and Afghanistan. Allergy & Asthma Proceedings. 31:67–71. doi: 10.2500/aap.2010.31.3383.
- Szema, A.M., W. Salihi, K. Savary, and J.J. Chen. 2011. Respiratory symptoms necessitating spirometry among soldiers with Iraq/Afghanistan war lung injury. JOEM. 53:961–965. doi: 10.1097/JOM.0b013e31822c9f05.
- U.S. Environmental Protection Agency. 2015. Particulate matter. http://www.epa.gov/airtrends/pm.html (accessed May 10, 2016).
- Waggoner, A.P., and R.E. Weiss. 1980. Preliminary communication: Comparison of fine particle mass concentration and light scattering extinction in ambient aerosol. Atmos. Environ. 14:623–62. doi: 10.1016/0004-6981(80)90098-0.
- World Health Organization. 2005. Air quality guidelines for particulate matter, ozone, nitrogen dioxide and sulfur dioxide. Global update 2005. http://apps.who.int/iris/bitstream/10665/69477/1/WHO_SDE_PHE_OEH_06.02_eng.pdf (accessed May 10, 2016).
- World Health Organization. 2014. Ambient (outdoor) air pollution in cities database. http://www.who.int/phe/health_topics/outdoorair/databases/cities/en/(accessed May 10, 2016).
- Yanosky J.D., C.J. Paciorek, J. Schwartz, F. Laden, R. Puett, and H.H. Suh. 2008. Spatio-temporal modeling of chronic PM10 exposure for the Nurses’ Health Study. Atmos. Environ. 42:4047–4062. doi: 10.1016/j.atmosenv.2008.01.044.