
ABSTRACT
This notebook paper provides a brief overview of attribution estimates for some key lung cancer risk factors, focusing on indoor radon gas exposure in the U.S., UK, and Canada. Tobacco smoking represents the primary cause of lung cancer worldwide. Radon is regarded as the second leading lung cancer risk factor in the U.S. and Canada. It can be observed, however, that the reported estimates appear not to add up to the maximum cumulative attribution of 100%.
Implications: Limitations and uncertainties associated with published epidemiological studies and the observed lack of consistency in lung cancer attribution estimates for radon and other non-smoking lung cancer risk factors should be taken into consideration by policy makers in setting population health protection priorities.
Introduction
Although there is epidemiological evidence for an association between exposure to indoor radon gas and lung cancer risk (Lubin and Boice, Citation1997; Darby et al., Citation2006; Zhang et al., Citation2012), the link between radon and lung cancer risk has been established mainly on the basis of available data from Uranium miners exposed to much higher levels of radon gas in occupational settings when compared to residential indoor radon exposure for the general public. The limitations of extrapolation from higher to lower radon exposure rates have been acknowledged in the National Academy of Sciences (NAS) report on health effects of exposure to indoor radon (Biological Effects of Ionizing Radiation (BEIR) VI Report; NAS, Citation1999). The U.S. Centers for Disease Control and Prevention (CDC) Agency for Toxic Substances and Disease Registry (ATSDR) also points out to the following uncertainties and limitations of the available residential case-control studies on indoor radon vs. lung cancer risk:
(1) uncertainty in estimating long-term radon levels from relatively few prospective and/or retrospective periodic measurements of radon levels in a particular location; (2) uncertainty in assumptions regarding radon levels in homes where measurements were not made, length of residence and history of prior residences; and (3) accuracy of reported data on confounding factors such as smoking history or active smoker in the home, or including different percentages of smokers in the control and exposed groups. (ATSDR, Citation2012, p. 21)
In their pooled analyses of data from 13 European case-control studies on radon in homes and risk of lung cancer, Darby et al. (Citation2005) found statistically significant positive associations among smokers, but not among lifelong nonsmokers (ATSDR, Citation2012; Darby et al., Citation2005).
The World Health Organization (WHO)–International Agency for Research on Cancer (IARC) has classified radon as carcinogenic to humans (Group 1) (IARC, Citation1998). Cancer Research UK and the WHO–IARC provide a list of about 40 recognized lung cancer risk factors (), including radon gas and its decay products (Cancer Research UK, Citation2014). According to the published literature, most of the reported lung cancer cases (about 86–90%) can be attributed to tobacco smoking, which is generally regarded as the leading cause of lung cancer (CDC, Citation2015; Cancer Research UK, Citation2014b). Radon is regarded as the second leading lung cancer risk factor in the United States (EPA, Citation2015) and Canada (National Collaborating Centre for Environmental Health [NCCEH], Citation2014).
Table 1. Lung cancer risk factors (Cancer Research UK, Citation2014).
Discussion
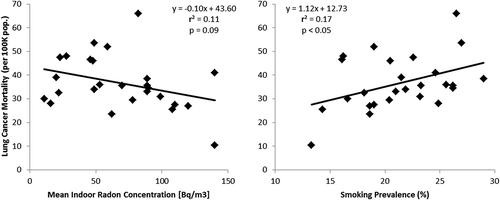
The Centers for Disease Control and Prevention (CDC) estimates that about 20,000 new lung cancer deaths or ~28,000 cases (annual lung cancer cases are approximately 40% higher than lung cancer deaths [American Cancer Society, Citation2015a]) may be attributed to radon gas exposure each year (CDC, Citation2016). When compared to the total of 221,200 new lung cancer cases reported by the American Cancer Society, for example, in 2015 (American Cancer Society, Citation2015a), this estimate translates into about 13% of lung cancer cases potentially attributable to indoor radon gas exposure in the United States each year. Health Canada indicates that “almost 90% of lung cancer deaths are caused by smoking” and that “radon exposure is linked to approximately 16% of lung cancer deaths in Canada” (i.e., smoking (90%) + radon (16%) + all other recognized lung cancer risk factors (x%) > 106%) (Health Canada, Citation2014). Cancer Research UK scientists, on the other hand, estimate an up to fivefold lower radon-attributed lung cancer percentage: “Exposure to radon accounts for only 3% of all UK cases of lung cancer” (Cancer Research UK, Citation2016). It is interesting that comparative estimates of radon-attributed lung cancer percentage in selected countries, as provided by the WHO (Citation2009), show an absence of statistically significant correlation with the mean indoor radon concentration ( and ). In addition, linear regression analyses of available data from 26 countries of the Organization for Economic Co-operation and Development (OECD), including the countries presented in , show a weak inverse (negative) correlation for age-standardized lung cancer mortality vs. mean indoor radon concentration compared to an expected statistically significant positive correlation with adult smoking prevalence (; data from WHO, Citation2009 and OECD, Citation2011).
Table 2. Estimates of the proportion of lung cancer attributable to radon vs. smoking in selected countries.
Figure 1. Linear regression of radon attributed lung cancer vs. arithmetic and geometric mean indoor radon concentration (data from ; WHO, Citation2009).
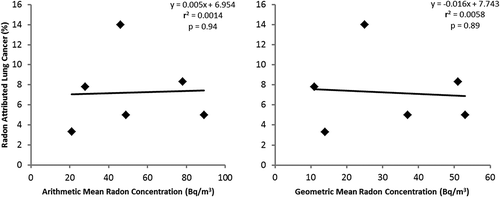
Figure 2. Linear regression of age-standardized lung cancer mortality vs. arithmetic mean indoor radon concentration and smoking prevalence in 26 OECD countries (data from WHO, Citation2009 and OECD, Citation2011).
Regarding other identified lung cancer risk factors, using the 2015 lung cancer data for the United States (American Cancer Society, Citation2015a), asbestos exposure may account for 2% (The Mesothelioma Center, Citation2015), arsenic for 2% (Putila and Guo, Citation2011), and environmental tobacco smoke (ETS) for about 3% new lung cancer cases each year (American Cancer Society, Citation2015b). Cancer Research UK indicates that “An estimated 7.8% of lung cancers each year in the UK are thought to be caused by PM2.5 air pollution exposure” (Cancer Research UK, Citation2016), and that “insufficient fruit and vegetables intake is linked to an estimated 9% of lung cancer cases in the UK” (Cancer Research UK, Citation2014b), which could be considered approximately applicable for the U.S. or Canadian population as well.
According to the projected estimates for the United States (American Cancer Society, Citation2015a), the reported percentages for radon (13%), inadequate diet (9%), PM2.5 (8%), ETS (3%), asbestos (2%), and arsenic (2%) account for a total of 37% lung cancer cases each year. This would leave only about 63% of cases for attribution to smoking and all other recognized lung cancer risk factors () (Cancer Research UK, Citation2014). The estimated percentage of lung cancer cases apparently exceeds a 10–14% balance of the expected cases not attributed to smoking and the maximum cumulative attribution of 100% (i.e., smoking [90%] + radon [13%] + inadequate diet [9%] + PM2.5 [8%] + ETS [3%] + arsenic [2%] + asbestos [2%] + all other recognized lung cancer risk factors [x%] > 127%).
The scientists from Cancer Research UK suggest that “An estimated 89% of lung cancers in the UK are linked to lifestyle factors including smoking, certain occupational exposures (13%), and ionising radiation (5%)” with a total of 107% (Cancer Research UK, Citation2014b). The diet, ETS, and arsenic could likely be accounted for in part under “lifestyle factors including smoking,” asbestos under “certain occupational exposures,” and indoor radon gas under “ionising radiation.” However, it remains unclear how to account for other recognized lung cancer risk factors, including a large proportion of 8% attributed specifically to PM2.5, which appears as the third leading lung cancer risk factor in the United Kingdom, with smoking in the first (86%) and inadequate diet in the second place (9%).
As opposed to the U.S. and Canadian estimates, it is interesting that indoor radon gas exposure in the United Kingdom holds approximately the fourth or fifth (not the second) position among the leading lung cancer risk factors at 3% (i.e., smoking [86%] + inadequate diet [9%] + PM2.5 [8%] + ETS [3%] + radon [3%] + arsenic [2%] + asbestos [2%] + all other recognized lung cancer risk factors [x%] > 113%). This is despite relatively similar levels of the mean indoor radon concentrations in the United Kingdom when compared to the United States and Canada (). Cancer Research UK also indicates that “Smoking is the main avoidable risk factor for lung cancer, linked to an estimated 86% of lung cancer cases in the UK” (Cancer Research UK, Citation2014b), which is similar to the 90% estimated by the CDC (Citation2015) and Health Canada (Citation2014), but the cumulative impact from all recognized lung cancer risk factors appears to exceed the maximum attribution of 100%. shows that the U.S. estimated number of deaths due to radon-induced lung cancer appear to exceed the number of available attribution deaths remaining after subtracting smoking-induced deaths from the total reported lung cancer deaths (i.e., 158,000 – 139,000 = 19,000, vs. 21,800 deaths attributed to radon exposure each year). This suggests that the percentages of lung cancer attributed to radon in the United States at 14% and Canada at up to 16% are probably overestimated.
On the basis of the WHO mortality data for the period 1968–2000, an estimated cumulative risk or probability of death from lung cancer by age 75 years in the United States is reported at ~6%, compared to the United Kingdom at ~5% (Brennan et al., Citation2006). The American Cancer Society provides a similar estimate: “Overall, the chance that a man will develop lung cancer in his lifetime is about 1 in 14; for a woman, the risk is about 1 in 17. These numbers include both smokers and non-smokers. For smokers the risk is much higher, while for non-smokers the risk is lower” (American Cancer Society, Citation2016). These probability estimates converted into percentage show that cumulative lifetime absolute risk of lung cancer for the U.S. population is in the range of ~5.9% (women) to ~7.1% (men). It should be noted that ~90% of this risk estimate can be attributed to smoking and the remaining ~10% to all nonsmoking risk factors, including a fraction attributed to indoor radon gas exposure (i.e., a fraction of 0.59% [1 in 170] or 0.71% [1 in 140] for women and men, respectively).
The WHO defines population-attributable fraction (PAF) for different causes of a disease as following:
The contribution of a risk factor to a disease or a death is quantified using the population attributable fraction (PAF). PAF is the proportional reduction in population disease or mortality that would occur if exposure to a risk factor were reduced to an alternative ideal exposure scenario (e.g., no tobacco use). Many diseases are caused by multiple risk factors, and individual risk factors may interact in their impact on overall risk of disease. As a result, PAFs for individual risk factors often overlap and add up to more than 100 percent. (WHO, Citation2016)
However, it may not be acceptable to have only 7 out of about 40 IARC-recognized PAFs for different causes of lung cancer (see ) add up to significantly above 100% (i.e., greater than 120% in the United States). It should be considered as not sufficient to simply acknowledge that individual risk factors “often overlap and add up to more than 100 percent.” More accurate attribution estimates should be provided. Alternatively, it should be acknowledged that currently available estimates are not accurate enough to be used by decision makers for reliable predictions of potential impacts of residential indoor radon exposure on population health.
Conclusion
Provided that the smoking-attributed lung cancer percentage in the range from 86 to 90% can be considered as reasonably accurate, all of the nonsmoking risk factors should then fit within a proportion of about 10% to 14% as estimated for the United States (or Canada) and the United Kingdom, respectively. However the reported numbers appear not to add up by a significant margin in any of the considered countries. This prompts the need to reevaluate the accounting of lung cancer attribution estimates for various behavioral, lifestyle, occupational, environmental, biological, and socioeconomic risk factors. It should be emphasized for the general public that smoking remains the primary preventable lung cancer risk factor. Interpretation of the estimates for radon-attributed lung cancer percentages should include consideration of impacts and potential confounding by other significant lung cancer risk factors, such as smoking, diet, environmental tobacco smoke, asbestos, or arsenic in drinking water.
Acknowledgment
The author thanks Greg Baytalan (Interior Health, Kelowna, BC, Canada) for his insightful review and constructive comments.
Additional information
Notes on contributors
Goran Krstić
Goran Krstić is a human health risk assessment specialist at Fraser Health Authority, which provides a wide range of integrated health care services to more than 1.6 million people living in communities stretching from Burnaby to White Rock to Hope in British Columbia, Canada.
Related Research Data
References
- Agency for Toxic Substances and Disease Registry. 2012. Toxicological profile for radon. U.S. Department of Health and Human Services (DHHS), Division of Toxicology and Human Health Sciences, Environmental Toxicology Branch, Atlanta, GA. http://www.atsdr.cdc.gov/toxprofiles/tp145.pdf (accessed September 6, 2016).
- American Cancer Society. 2015a. Cancer facts & figures 2015. Atlanta, GA. http://www.cancer.org/acs/groups/content/@editorial/documents/document/acspc-044552.pdf ( accessed March 21, 2016).
- American Cancer Society. 2015b. Why non-smokers sometimes get lung cancer. October 30. http://www.cancer.org/cancer/news/features/why-lung-cancer-strikes-nonsmokers ( accessed March 18, 2016).
- American Cancer Society. 2016. Key statistics for lung cancer. http://www.cancer.org/cancer/lungcancer-non-smallcell/detailedguide/non-small-cell-lung-cancer-key-statistics (accessed March 21, 2016).
- Brennan, P., A. Crispo, D. Zaridze, N. Szeszenia-Dabrowska, P. Rudnai, J. Lissowska, E. Fabiánová, D. Mates, V. Bencko, L. Foretova, et al. 2006. High cumulative risk of lung cancer death among smokers and nonsmokers in Central and Eastern Europe. Am. J. Epidemiol. 164(12):1233–41. doi:10.1093/aje/kwj340.
- Cancer Research UK. 2014. Lung cancer risk factors. http://www.cancerresearchuk.org/health-professional/cancer-statistics/statistics-by-cancer-type/lung-cancer/risk-factors (accessed March 18, 2016).
- Cancer Research UK. 2014b. Lung cancer statistics. http://www.cancerresearchuk.org/health-professional/lung-cancer-statistics (accessed March 18, 2016).
- Cancer Research UK. 2016. How air pollution can cause cancer. http://www.cancerresearchuk.org/about-cancer/causes-of-cancer/air-pollution-radon-and-cancer/how-air-pollution-can-cause-cancer (accessed March 21, 2016).
- Centers for Disease Control and Prevention. 2015. What are the risk factors for lung cancer? http://www.cdc.gov/cancer/lung/basic_info/risk_factors.htm (accessed March 18, 2016).
- Centers for Disease Control and Prevention. 2016. Radon and your health. http://www.cdc.gov/features/protect-home-radon (accessed March 21, 2016).
- Darby, S., D. Hill, A. Auvinen, J.M. Barros-Dios, H. Baysson, F. Bochicchio, H. Deo, R. Falk, F. Forastiere, M. Hakama, et al. 2005. Radon in homes and risk of lung cancer: Collaborative analysis of individual data from 13 European case-control studies. British Medical Journal. 330(7485):223. doi:10.1136/bmj.38308.477650.63.
- Darby, S., D. Hill, H. Deo, A. Auvinen, J.M. Barros-Dios, H. Baysson, F. Bochicchio, R. Falk, S. Farchi, A. Figueiras, et al. 2006. Residential radon and lung cancer: Detailed results of a collaborative analysis of individual data on 7148 persons with lung cancer and 14,208 persons without lung cancer from 13 epidemiologic studies in Europe. Scand. J. Work Environ. Health 32(1):1–83.
- Health Canada, 2014. Radon—Another reason to quit. http://www.hc-sc.gc.ca/ewh-semt/alt_formats/hecs-sesc/pdf/pubs/radiation/radon_smokers-fumeurs/radon_smokers-fumeurs-eng.pdf (accessed March 29, 2016).
- International Agency for Research on Cancer. 1998. Man-Made Mineral Fibres and Radon. IARC Monographs on the Evaluation of Carcinogenic Risks to Humans, Vol. 43. Lyon, France: World Health Organization (WHO), Lyon, France.
- Lubin, J.H., and J.D. Boice, Jr. 1997. Lung cancer risk from residential radon: Meta-analysis of eight epidemiologic studies. J. Natl. Cancer Inst. 89:49–57. doi: 10.1093/jnci/89.1.49
- National Academy of Sciences. 1999. Health Effects of Exposure to Indoor Radon. Biological Effects of Ionizing Radiation (BEIR) VI Report. Washington, DC: National Academy Press. http://www.nap.edu/catalog/5499/health-effects-of-exposure-to-radon-beir-vi (accessed September 6, 2016).
- National Collaborating Centre for Environmental Health. 2014. Radon. http://www.ncceh.ca/environmental-health-in-canada/health-agency-projects/radon (accessed March 31, 2016).
- Organization for Economic Cooperation and Development. 2011. Health at a Glance 2011: OECD Indicators. OECD Publishing. doi:10.1787/health_glance-2011-en
- Putila, J.J., and N.L. Guo. 2011. Association of arsenic exposure with lung cancer incidence rates in the United States. PLoS ONE 6(10):e25886. doi:10.1371/journal.pone.0025886.
- The Mesothelioma Center. 2015. Asbestos cancer facts and statistics. http://www.asbestos.com/cancer/facts.php (accessed March 18, 2016).
- Thun, M., R. Peto, J. Boreham, and A.D. Lopez. 2012. The tobacco epidemic today: Stages of the cigarette epidemic on entering its second century (Supplementary data). Tobacco Control 21:96–101. doi:10.1136/tobaccocontrol-2011-050294.
- U.S. Environmental Protection Agency. 2015. Health risk of radon. https://www.epa.gov/radon/health-risk-radon (accessed March 18, 2016).
- World Health Organization. 2009. WHO Handbook on Indoor Radon: A Public Health Perspective. Geneva, Switzerland: WHO.
- World Health Organization. 2016. Health statistics and information systems. Metrics: Population attributable fraction (PAF). http://www.who.int/healthinfo/global_burden_disease/metrics_paf/en ( accessed September 6, 2016).
- Zhang, Z. L., J. Sun, J.Y. Dong, H.-L. Tian, L. Xue, L.-Q. Qin, and J. Tong. 2012. Residential radon and lung cancer risk: An updated meta-analysis of case-control studies. Asian Pacific J. Cancer Prev. 13:2459–65. doi:10.7314/APJCP.2012.13.6.2459.