
ABSTRACT
Assessments of past environmental policies—termed accountability studies—contribute important information to the decision-making process used to review the efficacy of past policies, and subsequently aid in the development of effective new policies. These studies have used a variety of methods that have achieved varying levels of success at linking improvements in air quality and/or health to regulations. The Health Effects Institute defines the air pollution accountability framework as a chain of events that includes the regulation of interest, air quality, exposure/dose, and health outcomes, and suggests that accountability research should address impacts for each of these linkages. Early accountability studies investigated short-term, local regulatory actions (for example, coal use banned city-wide on a specific date or traffic pattern changes made for Olympic Games). Recent studies assessed regulations implemented over longer time and larger spatial scales. Studies on broader scales require accountability research methods that account for effects of confounding factors that increase over time and space. Improved estimates of appropriate baseline levels (sometimes termed “counterfactual”—the expected state in a scenario without an intervention) that account for confounders and uncertainties at each link in the accountability chain will help estimate causality with greater certainty. In the direct accountability framework, researchers link outcomes with regulations using statistical methods that bypass the link-by-link approach of classical accountability. Direct accountability results and methods complement the classical approach. New studies should take advantage of advanced planning for accountability studies, new data sources (such as satellite measurements), and new statistical methods. Evaluation of new methods and data sources is necessary to improve investigations of long-term regulations, and associated uncertainty should be accounted for at each link to provide a confidence estimate of air quality regulation effectiveness. The final step in any accountability is the comparison of results with the proposed benefits of an air quality policy.
Implications: The field of air pollution accountability continues to grow in importance to a number of stakeholders. Two frameworks, the classical accountability chain and direct accountability, have been used to estimate impacts of regulatory actions, and both require careful attention to confounders and uncertainties. Researchers should continue to develop and evaluate both methods as they investigate current and future air pollution regulations.
Introduction
Air pollution accountability is a growing field that seeks to assess the effectiveness of regulatory actions, with governments and stakeholders that must control their emissions taking particular interest in the outcomes of such studies (Health Effects Institute, Citation2003). Early work in the field focused on air pollution and health impacts of local regulatory or nonregulatory actions (such as a major local air pollution source shutting down, e.g., due to economic factors). In the last decade, the methods have expanded to include long-term assessments of multiple control programs implemented over large spatial domains.
The accountability chain
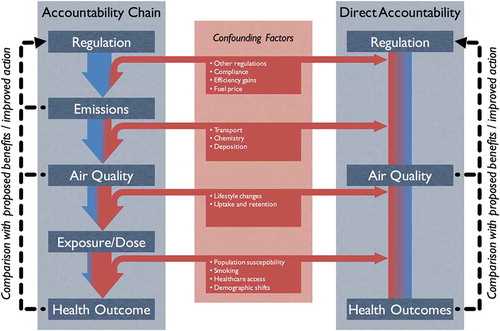
The later decades of the 20th century saw major reductions in ambient air pollution concentrations in developed nations as governments enacted regulatory actions to curb emissions and subsequently protect human and environmental health (Hubbell et al., Citation2009; National Research Council, Citation2004). These three elements—regulations, emissions, and health—represent the three of the five links in the accountability chain (air quality and exposure are the others; , left side), which tracks the effects of an air quality regulation from promulgation to final impacts on public health (Health Effects Institute, Citation2003). The goal of accountability research is to assess environmental policies by attributing causality (or lack thereof) of changes to links in the accountability chain to a regulatory action, and a successful accountability study should address each link in the chain between the regulatory action and the end point of interest (Health Effects Institute, Citation2003). At the conclusion of the analysis, study results should be compared with estimates of the proposed benefits of the regulations to air policy makers in decisions regarding future regulations. The majority of studies completed to present define either air pollution concentrations or health outcomes as the end point of interest, whereas a few also assess economic impacts. Numerous studies have been published in this domain since the Health Effects Institute’s (HEI) Citation2003 report (e.g., Dockery et al., Citation2013; Kelly et al., Citation2011; Morgenstern et al., Citation2012; Peel et al., Citation2010; Peters et al., Citation2009; Wong et al., Citation2012).
Figure 1. Classic accountability chain (left) and direct accountability framework (right). Confounding factors (red portion of the arrows) increasingly obscure the observable signals attributable to regulations (blue portion) between the links in the accountability chain. Further down the chain, the observed response is impacted only partially by regulations. Direct accountability studies seek to directly link regulatory actions to changes in air quality and/or health outcomes. Classic and direct accountability studies strive to take into account as many confounders as practical, although they use different methods to do so. At multiple points in both frameworks, the opportunity exists to compare with each regulation’s proposed benefits and update the approach in new regulatory actions.
Defining causal relationships between any one of the links presents a difficult challenge, and assessing each link in the chain is even more arduous (Bell et al., Citation2011). Often, studies link changes in the outcome of interest to regulatory actions by making assumptions about the intermediate links in the accountability chain. Most studies identify a regulatory action, then use statistical or deterministic modeling of multiple other links in the chain to associate emissions with air quality and/or air quality with one or more health outcomes (e.g., Clancy et al., Citation2002; Hou et al., Citation2010; Kelly et al., Citation2011; Morgenstern et al., Citation2012; U.S. Environmental Protection Agency [EPA], Citation2011, Citation1999a; Zigler et al., Citation2012).
The Health Effects Institute (Citation2003) noted that a successful accountability study should address effects of regulatory actions on outcomes at each link in the accountability chain. Confounders at each link cloud the signal, and these factors compound through the length of the chain, increasingly obscuring the signal from the regulation at each link (). Further, confounding variables and changes due to a regulatory action may not be wholly independent. For example, electric utilities use a complex decision-making process when determining whether to retrofit or shutter old plants and/or build new ones. Inputs to these decisions include regulations, projected population changes and fuel costs, and geographic constraints, and can include stakeholder review and public oversight (National Research Council, Citation2004). This multitude of variables that affects these decisions makes it impossible to attribute some changes in emissions wholly to specific regulations.
Given the issues involved in approaching accountability link by link, Zigler and Dominici (Citation2014) suggest that direct accountability (discussed in more detail below) as an attractive, supplementary framework. In short, direct accountability uses statistical methods to determine whether an intervention caused in the outcome of interest (typically changes in air quality or health outcomes), and is less focused on potential impacts of regulations on each link in the accountability chain. Both the classic and direct frameworks are subject to confounding factors (). The classic accountability approach takes a more mechanistic approach by establishing relationships links in the chain—between, for example, emissions–air quality relationships and dose-response curves—and applying these relationships to hypothetical counterfactual scenarios. Direct accountability methods approach the problem from a potential-outcomes perspective. These studies define an experiment with an “intervention condition” and a “control condition” such that, assuming a population were randomly assigned between these conditions, the difference in the outcome of interest (usually either air quality or health outcomes) is interpreted as the causal effect of the intervention.
Regulations
The first step in the accountability chain is the adoption of a policy and the ensuing regulations or related interventions. The regulation may or may not call for specific changes in emissions and is, itself, subject to varying levels of success; for example, the degree to which the regulation leads to actions that could result in emission changes. For example, an area being found to be in nonattainment of the National Ambient Air Quality Standards in the United States does not lead directly to a set of specific emission controls—each state that contains a nonattainment area submits a State Implementation Plan (SIP) that details the actions it will take to reduce pollution levels (National Research Council, Citation2004; Zigler et al., Citation2016). These actions could include a regulation that specifies legal emission amount and/or controls on a facility. One example of this type of policy in the state of Georgia, the Multipollutant Control Rule, lists specific control technologies for each unit of electric generating units in the Atlanta area, which was in nonattainment for both ozone (O3) and particulate matter with a diameter less than or equal to 2.5 µm (PM2.5) when the rule was promulgated in 2008 (Georgia Environmental Protection Division, Citation2013). Regulations may also lead to or be associated with unintended consequences, such as increased vehicle traffic carrying visitors to the Shanghai World Expo that partially counteracted the effects of temporary restrictions on industrial activity implemented to improve air quality during this event (Hao et al., Citation2011) and China’s policy of providing coal for heating homes and offices north of the Huai River (Chen et al., Citation2013).
Emissions
Emissions of air pollutants are affected by multiple factors at a range of time scales from decadal to less than daily, including climate, population growth/decline, changes in the economy (including economic effects of air quality emissions, costs to operate in different areas, and fuel prices), regulatory actions, industry compliance rates, meteorology, weekly demand, and work travel patterns. Because of these factors and the general difficulty and expense of measuring emissions, typically only large sources, such as power plant stacks, are directly measured. Emissions from other sources (e.g., automobiles) are estimated as the sum of multiple smaller or individual sources. It is not yet practical to measure emissions from all of the cars all of the time, so the total fleet emissions are modeled, which introduces uncertainties (EPA, Citation2011). Uncertainties in data used by those models include emission factors and activities, and studies have identified major biases in emission estimates. For example, in the 1980s, the Southern California Air Quality Study (SCAQS) tunnel studies identified that volatile organic compound (VOC) and carbon monoxide (CO) emissions were much higher than estimated (Lawson, Citation1990; Pierson et al., Citation1990), and that a small number of vehicles emitted a high percentage of total mobile emissions (these vehicles were termed “super-emitters”) (Lawson et al., Citation1990). Current ambient ground- and satellite-based observations studies have found a disagreement of up to a factor of 2 in emission modeling (Anderson et al., Citation2014; Goldberg et al., Citation2016; Souri et al., Citation2016).
The lack of direct measurements makes it challenging to assess how emissions are changing, much less how they are responding to specific regulations. Further, in developed and developing countries alike, emission sources are regulated under a number of statutes implemented at various times and applied over various spatial scales (Health Effects Institute, Citation2003). Such complexities are likely to increase as interest grows in a multimedia approach to environmental issues (Klausbruckner et al., Citation2016; Murray, Citation2013).
Even for sources whose emissions are well characterized, it can be difficult to assess the impacts of regulations. For example, if a regulation would lead to costly controls or plant retrofits, a utility may decide to shutter a plant before they otherwise would “move” emissions, such as by increasing activities in one location and decreasing activities in another, or, in order to avoid New Source Review requirements, keep older plants online (National Research Council, Citation2004). Other external factors can play a role, such as economic activity that drives reduction in demand during recessions (Chay and Greenstone, Citation2003) or changing fuel costs, which may or may not be directly linked to regulatory actions (National Research Council, Citation2004). Quantifying the actual impacts becomes more uncertain as the length of time assessed grows.
Studies have employed various techniques for addressing each of these challenges in order to attribute changes in emissions to specific interventions. For example, estimates of how mobile emissions have changed in response to regulations come from studies on a limited number of vehicles, changes in emission factors and ambient observations (e.g., in tunnels), and emission models (McDonald et al., Citation2013; National Research Council, Citation2004). In studies on interventions that occurred over short time periods, for instance, long-term trends in emissions are typically ignored, and baseline emissions are taken as the period before (or after, in the case of interventions that expire) the intervention (Friedman et al., Citation2001; Hou et al., Citation2010; Peel et al., Citation2010). Studies on long-term interventions typically either assess changing emissions over time (e.g., Butler et al., Citation2011; Gégo et al., Citation2007; Godowitch et al., Citation2010) or model an estimate of counterfactual—i.e., what would have happened had there not been an intervention—by assuming a constant emission rate from a baseline year throughout the study period (e.g., Daskalakis et al., Citation2016; Gégo et al., Citation2008; Morgenstern et al., Citation2012).
Air quality
The impacts of regulations and emissions on air quality have been well studied using both empirical (Blanchard et al., Citation2012; Butler et al., Citation2011; Harrington et al., Citation2012; Pierce et al., Citation2010; Zigler et al., Citation2012) and nonempirical (i.e., deterministic; e.g., Daskalakis et al., Citation2016; Simon et al., Citation2015; Wang et al., Citation2014) air quality modeling approaches, each of which has strengths and limitations. Empirical air quality models directly use air quality observations that are presumed to have relatively small uncertainties for air quality near the monitor compared with, for example, deterministic models (Friberg et al., Citation2016). Statistical techniques provide both emission changes—air quality associations and uncertainty estimates. However, statistical linkages to emission changes or the underlying interventions are subject to confounding factors and require a number of modeling assumptions. If not all factors are correctly accounted for and assumptions justified in the approach, the associations will be flawed (Chang et al., Citation2014a; Harrington et al., Citation2012; Zigler et al., Citation2012). Deterministic air quality models include state-of-the-science characterizations of atmospheric processes, but are subject to uncertainties in model inputs and parameterizations, numerical errors, and are often more time- and computationally intensive than empirical approaches (Napelenok et al., Citation2011; Simon et al., Citation2012; Wyat Appel et al., Citation2008).
Two empirically based approaches commonly used for evaluating the impacts of regulations on air quality are before/after or more polluted/less polluted location comparisons and time-series analyses (including source apportionment). Before/after comparisons highlight the change over time, but are particularly susceptible to confounding, as long-term changes in multiple factors (e.g., population, emissions, or climate) can significantly impact results.
Time-series analysis involves relating changes in meteorology and/or emissions to ambient measurements. Methods that link only meteorological variability (not emissions) to ambient concentrations are focused on detrending air pollution in order to assess long-term trends without added interference of meteorology (Camalier et al., Citation2007; Cox and Chu, Citation1993; Flaum et al., Citation1996; Gégo et al., Citation2007; Henneman et al., Citation2015; Kuebler et al., Citation2001; Milanchus et al., Citation1998; Rao et al., Citation1995). Other methods seek to directly relate changes in measured concentrations with regulatory actions (Zigler et al., Citation2012), emission changes (Butler et al., Citation2011; Harrington et al., Citation2012), or fuel consumption (Russell et al., Citation2016). Such methods can be used with counterfactual emission estimates to model potential outcomes that assume no regulations. Source apportionment (the attribution of observed concentrations to specific sources) remains an active area of research (Blanchard et al., Citation2012; Hopke, Citation2016; Hu et al., Citation2014; Yuan et al., Citation2013). Empirical accountability studies typically define a baseline period of air quality during the time periods before and after an intervention (e.g., Clancy et al., Citation2002; Friedman et al., Citation2001; Peters et al., Citation1996), or, alternatively, in the location of the intervention versus a control region (e.g., Lin et al., 2012; Peel et al., Citation2010; Wong et al., Citation1998), and quantify resulting changes. Zigler and Dominici (Citation2014) point out potential issues with the classical approach, including the fact that it relies on extrapolating associative relationships and counterfactual scenarios that cannot be evaluated using measurements.
Deterministic air quality models directly estimate the impacts of emission changes on changes in air quality. Such models make it possible to distinguish the effects of multiple regulations happening simultaneously through the estimation of emission-concentration sensitivities (Napelenok et al., Citation2011; Simon et al., Citation2013). These models have been used to estimate counterfactual concentrations (Daskalakis et al., Citation2016; Gégo et al., Citation2008; Godowitch et al., Citation2010; Wang et al., Citation2014) and are primary tools used to assess proposed regulations (e.g., EPA, Citation2005a, Citation2005b, Citation1997a) and demonstrate future attainment with air quality standards as part of SIPs (National Research Council, Citation2004).
Exposure/dose
Challenges that arise in estimating exposure (and the subsequent health effects) to air pollution in accountability research are similar to those in other air pollution epidemiological research (Cox and Popken, Citation2015). Historically, scientists estimate exposure using air quality at a central monitor (or a group of monitors) to approximate exposure for all cases in the sample population, although recent studies have used results from combined multiple models, satellite data, and land use regressions (Chang et al., Citation2014b; de Hoogh et al., Citation2014; Lee et al., Citation2015; Lim et al., Citation2013; Pachon et al., Citation2012; Wang et al., Citation2015). To date, not all of these methods have been tailored to accountability research questions. For daily statistical time-series models, researchers often include multiple lag terms or averaging periods to assess various relationships between health outcomes and measured concentrations. A few studies use population-weighted concentration (Hou et al., Citation2010) and personal exposure monitoring (Wu et al., Citation2010). Some studies opt to not assess exposure and instead apply statistical techniques that test for a change in health outcomes rates over the predefined time period of the intervention (Greenstone, Citation2004; Pegues et al., Citation2012; Zigler et al., Citation2016). Specific issues in relating air quality changes to exposures when conducting accountability studies include diagnosing both model uncertainty and parameter uncertainty in model selection (Morgenstern et al., Citation2012), missing data (Bell et al., Citation2011; Van Erp et al., Citation2011), and estimating baseline exposure for the no-control case that accounts for appropriate confounders (Health Effects Institute, Citation2003).
Health effects
Increased air pollution has been linked to negative health outcomes in numerous studies (Dockery et al., Citation1993; Garcia et al., Citation2011; Laden et al., Citation2006; Lim et al., Citation2013; S. Lin et al., Citation2013). Outcomes of greatest interest include morbidity and mortality associated with respiratory symptoms and cardiovascular disease (CVD) (Bell et al., Citation2011). Acute asthma events, heart rate variability (Wu et al., Citation2010), birth weight (Rich et al., Citation2015), and bronchial hyperreactivity (Wong et al., Citation1998) have been used as well. Most studies relate time periods of regulatory actions or changes in emissions to the health outcome of interest while controlling for environmental or population-related confounders, including meteorology, time trends, location, and age. Researchers then apply these models to a baseline pollution level (either from before/after the intervention of interest or a counterfactual) to estimate the relative risk of the response of interest to the regulatory action. Some extend this to estimate the number of outcomes avoided due the regulation being adopted.
Zigler and Dominici (Citation2014) argued that many studies (particularly those that compare periods before and after a regulatory action) do not account for all of the factors that may impact a changing health response and fail to address the uncertainties in the results relating to such an assumptions. Cox (Citation2013) discussed appropriate statistical methods for determining causality independent of a researcher’s personal biases, such as Granger causality, conditional independence, and counterfactual causality tests.
Scope of this review
This review assimilates work to date in the emerging field of accountability research. The studies are limited to those that assess air quality regulations in terms of at least one of the links in the accountability chain, and the focus is on studies that assess past regulatory action—as opposed to work that projects the effects of future regulations—or related events, such as a recession. A previous review (Bell et al., Citation2011) discussed publications focused specifically on the health end point. The current review extends their analysis by summarizing work that assesses other steps in the accountability chain, adding studies that have been published since 2011, and discussing future directions and challenges of accountability research.
In the next section, “Accountability Study Approaches,” we present popular approaches taken by previous studies to investigate regulatory impacts on links in the accountability chain. Studies are grouped based on their end point of interest; for example, some studies are interested only in the regulatory impact on air quality, whereas others are interested in the impact on health effects. The following section, “Accountability Case Studies,” reviews specific regulatory actions and the related works. The focus here is on discussing the ability of research methods to control for confounding factors. The next section reviews previous commentaries on accountability studies. In the final two sections, we highlight challenges and future directions in accountability research, and conclude by summarizing the work and commenting on which aspects of accountability research deserve the most attention moving forward.
Accountability study approaches
Most accountability studies choose as an end point one of the links in the accountability chain: emissions, air quality, or health outcomes, although some address each step ( and ). Studies in the list were chosen based on a desire to include work from multiple authors on several major accountability case studies. The list is extensive, but not exhaustive, and the focus is on studies that assess past regulatory actions aimed at improving air quality.
Table 1. Accountability studies with emission and air quality end points.
Table 2. Accountability studies with health end points.
The end points of interest (i.e., emissions, air quality, or health outcomes) listed in and are associated with the depth of analysis at each link in the accountability chain. Columns in and describe the types of analysis at each of the links in the accountability chain for each study. Although health and air quality are the most common end points assessed (indeed, each of the studies that assessed health as an end point made an attempt to characterize the change in air quality associated with the regulatory action of interest), a few studies focused on the effectiveness of regulatory actions at reducing emissions. Implementation time scales investigated by the studies in this review fall into two categories: those implemented over a relatively short-term time frame (i.e., associated with hosting special events, such as the Olympics) and those implemented gradually over a long time scales (on the order of years) ( and ). The studies focused on varied geographical scales, from single cities to global.
The following subsections describe the approach of studies that define each of the three end points, and precede examples of specific case studies.
Emission end point studies
In the United States, multiple studies have assessed the impacts of new regulations and a changing fleet on mobile emissions and have found significant reductions in emissions of multiple pollutants since the 1990s (Ban-Weiss et al., Citation2008; Dallmann and Harley, Citation2010; Harley, Citation2014; Kean et al., Citation2009; Kuwayama et al., Citation2013; McDonald et al., Citation2013, Citation2012). The National Emissions Inventory (NEI), assembled by the EPA every 3 yr, is one example of an emission end point study (https://www.epa.gov/air-emissions-inventories/national-emissions-inventory). The NEI seeks to quantify emissions from all sources of criteria air pollutants, criteria pollutant precursors, and hazardous air pollutants. Development of the NEI has employed a variety of methods (primarily bottom-up emission inventories) depending on the source to assimilate emission estimates and depends on data from each of the states. An example of bottom-up emission estimates is large point sources, which are required to measure their stack emissions and report these to the EPA (EPA, Citation2016). A source of confounding in NEI releases over the years is the EPA’s changing methods for quantifying emissions from varying source types. EPA has updated the models it uses for most major emissions sources over the years it has compiled the NEI (EPA, Citation2015a).
One type of top-down emission estimate is using satellite measurements of column concentrations of air pollutants. Prior to analysis, the raw data from satellites must be processed by models and algorithms that make numerous assumptions, such as the shape of the pollutant’s vertical profile and the relationship between the actual measurement to the pollutant of interest (Streets et al., Citation2013). Satellite data have the benefits of being available with relatively small time lag than other emission assimilating techniques and covering a wide spatial scale. Limitations include measurement drift, interference from clouds and surfaces with high albedo, and temporal coverage, which depends on each satellite’s orbit. Streets et al. (Citation2013) review multiple studies that have used satellite measurements to track changes in emissions at various spatial and temporal scales (Lamsal et al., Citation2011; Lin et al., Citation2010; van der A et al., Citation2016). Lamsal et al. (2010) compare satellite inventories with bottom-up inventories from different world regions and finds an agreement of 6.0% globally between the two (where 6.0% represents the difference between satellite and bottom-up inventories divided by the bottom-up inventory).
The majority of emission end point accountability studies compare emissions before/during/after an intervention. Studies that assess regulations implemented over many years (e.g., the 1990 Clean Air Act Amendments—CAAA) must account for long-term trends in addition to those impacted by controls, such as trends in fuel use, miles traveled, economic expansions and recessions, etc. Accountability studies focused on events that occur on short time scales (e.g., policies for the Atlanta and Beijing Olympics, which lasted a few weeks) tend to ignore long-term emission trends (Kuwayama et al., Citation2013; Li et al., Citation2010). This may be an appropriate assumption for studies of interventions that last only a few weeks, but studies that use long time periods before and after short-term interventions (such as the Dublin coal ban [Clancy et al., Citation2002; Goodman et al., Citation2009] and the Hong Kong sulfur ban) should take long-term trends into account.
Other investigators have used measurements at high temporal resolution to estimate changes in emission factors in real-world driving situations (Ban-Weiss et al., Citation2008; Kean et al., Citation2009; Kuwayama et al., Citation2013). Estimates have been made both for fleet averages (Ban-Weiss et al., Citation2008; Kean et al., Citation2009) and specific vehicles matched by registration number (Harley, Citation2014). Alternatively, researchers have applied source apportionment techniques to ambient measurements to estimate emission changes (Huang et al., Citation2012; Kuwayama et al., Citation2013; B. Wang et al., Citation2010). In China, Schreifels et al. (Citation2012) compared sulfur dioxide (SO2) emission reductions under different periods of environmental policies (Five-Year Plans) and found a 28% increase in emissions during the 10th Five-Year Plan (2001–2005) and a 14% decrease during the 11th Five-Year Plan (2006–2010). The government’s goals were 10% reductions in both of the periods.
For emission estimates made using source-specific emission factors and activity level, it is straightforward to estimate a counterfactual realization of emissions that assumes no added controls under the regulation of emissions and the same activity level, although uncertainties in emission factors and activity levels carry through the calculation. This approach is taken in a number of studies that focus on the air pollution end point (Daskalakis et al., Citation2016; Gégo et al., Citation2008; Morgenstern et al., Citation2012). This approach may, however, ignore concurrent changes or feedback loops, such as changes in fuel prices (e.g., the low natural gas prices seen in the United States in the past decade) and increased/reduced demand due to population shifts related to air quality policies.
Air pollution end point studies
A second group of studies focus on the impacts of emission regulations on air quality. Researchers place as a high priority the comparison of the magnitudes of effects of changing meteorology versus changing emissions on measured or modeled concentrations, and studies with this end point usually assess long-term interventions. Two main approaches are used to address the linkage between emissions and air quality: empirical approaches, including statistical modeling, often with meteorological detrending (Butler et al., Citation2011; Camalier et al., Citation2007; Gégo et al., Citation2007; Henneman et al., Citationin review, Citation2015; Kuebler et al., Citation2001; Liu et al., Citation2012; Rao and Zurbenko, Citation1994) and chemical transport–modeled dynamic analysis (Colette et al., Citation2011; Gégo et al., Citation2008; Godowitch et al., Citation2010, Citation2008; Xing et al., Citation2011). A third approach tests directly whether designations of nonattainment, which required further actions by local governments, has led to the area achieving its goals of improved air quality (Greenstone, Citation2004; Pegues et al., Citation2012; Zigler et al., Citation2016).
Empirical assessments of how the atmosphere responds to controls typically rely on developing statistical relationships of long-term ambient observations with emissions. These relationships, however, are confounded by meteorological variations, particularly in shorter-term studies. Identifying atmospheric responses over shorter periods—e.g., less than multiple years—can be difficult, and over periods of less than 1 yr, meteorological variations dominate (Camalier et al., Citation2007; Rao and Zurbenko, Citation1994). Two events and associated accountability studies (described in more detail below) that note the difficulty in accounting for meteorological variability are the Atlanta Olympics Studies (Friedman et al., Citation2001; Peel et al., Citation2010) and the Shanghai World Expo (Y. Lin et al., Citation2013).
Air quality models provide a second, complementary approach to link emissions to air quality changes. These models directly provide emissions–air quality relationships by describing and following emissions, transport, transformation, and fate in the atmosphere. They are, however, subject to uncertainties in inputs and model parameterizations (Napelenok et al., Citation2011). In dynamic analysis, researchers model two (or more) time periods and assess the ability of the model to capture observed trends across the time span of interest, with a particular interest in controlling for meteorological variability (Colette et al., Citation2011; Gégo et al., Citation2008; Godowitch et al., Citation2010, Citation2008; Kang et al., Citation2013; Napelenok et al., Citation2011; Pierce et al., Citation2010; Xing et al., Citation2011). Some studies then repeat the modeling over the same domain with switched meteorological and emission fields (Foley et al., Citation2015a, Citation2015b; Godowitch et al., Citation2008). The differences in modeled concentrations between model runs with the same meteorological inputs and different emissions represent the change attributable to emissions, and the differences between runs with different meteorology and the same emissions are attributable to meteorological changes.
Other air pollution studies seek to link changes in air quality with changes in emissions using statistical modeling techniques. These range from linear models (Harrington et al., Citation2012; Henneman et al., Citationin review) to principal components analysis (PCA)-related and other source apportionment techniques (Balachandran et al., Citation2012; Blanchard et al., Citation2012; Hopke, Citation2016). Each source apportionment technique carries with it uncertainties, and there have been recent efforts in this domain to combine results from multiple methods (Balachandran et al., Citation2012; Hopke, Citation2016).
In general, studies focused on estimating the change in air pollution due to emission changes exert more effort explicitly accounting for differing meteorological conditions, whereas those focused on health do not when assessing changing air quality, although most health studies do account for meteorology in their health models. By more fully accounting for regional meteorological patterns around the time of the 1996 Olympics in Atlanta, Peel et al. (Citation2010) were unable to associate improved air quality with emission reductions, a link that was found earlier by Friedman et al. (Citation2001). The approach used here (i.e., performing similar analyses on the location of interest and control areas not impacted by controls) has been used in a number of accountability studies (e.g., Chen et al., Citation2013; Kelly et al., Citation2011; Peel et al., Citation2010).
Health end point studies
Health outcome studies attempt to answer the question “what change in outcome response (if any) can be associated with the intervention of interest?” Such studies begin with an assessment of the intervention, which usually involves a comparison of air quality and health outcomes before and after the intervention using descriptive statistics (e.g., Dockery et al., Citation2013; Peters et al., Citation1996). Some studies couple this with a discussion of the meteorological conditions before, during, and after the intervention. Most employ a regression analysis to link changes in a measure of public health (e.g., morbidity or mortality) to changes in air quality, either by estimating outcome rates before/after an intervention or using direct associations of the outcome with a measure of air quality. Studies that seek to estimate the direct response of the health outcome to air pollution include a measure of the exposure of air pollution (e.g., annual average, multiple day lag, etc.) (e.g., Laden et al., Citation2006; Lee et al., Citation2007; Peters et al., Citation2009; Pope et al., Citation2009; Wu et al., Citation2010). Other studies do not estimate air pollution exposure using, for instance, a regression linking concentration metrics with the health outcome of interest. Instead, these studies—termed direct by Zigler and Dominci (Citation2014)—either use factor variables to address changing conditions before and after the intervention or train different models for different time periods (e.g., Clancy et al., Citation2002; Peel et al., Citation2010). Regression analyses include many independent variables to reduce effects from confounding factors () that are chosen based on the data available, researchers’ initial understanding of the problem, and the model selection process, which usually involves removing covariates with high standard errors one by one (Pope et al., Citation2012). Results are reported in the form of change in health response rates, excess risk from air pollution attributable to the intervention, or health response attributable directly to the intervention.
Many accountability studies that assess health impacts do not fully address the relationships between regulations, emissions, air quality, and dose, a recommendation made by the HEI (Health Effects Institute, Citation2003). Often (particularly in short-term studies), the baseline scenario is taken as the time before the intervention, an assumption that fails to address changes in confounding variables that may occur simultaneously with the intervention (Zigler and Dominici, Citation2014). In long-term studies, confounders that impact health and are correlated with changing air pollution concentrations (such as access to health care) make finding statistical associations between life expectancy and air pollution policies difficult (Wong et al., Citation2012). Further, health studies generally use meteorological metrics to control health response models, but do not assess air pollution changes while controlling for meteorology in locations surrounding the study area. Many studies of short-term interventions do not investigate concurrent changes in emissions from sources not related to the intervention of interest.
Multiple studies in the accountability field have found it difficult to attribute significant improvements in air quality or public health attributable to air quality regulations (Cox and Popken, Citation2015; Dockery et al., Citation2013; Kelly et al., Citation2011; Peel et al., Citation2010; Wong et al., Citation2012; Zigler et al., Citation2016). This difficulty, particularly prevalent in studies that diligently control for multiple confounders across domains (location, time, etc.), highlights the challenge of identifying a signal through either the accountability chain or direct frameworks with enough strength to attribute causality.
Recent research has discussed the issues with confounding in statistical models (e.g., from factors listed in ) and scientist biases that arise when linking health outcomes with air pollution concentrations and estimating a counterfactual (Pope et al., Citation2012; Cox and Popken, Citation2015). In a series of publications, Zigler and colleagues discussed the issues surrounding the ability to attribute causality of improvements in air quality or health outcomes to regulatory actions (Zigler and Dominici, Citation2016, Citation2014; Zigler et al., Citation2016, Citation2012). Zigler and Dominici (Citation2016) argue that the typical approach, which uses models that associate observed concentrations with health outcomes, is appropriate for the question “What is the relationship between exposure to pollution and health outcomes?” They state that this question provides valuable evidence for predicting the impacts of policies indirectly, but posit a different question, “What is the relationship between a specific regulation and health?” to better serve the goal of accountability research. They suggest that newer methods addressing this question should complement older methods, since both are subject to similar sources of confounding.
Zigler and Dominici (Citation2016) and Cox and Popken (Citation2015) apply more advanced statistical tests and methods that go further to assess the causality (instead of the correlation) of air pollution outcomes. Cox and Popken (Citation2015) suggest using such methods as conditional independence and Granger causality tests, which are statistical methods that better account for alternative explanations for correlations between, for example, air pollution and health. Zigler and Dominici (Citation2016) use two statistical methods—principal stratification and causal mediation analysis—to test for causal linkages between long-term air pollution interventions, air quality, and public health.
Comparison with pre-regulation impact assessments
The EPA publishes detailed analyses of the anticipated benefits of a regulation before it is promulgated in regulatory impact assessments (RIAs) (e.g., EPA, Citation1997a, Citation1999b, Citation2005a, Citation2005b). For air quality regulations, RIAs estimate effects of the regulation on emissions, air quality, and human/ecosystem health. Further, the EPA estimates an expected cost of the regulation based on the controls or other changes needed to meet emission targets.
The 2003 HEI report recommends using outcomes assessed in RIAs as starting points for accountability assessments in order to evaluate the conclusions of the RIA. Harrington et al. (Citation2012) compared the results of their accountability assessment of the Clean Air Interstate Rule (CAIR) with projected impacts reported in the RIA from the same rule (EPA, Citation2005b). They note that direct comparison is difficult due to differences in the methods used and context of the two studies. The authors compare both the final results (changes in PM2.5 concentrations in the eastern United States attributable to the 1990 Clean Air Act Amendments) and the sensitivities of PM2.5 to utility emissions. They find that their post-intervention estimates of air quality changes generally align. Given the current trend of assessing the accountability of longer-term regulatory actions (many of which were accompanied by an RIA), the comparison of accountability analyses with impact estimates prior to the regulation is an important step to assess and improve the regulatory process.
Accountability case studies
This section reviews policy and intervention scenarios that have attracted interest in accountability research. Many of these have been investigated multiple times, some with updated methods each time and some with updated data (e.g., emissions, air pollution measurements, or health outcome data). The interventions are discussed chronologically.
1986–1987 Utah Valley steel mill closing
The Geneva steel mill, a major source of air pollution in Utah Valley, closed for a period of 1 yr spanning 1986–1987 due to a labor dispute (Pope, Citation1989). Although the closing was not due to a regulation, the analysis conducted on the resulting health impacts is of interest in accountability studies, as similar methods may be used to assess potential health impacts resulting from regulations leading to emission changes. Pope related ambient measurements of PM with a diameter less than or equal to 10 µm (PM10) and respiratory-related hospital admission using a multiple regression model. They used hospital admissions outside the county as a control, and further controlled for temperature cofounders. The researchers observed nearly doubled PM10 concentrations in the valley when the mill was open compared with when it was closed, and found associations between multiple health outcomes and PM10 levels across the time periods before, during, and after the intervention. In later studies, researchers linked PM10 levels to elementary school absences (Ransom and Pope, Citation1992), daily mortality (Pope et al., Citation1992), respiratory hospital admissions (Pope, Citation1991), and preterm births (Parker et al., Citation2008).
A goal of Pope (Citation1989) study was to determine whether negative health outcomes could be associated with ambient air pollution concentrations over a period of such a large change. The author discussed other sources of emissions in the valley (noting that they were small in comparison with the mill), compared air quality before, during, and after the intervention, used different estimates of dose in the health outcome regression models, and controlled for various confounders. In total, results from 18 models with various combinations of health outcomes and confounders were reported.
The results of this effort laid groundwork for future accountability studies of short-term interventions. Pope (Citation1989) showed that the association of PM10 with various health outcomes was robust to a number of different models across a period of changing emissions, and used similar regressions with health outcomes at nearby hospitals to control for coincidental decreases in influenza when the plant was closed. Later work focused on elementary school absences controlled more thoroughly for location differences by performing the analyses on schools in both more and less polluted districts (Ransom and Pope, Citation1992). Pope (Citation1989) noted that PM10 may serve as a surrogate measure for other pollutants, but did not find evidence to suggest that PM10 was serving as a surrogate for ozone.
1990 Dublin coal ban
In response to poor air quality in Dublin attributed to the use of coal for heating during the 1980s, the government banned coal sales in the city beginning on 1 September 1990. The subsequent improvement in air quality provided an opportunity to assess the impacts of the ban on public health outcomes. Clancy et al. (Citation2002) compared seasonal black smoke (BS), sulfur dioxide (SO2), temperature, relative humidity, and nontrauma death rates for 6 yr before the intervention and 6 yr after. Death rates were estimated and adjusted in order to account for other changes happening in Dublin parallel with the ban, including meteorology, changing age distribution, and respiratory disease epidemics (influenza). Other changes that could not be captured were accounted for by adjusting death rates by age-standardized death rates for the rest of Ireland, excluding Dublin. The authors found that BS concentrations decreased 70% after the ban and SO2 levels were reduced 34%. The ban coincided with a reduction in respiratory and cardiovascular-related death rates similar in magnitude to those found by Pope (Citation1989). They concluded that, even given decreasing death rates throughout Ireland, the coal ban led to substantial improvements in air quality and subsequent reductions in negative health outcomes.
Dockery and colleagues revisited the Dublin coal ban in later studies, along with similar bans in other cities in Ireland that occurred in 1995, 1998, and 2000 (Dockery et al., Citation2013; Goodman et al., Citation2009). In their reassessment, which included a detailed sensitivity analysis and a more comprehensive approach for correcting for long-term background trends unassociated with each ban (i.e., by including control locations presumably unaffected by the bans) and other secular effects, they found only a decrease in respiratory mortality rates in Dublin after the 1990 ban, and no significant reductions at other locations after subsequent bans. The interrupted time-series study design used here, in which the health model included a binary variable that indicated controlled versus not controlled periods, is a direct accountability technique linking regulations to health without quantifying the impact of regulations on air quality (the direct accountability framework is discussed in more detail below). The lack of association in the follow-up analysis was linked to better accounting for background health trends in other parts of the country unaffected by the ban (Dockery et al., Citation2013).
One drawback of the Dockery et al. (Citation2013) study was the lack of air quality measurement data in the control cities (i.e., those that did not implement a coal ban). The authors could draw conclusions on changes in air quality in districts that had the ban using descriptive statistics before and after the intervention, but could not draw conclusions on how changes in these areas were confounded by similar changes seen throughout the country. Taken together, the two studies show how confounders—concurrent changes in societal factors in this case—can obscure results obtained in accountability research. In the later study, more data on both spatial and temporal scales increased the number of viable analyses available to researchers and increased the ability to draw sound conclusions regarding the effectiveness of control programs.
1990 Hong Kong sulfur ban
In 1990, Hong Kong began requiring fuel oil (used for power generation and transportation) sold in the city to be 0.5% by weight sulfur or less. Multiple studies have assessed the impacts of the reduction on air pollution and public health coinciding with the ban (Hedley et al., Citation2002; Liu et al., Citation2015; Peters et al., Citation1996; W. Wang et al., Citation2009; Wong et al., Citation2012, Citation1998). Peters et al. (Citation1996) compared different areas throughout Hong Kong and found that after the ban, more polluted areas experienced large reductions in SO2 and sulfate concentrations, and subsequent associations with reduced respiratory symptoms in children were found. Peters et al. used multivariate logistic regression to estimate risk of respiratory problems related to a number of factors, including residence district, school, factors representing pre- and post-intervention, and multiple confounding variables. In this study and those that followed, researchers used results from surveys of children in primary school (Wong et al., Citation2012, Citation1998).
Hedley et al. (Citation2002) assessed the change in mortality rates associated with the ban using ambient concentrations and death records from all causes. The researchers used a Poisson regression model that accounted for seasonal fluctuations, temperature, and relative humidity changes to estimate the relative change in average annual numbers of deaths in the 5-yr periods before and after the intervention. They found a reduction in seasonal deaths in the first 12 months after the intervention and a return to the expected death rate from the third year to the fifth. The authors concluded that the coal ban did have an effect on air quality and public health outcomes the first year, and the subsequent return to the cyclical pre-intervention death rate was attributed to a delayed death phenomenon—i.e., later deaths were a result of deaths that did not occur the previous year because of air quality improvements. They discussed how secular changes in death rates and other factors may have had an effect on death rates, but did not adjust the results using a control population.
In the most recent follow-up, Wong et al. (Citation2012) used long-term—5 yr on either side of the ban—records of air pollution and mortality to investigate the effect of the intervention on life span. The study met difficulties, including the inability to separate health effects of different pollutants (nickel, vanadium, and SO2), and large uncertainties caused by high spatial and temporal variability through the study period. In their review of the project, the HEI concluded that the inability to control for potential confounders that correlated with changes in air quality means that there is little hope for estimating changes in life expectancy attributable to changing air pollution—an effect typically estimated using cohort studies—using daily time-series model (Wong et al., Citation2012; HEI Commentary, Citation2012).
The varied results in the Hong Kong studies show the difficulty in estimating impacts of regulatory actions, even when large amounts of data are available. An important aspect of each of these studies was the comparison between more and less polluted districts, which showed that more polluted districts experienced larger improvements than previously less polluted districts. These areas, however, are not perfect controls, since they have many differences other than their pollution levels that could impact health outcomes (such as access to health care) (Wong et al., Citation2012; HEI Commentary, Citation2012).
1996 Atlanta Olympics
The 1996 Summer Olympics were held in Atlanta, Georgia, during which a local road traffic congestion management strategy was implemented for 17 days that included banning private automobile traffic in the downtown area, new options for public transportation, and alternative work hours for businesses. Friedman and colleagues (Citation2001) compared air quality (multiple pollutants), childhood asthma and nonasthma acute events, meteorology, and vehicular traffic for the period during the Olympics to the 4-week periods prior and post. They found significant decreases in traffic counts along with improvements in both air quality and public health over the period of the Games, but did note that the cause of the change in air quality was likely linked to both decreased emissions and favorable meteorological conditions. They concluded that, even with the influence of ideal meteorological conditions, the policies related to the Games had an impact on air quality and public health in Atlanta.
Peel et al. (Citation2010) revisited the same intervention using an expanded data set of emergency department visits for 1995 through 2004, air quality and meteorological data from multiple monitoring sites in Atlanta and the surrounding counties, and traffic counts at 18 sites within the five counties of interest. Similar to Friedman et al. (Citation2001), Peel et al. (Citation2010) reported reduced concentrations of ozone and other air pollutants in Atlanta during the Games, but further concluded that, in light of lower ozone levels across the southeastern United States and meteorological conditions unfavorable to ozone production across the region, improved air quality during the Games was due to atmospheric conditions and not a change in emissions. They did not find significant reductions in respiratory or cardiovascular emergency department visits in adults or children during the Games after adjusting for seasonal trends and other confounders, but the results were limited by the short time period of interest and low numbers of daily emergency department visits.
Peel et al.’s (Citation2010) study was limited by the intervention’s short duration, low numbers of emergency department visits, lack of control areas for the health analysis, and a difficulty in isolating the impact of the control from typical temporal patterns in health effects (Peel et al., Citation2010; HEI Commentary, Citation2010). The Atlanta Olympics studies provide examples of accountability studies that investigate an intervention from the perspectives of both the classic accountability paradigm and using the direct approach (i.e., using statistical methods that link the control period directly to the health outcome of interest, instead of linking health outcomes to ambient pollution levels).
2008 Beijing Olympics
As a condition for hosting the 2008 Olympics, the Chinese government agreed to reduce emissions in order to improve the air quality for both the Games and the ensuing Paralympic Games (Rich et al., Citation2012). This chain of events led to a number of studies assessing the effectiveness of the policies at reducing air pollution in the city and any associated health benefits (Hou et al., Citation2010; Li et al., Citation2010; Liu et al., Citation2015, Citation2012, Rich et al., Citation2015, Citation2012; Su et al., Citation2015; B. Wang et al., Citation2010; M. Wang et al., Citation2009; S. Wang et al., Citation2010; Wang and Xie, Citation2009; W. Wang et al., Citation2009; X. Wang et al., Citation2009; Y. Wang et al., Citation2009; Wu et al., Citation2010; Xing et al., Citation2011).
An advantage to the planned emission reductions in Beijing was that researchers had the opportunity to plan air quality observational studies, recruit test subjects beforehand, and test health outcomes during the intervention period—a major shift compared with the historical approach to accountability research of natural experiments designed after an intervention. Researchers planned ambient measurement campaigns (B. Wang et al., Citation2010; M. Wang et al., Citation2009; X. Wang et al., Citation2009) and used measurements of personal exposure (Wu et al., Citation2010) and health markers (Rich et al., Citation2012) to assess impacts of emission reduction. Using data on birth weights in the Beijing area, Rich et al. (Citation2015) found that babies in their eighth month of gestation during the Olympics were statistically significantly larger at birth than babies born at the same term the year before and after. Su et al. (Citation2015) related cardiovascular death counts to ambient pollution measurements while accounting for meteorology and air mass origin and found a positive association. Hou et al. (Citation2010) extended the analysis to an economic impact estimated based on value of statistical life and average outpatient costs in Beijing. All of the studies listed above found positive associations between reduced health outcomes and the time period of emission reductions.
Xing et al. (Citation2011) used a chemical transport model to estimate gas and particulate matter sensitivities to emissions and meteorology, and concluded that emission controls implemented during the period reduced the sensitivity of ozone chemistry to VOC emissions in Beijing. They noted the limitations of assuming a linear system in their modeling, but asserted that the results show how reduced emission controls have important effects on atmospheric conditions even in time periods of meteorology favorable to reduced pollution.
Although most studies concluded that emission controls led to improved air quality during the Olympics, Wang et al. (Citation2009) used 4-day air plume back trajectories regressed against PM concentrations to conclude that 40% of the variability in ambient measurements was attributable to meteorology (compared with 16% attributable to emissions). The authors observed statistically significant changes in PM concentrations during the Games compared with before and the Olympic Games, but did not find statistically significant differences between source control and non–source control periods (controls were imposed a few weeks before the Games began). Wang et al. (Citation2009) determined that wind direction from the cleaner territory to the northeast of the city during the Games created favorable conditions that reduced PM concentrations below what they would have been with just the controls.
The Beijing Olympics studies show the expanded types of studies available to scientists who can plan in advance to implement accountability studies. These include special ambient air pollution, personal exposure, and health marker measurement campaigns. Future accountability studies should take advantage of planned rules and plan ahead in a similar fashion, but should extend the planning to measurements of confounding factors (e.g., smoking habits, accessibility of care, etc.).
London congestion charging scheme
On 17 February, 2003, London introduced a congestion charging scheme (CCS) in the center of the city, along with other regional traffic changes in an attempt to reduce traffic within the city during work hours on weekdays (Atkinson et al., Citation2009; Kelly et al., Citation2011). This intervention is an example of a policy not specifically designed to improve air quality, but one that may have potential benefits. Atkinson et al. (Citation2009) used ambient concentrations measured at more than 40 monitoring cites in the greater London area to assess impacts of the CCS on air quality in the city. Using comparisons with geometric mean background concentrations from monitors outside the city center, they were able to show evidence for decreased nitrogen oxides (NOx), O3, PM10, and CO within the CCS zone; however, given the concurrent traffic changes, the authors were not able to fully attribute causality to the CCS. Later, the same group applied more detailed statistical analyses, including use of estimates of emission changes attributable to the CCS, and again found small improvements in air quality within the CCS zone (Kelly et al., Citation2011). Further modeling using estimated emissions provided evidence that the changes were attributable to regional air quality regulations, such as the requirement for buses to install particulate filters.
Akin to the CCS, 12 countries across Europe have implemented low emission zones (LEZs), which restrict vehicles based on the emission standards they were designed to meet. Studies to date that investigate the effectiveness of LEZ policies, reviewed by Holman et al. (Citation2015), tend to be similar in approach to the work investigating the London CCS and have produced similarly mixed results.
These studies show the difficulty of quantifying the impacts of a single local regulatory action in the context of broader regional changes, variable meteorology, congruent regulations, and unanticipated institutional or behavioral changes that may be associated with a regulation. The results highlight the need for detailed estimates of uncertainties in measurements and modeling for each link in the accountability chain—the small improvements in air quality attributed to the CCS policy must be viewed with caution due to limited knowledge of the associated uncertainty (Kelly et al., Citation2011; HEI Commentary, Citation2011).
2010 World Expo in Shanghai
In 2010, Shanghai hosted the 6-month-long (May–October) World Expo and implemented a number of emission control measures to improve air quality (Hao et al., Citation2011; Huang et al., Citation2013, Citation2012; Y. Lin et al., Citation2013). The government imposed short-term limits on energy production, industries such as coking and cement-making, transportation, construction, and agricultural burning in the region.
Hao et al. (Citation2011) compared satellite measurements of nitrogen dioxide (NO2), aerosol optical thickness (AOT), and carbon monoxide (CO) between the same period over the three previous years and 6 months after the Expo. They found reductions in NO2, AOT, and CO of 8%, 14%, and 12% compared with before the Expo, and subsequent increases in NO2 and AOT of 20% and 23% after the Expo. Huang et al. (Citation2013) used highly time-resolved measurements of PM constituents to assess ambient pollution concentration trends during the Expo. They used back-trajectory analysis to identify important sources and regions (similar to the Beijing studies, they determined the Central Plains to be a major source). Assessment of the constituent makeup led to the conclusion that controls on stationary sources led to the reduction in sulfate aerosols over the period of the Expo, but found significant increases in nitrate aerosol, which the authors attributed to increased traffic from visitors to the region during the Expo. This study discusses meteorological conditions, but does not adjust for meteorological fluctuations in their analysis.
Y. Lin et al. (Citation2013) used measurements from 53 measurement sites in the Yangtze River Delta region that includes Shanghai and found that air quality was worse in May, June, and October, and that it was improved in the intermediary months. The researchers concluded that the cleaner months aligned with wind patterns from the sea, which led to cleaner air near the coast and deteriorated air quality inland. They attributed lower SO2 and PM10 concentrations during the Expo to limits imposed on power plants, industry, and construction, and higher NOx, CO, and O3 to increased vehicular traffic associated with visitors to the region for the Expo.
The study period for the Shanghai World Expo had the benefit of being longer (6 months) than other short-term intervention studies (e.g., the Atlanta or Beijing Olympics). However, Lin et al.’s investigation into wind patterns led to the conclusion that meteorological variability and regional transport played an important role in the changes in air quality during this period. All three studies discussed here noted the role of an unanticipated outcome of an intervention—i.e., increased traffic due to visitors to the region. Their use of satellite and monitoring data, statistical descriptions, and back-trajectory analysis provide an example of a multiplatform approach to accountability research, which should be employed in further studies as available and applicable.
Port of Oakland diesel trucks retrofit
Shipping ports are a major source of PM air pollution in coastal areas (Harley, Citation2014; Kuwayama et al., Citation2013). The State of California instituted controls on multiple sources associated with activities at ports, one of which was the Comprehensive Truck Management Plan, which began in October 2009. The program required that trucks meet emission standards (requiring the use of a diesel particulate filter, or DPF) and register with the port database by April 2010. Kuwayama et al. (Citation2013) applied positive matrix factorization (PMF), a source apportionment technique, to PM measurements near the port for weekdays between 8 March 2010 and 28 March 2010. They used the entire time period to train the PMF model, but only used a subset of days selected for wind speed and direction coming from the port in the analysis. The authors found that contributions of port truck traffic to PM components decreased by amounts ranging from 66% to 87%.
Harley (Citation2014) measured concentrations at high time resolution at a major access road to the same port in 2011 and 2013. Emission factors of passing trucks were estimated from the measurement data and related to the passing vehicle using the registration database, which included information on model year and DPF retrofit status. The authors reported 99% coverage of DPF technologies, and reductions in fleet-averaged emission factors of 76 ± 22% and 53 ± 8% of black carbon and NOx, respectively, over the period 2009–2013, which align with prior estimates by Kuwayama et al. (Citation2013).
These studies show how before and after measurements can be made directly of emissions related to interventions, again exemplifying a benefit of planning an accountability study before a regulation goes in effect.
China Huai River policy
Chen et al. (Citation2013) performed a study that addresses a markedly different type of regulation, namely, one that had the effect of deteriorating air quality. Under the Huai River policy, the Chinese government provided coal for heating to residents north of the Huai River, where air quality is especially poor. Chen et al. (Citation2013) used two models: first, a conventional model with mortality rates in 90 cities across China as the response and total suspended particles (TSP) and other city-specific observable characteristics that may impact health as covariates, and, second, a two-stage least squares system of equation that leverages a regression discontinuity (RD) approach to test a step function change of air quality and TSP effects on health across the Huai River. The conventional approach yielded the result that a 100 µg m−3 increase in TSP was associated with a 0.52- or 0.54-yr decrease in life expectancy for models without and with climate and demographic controls, respectively. The RD approach tests for discontinuity at the Huai River line; for example, the test indicates that the changes in SO2, NOx, and expected life expectancy across the line are not statistically significant, but that the changes in TSP and actual life expectancy (5.04 yr, 95% confidence interval [CI]: −8.81, −1.27 yr) across the line are statistically significant. These results suggest a decreased life expectancy of 3.0 (95% CI: 0.4, 5.6) yr for a 100 µg m−3 increase in TSP.
This study was able to leverage a policy that affected two populations (i.e., north and south of the Huai River) simultaneously, and the authors designed their study to directly compare the affected population (to the north) with the control (to the south). The authors note that multiple confounding factors are not captured by the model, for instance, if the policy caused altered behavior changes (such as spending more time indoors) or different spending habits (such as on medical care or tobacco) because of the policy’s potential impact on disposal income. Chen et al. (Citation2013) found that the results were robust to numerous sensitivity analyses to test for differences in populations north and south of the river line.
The Chen et al. (Citation2013) study is well thought out and addresses one of the major issues with a number of previous accountability studies, namely, the lack of a suitable control population. Although the RD method design is not applicable to all accountability studies (neighboring control populations are a large part of the study’s success), it offers a number of benefits and should continue to be applied and developed in the accountability field.
Regulations under the 1990 United States Clean Air Act Amendments
Actions taken under the 1990 CAAA presented researchers with an opportunity to extend accountability analysis from the short-term actions described above to actions taken incrementally over many years. Further, nationwide ambient air quality networks made it possible to assess impacts over broad spatial scales. Between 1997 and 2011, estimated nationwide (United States) NOx and CO emissions dropped by about 50% and 60%, respectively (He et al., Citation2013), and 95th percentile summertime ozone decreased over the period 1998–2013 by 1–2 ppb yr−1 (Simon et al., Citation2015).
Given the long time period and economic cost of the intervention, there have been many studies that focus on the emission and air quality end points (Camalier et al., Citation2007; Gégo et al., Citation2008, Citation2007, Godowitch et al., Citation2010, Citation2008; Harrington et al., Citation2012; He et al., Citation2013; Lurmann et al., Citation2014; Sickles and Shadwick, Citation2014; EPA, Citation2011). The lengthy data record of both air quality measurements and emission estimates allows these researchers to use meteorological detrending and other statistical methods to assess the relative impacts of meteorology and emission changes. Results agree across studies that the regulations have reduced air pollution concentrations.
The EPA undertook a detailed assessment of benefits and costs of the Clean Air Act as part of the requirements under Section 812 of the 1990 CAAA (EPA, Citation2011). They used modeled actual and estimated counterfactual emissions to drive a chemical transport model for two scenarios: “with-CAAA” and “without-CAAA,” and estimated changes in concentrations, mortality, environmental impacts, costs, and benefits between the two. Estimated direct costs, most of which stemmed from control costs, totaled $53 billion (in 2006 dollars) in 2010. The research used results of cohort air pollution studies and expert elicitations to decide on appropriate concentration-response functions for ozone and PM, and used population-weighted concentrations to estimate dose. These values were used with concentration-response functions and estimates of willingness to pay to estimate cases of “excess premature mortality” per year and the sum of “dollars per mortality avoided” (similar to “value of a statistical life”—VSL). Estimated monetized benefits totaled $1.3 trillion (in 2006 dollars) in 2010. A detailed sensitivity uncertainty analysis to model inputs yielded variability in the results, but it was small compared with the difference between the estimates of total benefits and costs.
Whereas most studies assess trends in emissions and air quality, a body of research uses a potential-outcomes approach that estimates outcomes at links in the accountability chain for developing counterfactual emission scenarios (Daskalakis et al., Citation2016; Harrington et al., Citation2012; Henneman et al., Citationin review; EPA, Citation2011; Wang et al., Citation2014; Zigler et al., Citation2012). Morgenstern et al. (Citation2012), for example, developed a statistical model that linked monthly PM2.5 concentrations with power plant SO2 emissions and then used the model to estimate counterfactual concentrations. Henneman et al. (Citationin review) extends this analysis to daily PM2.5 and ozone. Daily results are important in this context for future use in acute health analyses.
Results for health studies are more varied (Cox and Popken, Citation2015; S. Lin et al., Citation2013; Pope et al., Citation2012; EPA, Citation1997b; Zigler et al., Citation2012). These studies have noted the difficulty in assessing long-term implementations of regulations due to the inability of statistical models to capture other changing factors that occur, such as shifting baseline health of a population or availability of care, statistical manipulation, or overinterpretation of subgroup analysis (i.e., making definitive conclusions based on models that group health observational data sets by gender, age, geographic areas, etc. [Pope et al., Citation2012]). They employed alternative methods such as Granger causality tests (Cox and Popken, Citation2015) and principal stratification (Zigler et al., Citation2012).
Zigler et al. (Citation2012) sought to attribute causality of improved public health to nonattainment designation for PM10 of counties in the western United States under the 1990 CAAA. They used a statistical method called principal stratification to distinguish causal effects of a regulation on health that are associated with causal effects of the regulation on air quality versus those that are not. Their analysis covered 7 million Medicare enrollees in the western United States and finds that the effect of the nonattainment designation programs was 1.76 fewer deaths per 1000 Medicare beneficiaries.
Zigler et al. (Citation2016) extended their previous efforts by assessing the designation of National Ambient Air Quality Standards (NAAQS) nonattainment on air pollution in various locations using both principal stratification and causal mediation, a similar method that separates effects of an intervention into the “natural direct” and “natural indirect” effects. The authors employed a principal stratification method that matches areas based on their propensity scores—a statistical score that combines multiple confounders into one number—and uses locations not designated as nonattainment areas for the control. Their analysis shows that there is some interference between study and control locations. A limitation of this method is that, in order to compare multiple locations at once, propensity scores are developed across many varying conditions. First, for locations that are in nonattainment that have no matching areas that are in attainment (based on propensity scores), these locations cannot be used. Second, assigning a single score to a region based on a range of factors may dull the impact of one important factor. One important factor may influence air pollution or health outcomes more than many similar attributes. A second limitation is the assumption that there is no unmeasured confounding, meaning that all factors that went into the estimation of propensity scores represent all factors that could confound comparisons.
The California Children Studies investigated impacts of long-term changes in air quality on children health. Gauderman et al. (Citation2015) and Berhane et al. (Citation2016) used surveys from three cohorts of children aged 5–18 between 1993 and 2012 in eight communities in California to assess health impacts of air quality changes associated with the 1990 CAAA. Gauderman et al. (Citation2015) used a linear spline model to estimate impacts of changing air quality on measures of lung development in children aged 11–15. The models adjusted for multiple confounding variables and found statistically significant improvements in lung function attributable to decreased NO2, PM2.5, and PM10 concentrations, but the authors note high correlation between these three pollutants. Berhane et al. (Citation2016) used a multilevel logistic model to estimate effects of multiple annual air pollution concentrations. Their model included many covariates to account for multiple potential confounders, including random effects, secondhand smoke, season or month of data collection, and age. From their results, they conclude that decreases in ambient pollution concentrations are associated with decreased bronchitic symptoms in children that are statistically significant. They concede that their results cannot be interpreted as attributing causality, but that they support benefits of air pollution reductions.
Two recent studies address accountability of the CAA on aerosol loading over the United States and relate its potential to impact climate (Gan et al., Citation2015, Citation2014). Gan et al. (Citation2014) assessed multiple surface and satellite measurement data sets to assess changes in short-wave radiation and noted a trend of increasing cloud brightness. These studies are notable both for their nationwide coverage and long time period of coverage. Although their analysis is primarily concerned with trends, the authors include detailed discussion of physical and chemical reasons for the observations.
The United States experienced widespread reductions in emissions and subsequent improvements in air quality between when the Amendments became law and the present. Collectively, the long-term Clean Air Act Amendment studies represent an advance over the classical accountability studies that investigated short-term interventions. Results of studies focused on air quality find it straightforward to conclude that the legislation and regulations thereunder led to improvements. Studies that assessed health impacts found mixed results; some found large improvements, whereas others found small or no reductions in health effects. This collection of studies presents an argument for further development of statistical methods that are appropriate for assessing changes in health effects while accounting for the multitude of confounders that change over long time periods on wide time scales.
Previous commentaries on accountability studies
Key points from recent reviews of accountability analyses are discussed below, and a commentary on the direction of the field is provided in the following section.
Health Effects Institute Communications 11, 14, and 15
HEI Communication 11 is intended to promote research aimed at refining methods for performing accountability analyses of current policies (Health Effects Institute, Citation2003). HEI makes the case for thorough assessment of previous policies, namely, to inform future policy decision-making, and lists a number of opportunities for accountability studies. The work steps through the accountability chain and dissects confounders that influence the chain between the links. The authors list potential issues that affect all accountability studies and provide guidance on opportunities for future work. They present broad recommendations in three areas: (1) development and testing of new study designs, (2) identifying targets for accountability research, and (3) development of systems to track health impacts of regulations. Specific challenges include defining an appropriate baseline of pollutant levels, identifying the impact of mixtures of pollutants versus single pollutants, and isolating the causal pathway between regulations and health outcomes independent of unanticipated changes in personal activities, behaviors, and other confounders. They caution that stakeholders often hold high expectations for accountability research, when the realities of the research may restrict the possibility of providing definitive evidence for efficacy of controls. Since the 2003 report was written, the HEI has funded a number of accountability studies (e.g., Dockery et al., Citation2013; Kelly et al., Citation2011; Peel et al., Citation2010; Peters et al., Citation2009; Wong et al., Citation2012; Zigler et al., Citation2016).
More recently, HEI Communications 14 and 15 review the accountability research carried out to date and make recommendations for future strategies, methods, and opportunities for future accountability research (Health Effects Institute, Citation2010; Van Erp and Cohen, Citation2009). Both Communications 14 and 15 note specific challenges in accountability research and make specific recommendations regarding study planning and design, with particular emphasis on designing studies around interventions with high-quality air pollution monitoring data (e.g., highly time and spatially resolved) and large enough reductions in air quality to discern statistically significant effects on health. They recommend assessing as many links in the accountability chain to account for confounding, using proactive (i.e., before the intervention) study design, and continuing developing methods that support causal links between interventions and health outcomes.
Review of accountability studies assessing health end points, 2011
Bell et al. (Citation2011) reviewed accountability studies that assessed health end points. They note that the majority of the accountability studies published up to that point focused on short-term interventions at a local scale, and that extending the analysis to longer time scales and larger distance scales requires the development of more advanced statistical techniques. Increasing numbers of studies have improved their methodologies to take these larger scales into account, such as those discussed above under the Clean Air Act throughout the United States. The authors identify several challenges for studies of this scale (both time and distance). Those discussed in depth include the choice of baseline pollution and health levels, transboundary pollutant transport from outside of the study area, and difficulties in exposure-response studies, such as air pollution modeling and extrapolation between populations and geographic areas.
Bell et al. (Citation2011) note that it can be particularly difficult to determine baseline air pollution levels for secondary pollutants or ones that undergo nonlinear transformations in the atmosphere. They list a number of modeling approaches (e.g., source-receptor matrices and chemical transport models) that are used to estimate air pollution–emissions relationships, but caution that each of these modeling approaches carries with it limitations. The authors recommend further development and evaluation of these models and their extension to exposure estimates. The ability of a model to estimate absolute pollutant concentrations may not be as necessary as the model’s ability to capture changes.
Exposure studies are subject to the same assumptions in accountability research as in more traditional epidemiological research. Examples of such assumptions include the extrapolation of results across pollution levels (e.g., relating to the potential existence of a threshold pollutant level below which no adverse health effects are observed), populations, or time spans. Effects of multipollutant mixtures are difficult to assess because of limited scientific knowledge of interactions, correlation between pollutants, and chemical makeup of pollutants that are characterized together (e.g., PM2.5 is composed of multiple chemical elements that differ between regions). They note the difficulty in assessing each and every health (and environmental) outcome of interest due to both data limitations and available statistical methods.
They conclude that, given the challenges inherent in accountability analysis, the most robust studies should include detailed assessments of uncertainties and present results from multiple models in order to provide cogent evidence that the policy did/did not impact links in the accountability chain.
American Journal of Epidemiology point-counterpoint, 2014
In 2014, the American Journal of Epidemiology (AJE) published a pair of commentaries in a point-counterpoint exchange that addressed the benefits and limitations of potential-outcomes and prospective research designs (Hubbell and Greenbaum, Citation2014; Zigler and Dominici, Citation2014). Zigler and Dominici (ZD) argue that alternative-outcome research adds substance to the current body of air pollution policy research. They note that the majority of the research framed as accountability studies explore indirect relationships between emissions and health outcomes. These studies compare the time during/after the regulatory action (baseline) of interest with a relatable time before or after the action (, right side). ZD argue that this ignores potential changes of the exposure–response relationship that may occur during the implementation of the regulatory action (as discussed in this paper). Questions of direct accountability seek to attribute changes in health response to well-defined regulatory actions while controlling for confounders by including comparable populations that are not subjected to the same regulatory action. Instead of quantifying effects of regulatory actions at each link in the chain, confounders are accounted for in statistical models that link the regulation of interest with the end point of interest (usually either air quality or health outcome). They state that direct studies are necessary to advance accountability research and provide important evidence in the present regulatory climate.
In the counterpoint, Hubbell and Greenbaum (Citation2014) concede that the potential-outcomes framework offers an appealing alternative to traditional epidemiological methods that relate air pollution and health. However, they point out that the approach introduces additional factors (in particular data availability and lack of randomness in the assignment of populations to control and study groups) that must be considered in the study design and suggest that potential-outcomes studies would best be served by designing the studies before the intervention of interest in order to best account for confounders. Pope et al. (Citation2012) acknowledge concerns—such as indiscriminant multiple testing of observational data sets, inadequate control of confounding variables, and statistical model manipulation—that relate to the application of observational studies. However, Pope et al. (Citation2012) note that the validity of each study of this type should be judged on its ability to account for confounding.
The direct accountability approach is somewhat at odds with the historical view of the accountability chain, in which each link should be evaluated for its relationship to the link before it. However, the difference in approaches may be subtler; when answering questions of direct accountability, it remains important to account for potential confounders and control for changes over time that are simultaneous with regulatory actions. The confounders may be slightly different; for instance, if a direct accountability study assesses the impact of installing scrubbers on power plants on populations living near power plants, and an important health-related factor—e.g., smoking behavior–—is comparable between the populations, smoking behavior is not a confounder (Zigler and Dominici, Citation2016).
Challenges and future directions
Two trends are apparent in the accountability assessments above. First, often, one study will assess a regulatory action and determine that the intervention led to a statistically significant change in the response of interest (Clancy et al., Citation2002; Friedman et al., Citation2001; Peters et al., Citation1996; Zigler et al., Citation2012). Later, using additional data, updated methods, and/or accounting for additional factors, those results are found to be less definitive and potentially invalid (Cox and Popken, Citation2015; Dockery et al., Citation2013; Peel et al., Citation2010; Wong et al., Citation2012). Second, spatial and temporal scales of accountability studies have expanded, which has increased the number of potential confounders.
Both patterns demonstrate the importance of appropriately accounting for confounding factors when developing models and understanding as much as practicable responses in each step of the accountability chain (Hubbell and Greenbaum, Citation2014). Examples of important confounders to consider include concurrent regulations, meteorological variability over time/space, interactions between the pollutant targeted by the regulation and other pollutants, and changes in overall health of a population of interest across time and space. In the classical accountability framework, information from these confounders is used to estimate baseline levels at each link in the accountability chain. Typically, researchers use a different type of model for each link, and assessments of both the model outputs (i.e., the counterfactual emissions, air quality, etc.) and the relationships in the model (e.g., the sensitivity of PM2.5 concentrations to emissions) are necessary components of a full evaluation of baseline levels.
So-called direct accountability studies offer an alternative to complement the classical accountability framework. The direct framework has been used in other fields and is becoming more popular in air pollution accountability. Although it is important that these methods be investigated further, it is important to note that the causal framework used in direct accountability is not applicable to all accountability questions. One example is the situation when suitable control areas or populations do not exist (Zigler et al., Citation2016; HEI Commentary, Citation2016). Controlling for confounders is related to selecting an appropriate baseline or control, and statistical methods can be used to address confounding, but neither conventional nor direct methods may not be able to fully account for all confounders (Cox and Popken, Citation2015; Pope et al., Citation2012; Zigler and Dominici, Citation2014).
When feasible, stakeholders should plan approaches to assess a regulation’s efficacy before the regulation is implemented (as in the California Children Studies [Berhane et al., Citation2016; Gauderman et al., Citation2015] and the Beijing Olympics, where B. Wang et al. [Citation2010] and X. Wang et al. [Citation2009] began specialized air pollution measurement campaigns and Wu et al. [Citation2010] measured continuous exposure and health markers in taxi drivers during the Olympic period). This will allow for study designs that more fully address confounding (instead of relying on the “natural experiments” that have typically been used up to this point (Cox and Popken, Citation2015; Hubbell and Greenbaum, Citation2014). For example, studies can be designed to directly assess each link in the accountability chain (direct emission measurements, expanded air quality observations in areas that are expected to most directly respond to the intervention, as well as control regions, and additional health monitoring).
Any changes attributable to regulations are relative to background pollution levels, which are a function of global emission trends and climate change (Fiore et al., Citation2015). The interactions between air pollution and climate has been widely studied; however, there exist many uncertainties in the feedback loops (Fiore et al., Citation2015; Intergovernmental Panel on Climate Change [IPCC], Citation2013; Tagaris et al., Citation2007; Weaver et al., Citation2009). In the United States, the EPA operates the IMPROVE network in remote areas, partially to capture background trends (Sisler and Malm, Citation2000). These, combined with satellite monitoring and regional and global air quality models, are important tools for characterizing changes in background concentrations.
Uncertainties exist in all observations and models. In accountability research, uncertainties inherent in typical emissions, air quality, exposure, and health outcome data and models increase with each assumption researchers make regarding causality. Uncertainties in epidemiological and other models come in two forms: stochastic, or sampling uncertainty, and uncertainty related to model selection (Health Effects Institute, Citation2003). Scientists have formal methods for quantifying the former, but the latter is often larger and more difficult to quantify. Overall uncertainty in estimates is an important aspect of interpreting results. Uncertainties can bias results, and differential error can lead to erroneous conclusions when comparing effectiveness across regulations. More work is needed to better quantify uncertainties, and, when possible, correct for errors.
A final aspect of accountability studies is the comparison between the results of the study and the initial proposed benefits of the regulation (, dashed lines). This is particularly important, as accountability studies results have the potential to contribute to effective future policies, as, for example, the EPA uses accountability-related methods in its regulatory impact assessments (e.g., EPA, Citation2015b, Citation2005b) and its assessment of the 1990 CAAA (EPA, Citation2011). Few other studies to date, however, have attempted to compare results with the original estimated benefits (alhough there are exceptions, e.g., Harrington et al., Citation2012; Morgenstern et al., Citation2012).
Conclusion
As a research field, air pollution accountability has grown in complexity both in terms of the scales of regulations investigated and the analyses performed. The accountability chain serves as one framework for tracking the effects of regulatory actions across multiple outcomes, and future studies should continue to use it as a road map for assessing regulatory actions. A second framework, direct accountability, offers an alternative that should continue to be developed and complement traditional methods. Studies using either approach need to account for relevant confounders when assigning baseline levels and estimating uncertainties with their results. New studies will be enhanced by planning appropriate studies before regulations are introduced in order to enhance data collection of confounding variables as well as outcomes. Further, new tools available to the scientific community, such as satellite measurements and statistical methods that have been applied in other domains offer broad opportunities for the expanded characterization of the efficacy of regulations. These should be evaluated with care in this domain and applied as appropriate. None of the methods reviewed here are applicable to all interventions. The final step in an accountability assessment should be to compare the results with the proposed benefits of the regulation of interest.
Acknowledgment
Laura E. Carpenter helped design .
Funding
This material is based upon work supported by Health Effects Institute and the National Science Foundation Graduate Research Fellowship under grant no. DGE-1148903.
Additional information
Funding
Notes on contributors
Lucas R.F. Henneman
Lucas R.F. Henneman is a Ph.D. candidate in the School of Civil & Environmental Engineering at Georgia Tech. His thesis work is an accountability assessment of the 1990 Clean Air Act Amendments in the Southeastern United States.
Cong Liu
Cong Liu is an associate Professor in Southeast University, China. His main research interests include regional air quality modeling, indoor–outdoor interaction, and gas-particle partitioning.
James A. Mulholland
James A. Mulholland is a Professor in the School of Civil & Environmental Engineering at Georgia Tech. His research is in areas of air quality science and engineering and air pollution health effects.
Armistead G. Russell
Armistead G. Russell is a Professor in the School of Civil & Environmental Engineering at Georgia Tech. His research focuses on atmospheric chemistry and engineering and air pollution health effects.
Related Research Data
References
- Anderson, D.C., C.P. Loughner, G. Diskin, A. Weinheimer, T.P. Canty, R.J. Salawitch, H.M. Worden, et al. 2014. Measured and modeled CO and NOy in DISCOVER-AQ: An evaluation of emissions and chemistry over the eastern US. Atmos. Environ. 96:78–87. doi: 10.1016/j.atmosenv.2014.07.004.
- Atkinson, R.W., B. Barratt, B. Armstrong, H.R. Anderson, S.D. Beevers, I.S. Mudway, D. Green, R.G. Derwent, P. Wilkinson, and C. Tonne. 2009. The impact of the congestion charging scheme on ambient air pollution concentrations in London. Atmos. Environ. 43:5493–5500. doi: 10.1016/j.atmosenv.2009.07.023.
- Balachandran, S., J.E. Pachon, Y. Hu, D. Lee, J.A. Mulholland, and A.G. Russell. 2012. Ensemble-trained source apportionment of fine particulate matter and method uncertainty analysis. Atmos. Environ. 61:387–394. doi: 10.1016/j.atmosenv.2012.07.031.
- Ban-Weiss, G.A., J.P. McLaughlin, R.A. Harley, M.M. Lunden, T.W. Kirchstetter, A.J. Kean, A.W. Strawa, E.D. Stevenson, and G.R. Kendall. 2008. Long-term changes in emissions of nitrogen oxides and particulate matter from on-road gasoline and diesel vehicles. Atmos. Environ. 42:220–232. doi: 10.1016/j.atmosenv.2007.09.049.
- Bell, M.L., R.D. Morgenstern, and W. Harrington. 2011. Quantifying the human health benefits of air pollution policies: Review of recent studies and new directions in accountability research. Environ. Sci. Policy 14:357–368. doi: 10.1016/j.envsci.2011.02.006.
- Berhane, K., C.-C. Chang, R. McConnell, W.J. Gauderman, E. Avol, E. Rapapport, R. Urman, F. Lurmann, and F. Gilliland. 2016. Association of changes in air quality with bronchitic symptoms in children in California, 1993–2012. JAMA 315(14):1491–1501. doi: 10.1001/jama.2016.3444.
- Blanchard, C.L., S. Tanenbaum, and G.M. Hidy. 2012. Source contributions to atmospheric gases and particulate matter in the southeastern United States. Environ. Sci. Technol. 46:5479–5488. doi: 10.1021/es203568t.
- Butler, T.J., F.M. Vermeylen, M. Rury, G.E. Likens, B. Lee, G.E. Bowker, and L. McCluney. 2011. Response of ozone and nitrate to stationary source NOx emission reductions in the eastern USA. Atmos. Environ. 45:1084–1094. doi: 10.1016/j.atmosenv.2010.11.040.
- Camalier, L., W. Cox, and P. Dolwick. 2007. The effects of meteorology on ozone in urban areas and their use in assessing ozone trends. Atmos. Environ. 41:7127–7137. doi: 10.1016/j.atmosenv.2007.04.061.
- Chang, H.H., H. Hao, and S.E. Sarnat. 2014a. A statistical modeling framework for projecting future ambient ozone and its health impact due to climate change. Atmos. Environ. 89:290–297. doi: 10.1016/j.atmosenv.2014.02.037.
- Chang, H.H., X. Hu, and Y. Liu. 2014b. Calibrating MODIS aerosol optical depth for predicting daily PM2.5 concentrations via statistical downscaling. J. Expo. Sci. Environ. Epidemiol. 24:398–404. doi: 10.1038/jes.2013.90.
- Chay, K.Y., and M. Greenstone. 2003. The impact of air pollution on infant mortality: Evidence from geographic variation in pollution shocks induced by a recession. Q. J. Econ. 118(3):1121–1167. doi: 10.1162/00335530360698513.
- Chen, Y., A. Ebenstein, M. Greenstone, and H. Li. 2013. Evidence on the impact of sustained exposure to air pollution on life expectancy from China’s Huai River policy. Proc. Natl. Acad. Sci. U. S. A. 110:12936–12941. doi: 10.1073/pnas.1300018110; doi: 10.1073/pnas.1300018110/-/DCSupplemental.
- Clancy, L., P. Goodman, H. Sinclair, and D.W. Dockery. 2002. Effect of air-pollution control on death rates in Dublin, Ireland: An intervention study. Lancet 360:1210–1214. doi: 10.1016/S0140-6736(02)11281-5.
- Colette, A., C. Granier, Ø. Hodnebrog, H. Jakobs, A. Maurizi, A. Nyiri, B. Bessagnet, et al. 2011. Air quality trends in Europe over the past decade: A first multi-model assessment. Atmos. Chem. Phys. 11:11657–11678. doi: 10.5194/acp-11-11657-2011.
- Cox, L.A. 2013. Improving causal inferences in risk analysis. Risk Anal. 33:1762–1771. doi: 10.1111/risa.12072.
- Cox, L.A., and D.A. Popken. 2015. Has reducing fine particulate matter and ozone caused reduced mortality rates in the United States? Ann. Epidemiol. 25:162–173. doi: 10.1016/j.annepidem.2014.11.006.
- Cox, W.M., and S.-H. Chu, 1993. Meteorologically adjusted ozone trends in urban areas: A probabilistic approach. Atmos. Environ. 27:425–434. doi:10.1016/0957-1272(93)90019-3.
- Dallmann, T.R., and R.A. Harley. 2010. Evaluation of mobile source emission trends in the United States. J. Geophys. Res. 115:D14305. doi: 10.1029/2010JD013862.
- Daskalakis, N., K. Tsigaridis, S. Myriokefalitakis, G.S. Fanourgakis, and M. Kanakidou. 2016. Large gain in air quality compared to an alternative anthropogenic emissions scenario. Atmos. Chem. Phys. 16:9771–9784. doi: 10.5194/acp-16-9771-2016.
- de Hoogh, K., M. Korek, D. Vienneau, M. Keuken, J. Kukkonen, M.J. Nieuwenhuijsen, C. Badaloni, et al. 2014. Comparing land use regression and dispersion modelling to assess residential exposure to ambient air pollution for epidemiological studies. Environ. Int. 73:382–392. doi: 10.1016/j.envint.2014.08.011.
- Dockery, D.W., D.Q. Rich, P.G. Goodman, L. Clancy, P. Ohman-Strickland, P. George, and T. Kotlov; HEI Health Review Committee. 2013. Effect of air pollution control on mortality and hospital admissions in Ireland. Res. Rep. Health Eff. Inst. Jul(176):3–109. doi: 10.1097/01.ede.0000362914.17454.32.
- Dockery, D. W., C.A. Pope, X. Xu, J.D. Spengler, J.H. Ware, M.E. Fay, B.G. Ferris, and F.E. Speizer. 1993. An association between air pollution and mortality in six U.S. cities. N. Engl. J. Med. 329:1753–1759. doi:10.1056/NEJM199312093292401
- Fiore, A.M., V. Naik, E.M. Leibensperger, and J.D. Bachmann. 2015. Air quality and climate connections. J. Air Waste Manage. Assoc. 65:645–685. doi: 10.1080/10962247.2015.1040526.
- Flaum, J.B., S.T. Rao, and I.G. Zurbenko. 1996. Moderating the influence of meteorological conditions on ambient ozone concentrations. J. Air Waste Manage. Assoc. 46:35–46. doi: 10.1080/10473289.1996.10467439.
- Foley, K.M., P. Dolwick, C. Hogrefe, H. Simon, B. Timin, and N. Possiel. 2015a. Dynamic evaluation of CMAQ part II: Evaluation of relative response factor metrics for ozone attainment demonstrations. Atmos. Environ. 103:188–195. doi: 10.1016/j.atmosenv.2014.12.039.
- Foley, K.M., C. Hogrefe, G. Pouliot, N. Possiel, S.J. Roselle, H. Simon, and B. Timin. 2015b. Dynamic evaluation of CMAQ part I: Separating the effects of changing emissions and changing meteorology on ozone levels between 2002 and 2005 in the eastern US. Atmos. Environ. 103:247–255. doi: 10.1016/j.atmosenv.2014.12.038.
- Friberg, M.D., X. Zhai, H.A. Holmes, H.H. Chang, M.J. Strickland, S.E. Sarnat, P.E. Tolbert, A.G. Russell, and J.A. Mulholland. 2016. Method for fusing observational data and chemical transport model simulations to estimate spatiotemporally resolved ambient air pollution. Environ. Sci. Technol. 50:3695–3705. doi: 10.1021/acs.est.5b05134.
- Friedman, M., K. Powell, L. Hutwagner, L.M. Graham, and W.G. Teague. 2001. Impact of changes in transportation and commuting behaviors during the 1996 Summer Olympic Games in Atlanta on air quality and childhood asthma. JAMA 285:897–905. doi:10.1001/jama.285.7.897
- Gan, C.M., J. Pleim, R. Mathur, C. Hogrefe, C.N. Long, J. Xing, S. Roselle, and C. Wei. 2014. Assessment of the effect of air pollution controls on trends in shortwave radiation over the United States from 1995 through 2010 from multiple observation networks. Atmos. Chem. Phys. 14:1701–1715. doi: 10.5194/acp-14-1701-2014.
- Gan, C.M., J. Pleim, R. Mathur, C. Hogrefe, C.N. Long, J. Xing, D. Wong, R. Gilliam, and C. Wei. 2015. Assessment of long-term WRF-CMAQ simulations for understanding direct aerosol effects on radiation “brightening” in the United States. Atmos. Chem. Phys. 15:12193–12209. doi: 10.5194/acp-15-12193-2015.
- Garcia, V.C., E. Gego, S. Lin, C. Pantea, K. Rappazzo, A. Wootten, and S.T. Rao. 2011. An evaluation of transported pollution and respiratory-related hospital admissions in the state of New York. Atmos. Pollut. Res. 2:9–15. doi: 10.5094/apr.2011.002.
- Gauderman, W.J., R. Urman, E. Avol, K. Berhane, R. McConnell, E. Rappaport, R. Chang, F. Lurmann, and F. Gilliland. 2015. Association of improved air quality with lung development in children. N. Engl. J. Med. 372:905–13. doi: 10.1056/NEJMoa1414123.
- Gégo, E., A. Gilliland, J. Godowitch, S. Rao, P. Porter, and C. Hogrefe. 2008. Modeling analyses of the effects of changes in nitrogen oxides emissions from the electric power sector on ozone levels in the eastern United States. J. Air Waste Manage. Assoc. 58:580–588. doi: 10.3155/1047-3289.58.4.580.
- Gégo, E., P.S. Porter, A. Gilliland, and S.T. Rao. 2007. Observation-based assessment of the impact of nitrogen oxides emissions reductions on ozone air quality over the eastern United States. J. Appl. Meteorol. Climatol. 46:994–1008. doi: 10.1175/JAM2523.1.
- Georgia Environmental Protection Division. 2013. Rules for Air Quality Control. 391-3-1-.02(2)(sss). http://rules.sos.ga.gov/GAC/391-3-1 (accessed November 14, 2016).
- Godowitch, J.M., A.B. Gilliland, R.R. Draxler, and S.T. Rao. 2008. Modeling assessment of point source NOx emission reductions on ozone air quality in the eastern United States. Atmos. Environ. 42, 87–100. doi: 10.1016/j.atmosenv.2007.09.032.
- Godowitch, J.M., G.A. Pouliot, and S. Trivikrama Rao. 2010. Assessing multi-year changes in modeled and observed urban NOx concentrations from a dynamic model evaluation perspective. Atmos. Environ. 44:2894–2901. doi: 10.1016/j.atmosenv.2010.04.040.
- Goldberg, D.L., T.P. Vinciguerra, D.C. Anderson, L. Hembeck, T.P. Canty, S.H. Ehrman, D.K. Martins, et al. 2016. CAMx ozone source attribution in the eastern United States using guidance from observations during DISCOVER-AQ Maryland. Geophys. Res. Lett. xx:2249–2258. doi: 10.1002/2015GL067332.
- Goodman, P.G., D.Q. Rich, A. Zeka, L. Clancy, and D.W. Dockery. 2009. Effect of air pollution controls on black smoke and sulfur dioxide concentrations across Ireland. J. Air Waste Manage. Assoc. 59:207–213. doi: 10.3155/1047-3289.59.1.207.
- Greenstone, M. 2004. Did the Clean Air Act cause the remarkable decline in sulfur dioxide concentrations? J. Environ. Econ. Manage. 47:585–611. doi: 10.1016/j.jeem.2003.12.001.
- Hao, N., P. Valks, D. Loyola, Y.F. Cheng, and W. Zimmer. 2011. Space-based measurements of air quality during the World Expo 2010 in Shanghai. Environ. Res. Lett. 6:44004. doi: 10.1088/1748-9326/6/4/044004.
- Harley, R.A. 2014. On-road measurement of emissions from heavy-duty diesel trucks: Impacts of fleet turnover and ARB’s Drayage Truck Regulation. Report to the California Air Resources Board. https://www.arb.ca.gov/research/veh-emissions/onroad-drayage/onroad-drayage.htm (accessed November 17, 2016).
- Harrington, W., R. Morgenstern, J.-S. Shih, and M.L. Bell. 2012. Did the Clean Air Act Amendments of 1990 really improve air quality? Air Qual. Atmos. Health 5:353–367. doi: 10.1007/s11869-012-0176-5.
- He, H., J.W. Stehr, J.C. Hains, D.J. Krask, B.G. Doddridge, K.Y. Vinnikov, T.P. Canty, et al. 2013. Trends in emissions and concentrations of air pollutants in the lower troposphere in the Baltimore/Washington airshed from 1997 to 2011. Atmos. Chem. Phys. 13:7859–7874. doi: 10.5194/acp-13-7859-2013.
- HEI Accountability Working Group. 2003. Assessing health impact of air quality regulations: Concepts and methods for accountability research. Communication 11. Boston, MA: Health Effects Institute.
- Health Effects Institute. 2010. Proceedings of an HEI workshop on further research to assess the health impacts of actions taken to improve air quality. Communication 15. Boston, MA: Health Effects Institute.
- Hedley, A.J., C.-M. Wong, T.Q. Thach, S. Ma, T.-H. Lam, and H.R. Anderson. 2002. Cardiorespiratory and all-cause mortality after restrictions on sulphur content of fuel in Hong Kong: An intervention study. Lancet 360:1646–1652.
- Henneman, L.R., H.H. Chang, D. Lavoue, J.A. Mulholland, and A.G. Russell. In review. Accountability assessment of regulatory impacts on ozone and PM2.5 concentrations using statistical and deterministic pollutant sensitivities. Submitted.
- Henneman, L.R.F., H.A. Holmes, J.A. Mulholland, and A.G. Russell. 2015. Meteorological detrending of primary and secondary pollutant concentrations: Method application and evaluation using long-term (2000–2012) data in Atlanta. Atmos. Environ. 119:201–210. doi: 10.1016/j.atmosenv.2015.08.007.
- Holman, C., R. Harrison, and X. Querol. 2015. Review of the efficacy of low emission zones to improve urban air quality in European cities. Atmos. Environ. 111:161–169. doi: 10.1016/j.atmosenv.2015.04.009.
- Hopke, P.K. 2016. A review of receptor modeling methods for source apportionment. J. Air Waste Manage. Assoc. 66:237–259. doi: 10.1080/10962247.2016.1140693
- Hou, Q., X.Q. An, Y. Wang, and J.P. Guo. 2010. An evaluation of resident exposure to respirable particulate matter and health economic loss in Beijing during Beijing 2008 Olympic Games. Sci. Total Environ. 408:4026–4032. doi: 10.1016/j.scitotenv.2009.12.030.
- Hu, Y., S. Balachandran, J.E. Pachon, J. Baek, C. Ivey, H. Holmes, M.T. Odman, J.A. Mulholland, and A.G. Russell. 2014. Fine particulate matter source apportionment using a hybrid chemical transport and receptor model approach. Atmos. Chem. Phys. 14:5415–5431. doi: 10.5194/acp-14-5415-2014.
- Huang, K., G. Zhuang, Y. Lin, Q. Wang, J.S. Fu, Q. Fu, T. Liu, and C. Deng. 2013. How to improve the air quality over megacities in China: Pollution characterization and source analysis in Shanghai before, during, and after the 2010 World Expo. Atmos. Chem. Phys. 13:5927–5942. doi: 10.5194/acp-13-5927-2013.
- Huang, X.F., L.Y. He, L. Xue, T.L. Sun, L.W. Zeng, Z.H. Gong, M. Hu, and T. Zhu. 2012. Highly time-resolved chemical characterization of atmospheric fine particles during 2010 Shanghai World Expo. Atmos. Chem. Phys. 12:4897–4907. doi: 10.5194/acp-12-4897-2012.
- Hubbell, B., and D. Greenbaum. 2014. Counterpoint: Moving from potential-outcomes thinking to doing—Changing research planning to enable successful health outcomes research. Am. J. Epidemiol. 180:1141–1144. doi: 10.1093/aje/kwu266.
- Hubbell, B.J., R.V. Crume, D.M. Evarts, and J.M. Cohen. 2009. Policy monitor: Regulation and progress under the 1990 Clean Air Act Amendments. Rev. Environ. Econ. Policy 4:122–138. doi: 10.1093/reep/rep019.
- Intergovernmental Panel on Climate Change. 2013. Climate Change 2013: The Physical Science Basis. Contribution of Working Group I to the Fifth Assessment Report of the Intergovernmental Panel on Climate Change, 2013. Cambridge (UK) and New York: Cambridge University Press. doi: 10.1017/CBO9781107415324.
- Kang, D., C. Hogrefe, K.L. Foley, S.L. Napelenok, R. Mathur, and S. Trivikrama Rao. 2013. Application of the Kolmogorov–Zurbenko filter and the decoupled direct 3D method for the dynamic evaluation of a regional air quality model. Atmos. Environ. 80:58–69. doi: 10.1016/j.atmosenv.2013.04.046.
- Kean, A.J., D. Littlejohn, G.A. Ban-Weiss, R.A. Harley, T.W. Kirchstetter, and M.M. Lunden. 2009. Trends in on-road vehicle emissions of ammonia. Atmos. Environ. 43:1565–1570. doi: 10.1016/j.atmosenv.2008.09.085.
- Kelly, F., H.R. Anderson, B. Armstrong, R.W. Atkinson, B. Barratt, S. Beevers, D. Derwent, D. Green, I. Mudway, and P. Wilkinson; HEI Health Review Committee. 2011. The impact of the congestion charging scheme on air quality in London. Part 1. Emissions modeling and analysis of air pollution measurements. Res. Rep. Health Eff. Inst. Apr(155):5–71. https://www.ncbi.nlm.nih.gov/pubmed/21830496.
- Klausbruckner, C., H.J. Annegarn, L.R. F. Henneman, and P. Rafaj. 2016. A policy review of synergies and trade-offs in South African climate change mitigation and air pollution control strategies. Environ. Sci. Policy 57:70–78. doi: 10.1016/j.envsci.2015.12.001.
- Kuebler, J., H. van den Bergh, and A.G. Russell. 2001. Long-term trends of primary and secondary pollutant concentrations in Switzerland and their response to emission controls and economic changes. Atmos. Environ. 35:1351–1363. doi: 10.1016/S1352-2310(00)00401-5.
- Kuwayama, T., J.R. Schwartz, R.A. Harley, and M.J. Kleeman. 2013. Particulate matter emissions reductions due to adoption of clean diesel technology at a major shipping port. Aerosol Sci. Technol. 47:29–36. doi: 10.1080/02786826.2012.720049.
- Laden, F., J. Schwartz, F.E. Speizer, and D.W. Dockery. 2006. Reduction in fine particulate air pollution and mortality: Extended follow-up of the Harvard Six Cities study. Am. J. Respir. Crit. Care Med. 173:667–672. doi: 10.1164/rccm.200503-443OC.
- Lamsal, L.N., R.V. Martin, A. Padmanabhan, A. van Donkelaar, Q. Zhang, C.E. Sioris, K. Chance, T.P. Kurosu, and M.J. Newchurch. 2011. Application of satellite observations for timely updates to global anthropogenic NOx emission inventories. Geophys. Res. Lett. 38:1–5. doi: 10.1029/2010GL046476.
- Lawson, D., P. Groblicki, D. Stedman, G. Bishop, and P. Guenther. 1990. Emissions of in-use motor vehicle in Los Angeles: A pilot study of remote sensing and the inspection and maintenance program. J. Air Waste Manage. Assoc. 40:1096–1105. doi: 10.1080/10473289.1990.10466754.
- Lawson, D.R. 1990. The Southern California Air Quality Study. J. Air Waste Manage. Assoc. 40:156–165. doi: 10.1080/10473289.1990.10466671.
- Lee, J.-T., J.-Y. Son, and Y.-S. Cho. 2007. Benefits of mitigated ambient air quality due to transportation control on childhood asthma hospitalization during the 2002 Summer Asian Games in Busan, Korea. J. Air Waste Manage. Assoc. 57:968–973. doi: 10.3155/1047-3289.57.8.968.
- Lee, M., I. Kloog, A. Chudnovsky, A. Lyapustin, Y. Wang, S. Melly, B. Coull, P. Koutrakis, and J. Schwartz. 2015. Spatiotemporal prediction of fine particulate matter using high-resolution satellite images in the Southeastern US 2003–2011. J. Expo. Sci. Environ. Epidemiol. doi: 10.1038/jes.2015.41.
- Li, Y., W. Wang, H. Kan, X. Xu, and B. Chen. 2010. Air quality and outpatient visits for asthma in adults during the 2008 Summer Olympic Games in Beijing. Sci. Total Environ. 408:1226–1227. doi: 10.1016/j.scitotenv.2009.11.035.
- Lim, S.S., T. Vos, A.D. Flaxman, G. Danaei, K. Shibuya, H. Adair-Rohani, M. Amann, et al. 2013. A comparative risk assessment of burden of disease and injury attributable to 67 risk factors and risk factor clusters in 21 regions, 1990–2010: A systematic analysis for the Global Burden of Disease Study 2010. Lancet 380:2224–2260. doi: 10.1016/S0140-6736(12)61766-8.
- Lin, J., C.P. Nielsen, Y. Zhao, Y. Lei, Y. Liu, and M.B. McElroy. 2010. Recent changes in particulate air pollution over china observed from space and the ground: Effectiveness of emission control. Environ. Sci. Technol. 44:7771–7776. doi: 10.1021/es101094t.
- Lin, S., R. Jones, C. Pantea, H. Özkaynak, S.T. Rao, S.-A. Hwang, and V.C. Garcia. 2013. Impact of NOx emissions reduction policy on hospitalizations for respiratory disease in New York State. J. Expo. Sci. Environ. Epidemiol. 23(1):73–80. doi: 10.1038/jes.2012.69.
- Liu, Y., K. He, S. Li, Z. Wang, D.C. Christiani, and P. Koutrakis. 2012. A statistical model to evaluate the effectiveness of PM2.5 emissions control during the Beijing 2008 Olympic Games. Environ. Int. 44:100–105. doi: 10.1016/j.envint.2012.02.003.
- Lin, Y., K. Huang, G. Zhuang, J.S. Fu, C. Xu, J. Shen, and S. Chen. 2013. Air quality over the Yangtze River Delta during the 2010 Shanghai expo. Aerosol Air Qual. Res. 13:1655–1666. doi: 10.4209/aaqr.2012.11.0312.
- Liu, Y., B. Yuan, X. Li, M. Shao, S. Lu, Y. Li, C.C. Chang, et al. 2015. Impact of pollution controls in Beijing on atmospheric oxygenated volatile organic compounds (OVOCs) during the 2008 olympic games: Observation and modeling implications. Atmos. Chem. Phys. 15:3045–3062. doi: 10.5194/acp-15-3045-2015.
- Lurmann, F., E. Avol, and F. Gilliland. 2014. Emissions reduction policies and recent trends in Southern California’s ambient air quality. J. Air Waste Manage. Assoc. 65:324–335. doi: 10.1080/10962247.2014.991856.
- McDonald, B.C., T.R. Dallmann, E.W. Martin, and R.A. Harley. 2012. Long-term trends in nitrogen oxide emissions from motor vehicles at national, state, and air basin scales. J. Geophys. Res. Atmos. 117:D00V18. doi: 10.1029/2012JD018304.
- McDonald, B.C., D.R. Gentner, A.H. Goldstein, and R.A. Harley. 2013. Long-term trends in motor vehicle emissions in U.S. urban areas. Environ. Sci. Technol. 47:10022–10031. doi: 10.1021/es401034z.
- Milanchus, M.L., S. Trivikrama Rao, and I.G. Zurbenko. 1998. Evaluating the effectiveness of ozone management efforts in the presence of meteorological variability. J. Air Waste Manage. Assoc. 483:201–215. doi: 10.1080/10473289.1998.10463673.
- Morgenstern, R.D., W. Harrington, J.-S. Shih, and M.L. Bell; HEI Health Review Committee. 2012. Accountability analysis of title IV phase 2 of the 1990 Clean Air Act Amendments. Res. Rep. Health Eff. Inst. Nov(168):5–35. https://www.ncbi.nlm.nih.gov/pubmed/23409509.
- Murray, F. 2013. The changing winds of atmospheric environment policy. Environ. Sci. Policy 29:115–123. doi: 10.1016/j.envsci.2013.02.005.
- Napelenok, S.L., K.M. Foley, D. Kang, R. Mathur, T. Pierce, and S.T. Rao. 2011. Dynamic evaluation of regional air quality model’s response to emission reductions in the presence of uncertain emission inventories. Atmos. Environ. 45:4091–4098. doi: 10.1016/j.atmosenv.2011.03.030.
- Council, N. R. 2004. Air Quality Management in the United States. Washington, DC: National Academies Press. doi: 10.17226/10728.
- Pachon, J.E., S. Balachandran, Y. Hu, J.A. Mulholland, L.A. Darrow, J.A. Sarnat, P.E. Tolbert, and A.G. Russell. 2012. Development of outcome-based, multipollutant mobile source indicators. J. Air Waste Manage. Assoc. 62:431–442. doi: 10.1080/10473289.2012.656218.
- Parker, J.D., P. Mendola, and T.J. Woodruff. 2008. Preterm birth after the Utah Valley Steel Mill closure: A natural experiment. Epidemiology 19:820–823. doi: 10.1097/EDE.0b013e3181883d5d.
- Peel, J.L., M. Klein, W.D. Flanders, J.A. Mulholland, and P.E. Tolbert; HEI Health Review Committee. 2010. Impact of improved air quality during the 1996 Summer Olympic Games in Atlanta on multiple cardiovascular and respiratory outcomes. Res. Rep. Health Eff. Inst. Apr(148):3–23;discussion 25–33. https://www.ncbi.nlm.nih.gov/pubmed/20575278
- Pegues, A.H., D.S. Cohan, A. Digar, C. Douglass, and R.S. Wilson. 2012. Efficacy of recent state implementation plans for 8-hour ozone. J. Air Waste Manage. Assoc. 62:252–261. doi: 10.1080/10473289.2011.646049.
- Peters, A., S. Breitner, J. Cyrys, M. Stölzel, M. Pitz, G. Wölke, J. Heinrich, W. Kreyling, H. Küchenhoff, and H.-E. Wichmann. 2009. The influence of improved air quality on mortality risks in Erfurt, Germany. Res. Rep. Health. Eff. Inst. Feb(137):5–77:discussion 79–90. https://www.ncbi.nlm.nih.gov/pubmed/19554968 (accessed November 16, 2016).
- Peters, J., A.J. Hedley, C.M. Wong, T.H. Lam, S.G. Ong, J. Liu, and D.J. Spiegelhalter. 1996. Effects of ambient air pollution and environmental tobacco smoke on respiratory health of non-smoking women in Hong Kong. Int. J. Epidemiol. 28:859–864. doi: 10.1093/ije/28.5.859.
- Pierce, T., C. Hogrefe, S. Trivikrama Rao, P.S. Porter, and J.-Y. Ku. 2010. Dynamic evaluation of a regional air quality model: Assessing the emissions-induced weekly ozone cycle. Atmos. Environ. 44:3583–3596. doi: 10.1016/j.atmosenv.2010.05.046.
- Pierson, W.R., A.W. Gertler, and R.L. Bradow. 1990. Comparison of the SCAQS tunnel study with other on-road vehicle emissions data. J. Air Waste Manage. Assoc. 40:1495–1504. doi: 10.1080/10473289.1990.10466799.
- Pope, C. 1989. Respiratory disease associated with community air pollution and a steel mill, Utah Valley. Am. J. Public Health 79:623–628. doi:10.2105/AJPH.79.5.623
- Pope, C.A. 1991. Respiratory hospital admissions associated with PM10 pollution in Utah, Salt Lake, and Cache Valleys. Arch. Environ. Health 46:90–97. doi: 10.1080/00039896.1991.9937434.
- Pope, C.A., M. Ezzati, and D.W. Dockery. 2009. Fine-particulate air pollution and life expectancy in the United States. N. Engl. J. Med. 360:376–386. doi: 10.1056/NEJMsa0805646.
- Pope, C.A., M. Ezzati, and D.W. Dockery. 2012. Validity of observational studies in accountability analyses: The case of air pollution and life expectancy. Air Qual. Atmos. Health 5:231–235. doi: 10.1007/s11869-010-0130-3.
- Pope, C.A., J. Schwartz, and M.R. Ransom. 1992. Daily mortality and PM10 pollution in Utah Valley. Arch. Environ. Health 47:211–217. doi: 10.1080/00039896.1992.9938351.
- Ransom, M.R., and C.A. Pope. 1992. Elementary school absences and PM10 pollution in Utah Valley. Environ. Res. 58:204–219. doi: 10.1016/S0013-9351(05)80216-6.
- Rao, S., E. Zalewsky, and I. Zurbenko. 1995. Determining temporal and spatial variations in ozone air quality. J. Air Waste Manage. Assoc. 45:57–61. doi:10.1080/10473289.1995.10467342
- Rao, S., and I. Zurbenko. 1994. Detecting and tracking changes in ozone air quality. J. Air Waste Manage. Assoc. 44:1089–1092. doi:10.1080/10473289.1994.10467303
- Rich, D.Q., H.M. Kipen, W. Huang, G. Wang, Y. Wang, P. Zhu, P. Ohman-Strickland, et al. 2012. Association between changes in air pollution levels during the Beijing Olympics and biomarkers of inflammation and thrombosis in healthy young adult. JAMA 307:2068–2078. doi: 10.1001/jama.2012.3488.
- Rich, D.Q., K. Liu, J. Zhang, S.W. Thurston, T.P. Stevens, Y. Pan, C. Kane, et al. 2015. Differences in birth weight associated with the 2008 Beijing Olympic air pollution reduction: Results from a natural experiment. Environ. Health Perspect. 117:1713–1717. doi: 10.1289/ehp.1408795.
- Russell, M.C., J.H. Belle, and Y. Liu. 2016. The impact of three recent coal-fired power plant closings on Pittsburgh air quality: A natural experiment. J. Air Waste Manage. Assoc. doi: 10.1080/10962247.2016.1170738.
- Schreifels, J.J., Y. Fu, and E.J. Wilson. 2012. Sulfur dioxide control in China: Policy evolution during the 10th and 11th Five-year Plans and lessons for the future. Energy Policy 48:779–789. doi: 10.1016/j.enpol.2012.06.015.
- Sickles, J.E., II, and D.S. Shadwick. 2014. Air quality and atmospheric deposition in the eastern US: 20 years of change. Atmos. Chem. Phys. 14, 173–197. doi: 10.5194/acp-15-173-2015.
- Simon, H., K.R. Baker, F. Akhtar, S.L. Napelenok, N. Possiel, B. Wells, and B. Timin. 2013. A direct sensitivity approach to predict hourly ozone resulting from compliance with the national ambient air quality standard. Environ. Sci. Technol. 47:2304–2313. doi: 10.1021/es303674e.
- Simon, H., K.R. Baker, and S. Phillips. 2012. Compilation and interpretation of photochemical model performance statistics published between 2006 and 2012. Atmos. Environ. 61:124–139. doi: 10.1016/j.atmosenv.2012.07.012.
- Simon, H., A. Reff, B. Wells, J. Xing, and N. Frank. 2015. Ozone trends across the United States over a period of decreasing NOx and VOC emissions. Environ. Sci. Technol. 49:186–195. doi: 10.1021/es504514z.
- Sisler, J.F., and W.C. Malm. 2000. Interpretation of trends of PM2.5 and reconstructed visibility from the IMPROVE Network. J. Air Waste Manage. Assoc. 50:775–789. doi: 10.1080/10473289.2000.10464127.
- Souri, A.H., Y. Choi, W. Jeon, X. Li, S. Pan, L. Diao, and D.A. Westenbarger. 2016. Constraining NOx emissions using satellite NO2 measurements during 2013 DISCOVER-AQ Texas campaign. Atmos. Environ. 131:371–381. doi: 10.1016/j.atmosenv.2016.02.020.
- Streets, D.G., T. Canty, G.R. Carmichael, B. De Foy, R.R. Dickerson, B.N. Duncan, D.P. Edwards, et al. 2013. Emissions estimation from satellite retrievals: A review of current capability [review]. Atmos. Environ. 77:1011–1042. doi: 10.1016/j.atmosenv.2013.05.051.
- Su, C., R. Hampel, U. Franck, A. Wiedensohler, J. Cyrys, X. Pan, H.E. Wichmann, A. Peters, A. Schneider, and S. Breitner. 2015. Assessing responses of cardiovascular mortality to particulate matter air pollution for pre-, during- and post-2008 Olympics periods. Environ. Res. 142:112–122. doi: 10.1016/j.envres.2015.06.025.
- Tagaris, E., K. Manomaiphiboon, K.J. Liao, L.R. Leung, J.H. Woo, S. He, P. Amar, and A.G. Russell. 2007. Impacts of global climate change and emissions on regional ozone and fine particulate matter concentrations over the United States. J. Geophys. Res. Atmos. 112:D14312. doi: 10.1029/2006JD008262.
- U.S. Environmental Protection Agency. 1997a. Regulatory Impact Analysis: Control of Emissions of Air Pollution from Highway Heavy-Duty Engines. U.S. Environmental Protection Agency, Office of Air and Radiation Office of Mobile Sources, Engine Programs and Compliance Division. https://web.archive.org/web/20090511192924/http://epa.gov/otaq/regs/hd-hwy/1997frm/hwy-ria.pdf (accessed April 6, 2015).
- U.S. Environmental Protection Agency. 1997b. The Benefits and Costs of the Clean Air Act, 1970 to 1990. https://www.epa.gov/sites/production/files/2015-06/documents/contsetc.pdf (accessed January 13, 2016).
- U.S. Environmental Protection Agency. 1999a. The Benefits and Costs of the Clean Air Act 1990 to 2010. EPA Report to Congress. Office of Policy. EPA-410-R-99-001 https://www.epa.gov/sites/production/files/2015-07/documents/fullrept.pdf (accessed January 13, 2016).
- U.S. Environmental Protection Agency. 1999b. Regulatory Impact Analysis - Control of Air Pollution from New Motor Vehicles: Tier 2 Motor Vehicle Emissions Standards and Gasoline Sulfur Control Requirements. Engine Programs and Compliance Division, Office of Mobile Sources, U.S. Environmental Protection Agency. EPA420-R-99-023 https://nepis.epa.gov/Exe/ZyPDF.cgi/P100F1UV.PDF?Dockey=P100F1UV.PDF (accessed June 6, 2013).
- U.S. Environmental Protection Agency. 2005a. Regulatory Impact Analysis of the Final Clean Air Mercury Rule. EPA-452/R-05-003. https://www3.epa.gov/ttnecas1/regdata/RIAs/mercury_ria_final.pdf (accessed March 30, 2016).
- U.S. Environmental Protection Agency. 2005b. Regulatory Impact Analysis for the Final Clean Air Interstate Rule. EPA-452/R-05-002. https://archive.epa.gov/airmarkets/programs/cair/web/pdf/finaltech08.pdf (accessed June 6, 2013).
- U.S. Environmental Protection Agency. 2011. The Benefits and Costs of the Clean Air Act from 1990 to 2020 Final Report. Office of Air and Radiation. https://www.epa.gov/sites/production/files/2015-07/documents/fullreport_rev_a.pdf (accessed June 6, 2013).
- U.S. Environmental Protection Agency. 2015a. 2014 NEI Plan 1–17. https://www.epa.gov/air-emissions-inventories/2014-national-emissions-inventory-nei-plan (accessed September 1, 2016).
- U.S. Environmental Protection Agency. 2015b. Regulatory Impact Analysis for the Clean Power Plan Final Rule. EPA-452/R-15-003. Research Triangle Park, NC: U.S. Environmental Protection Agency, Office of Air and Radiation, Office of Air Quality Planning and Standards.
- U.S. Environmental Protection Agency. 2016. Air Markets Program Data. https://ampd.epa.gov/ampd/ (accessed February 2016).
- van der A., R.J., B. Mijling, J. Ding, M.E. Koukouli, F. Liu, Q. Li, H. Mao, and N. Theys. 2016. Cleaning up the air: Effectiveness of air quality policy for SO2 and NOx emissions in China. Atmos. Chem. Phys. Discuss. doi: 10.5194/acp-2016-445.
- Van Erp, A.M., and A.J. Cohen. 2009. Communication 14: HEI’s Research Program on the Impact of Actions to Improve Air Quality: Interim Evaluation and Future Directions. Boston, MA: Health Effects Institute.
- Van Erp, A.M., F.J. Kelly, K.L. Demerjian, C.A. Pope, and A.J. Cohen. 2011. Progress in research to assess the effectiveness of air quality interventions towards improving public health. Air Qual. Atmos. Health 5:217–230. doi: 10.1007/s11869-010-0127-y.
- Vijayaraghavan, K., A. DenBleyker, L. Ma, C. Lindhjem, and G. Yarwood. 2014. Trends in on-road vehicle emissions and ambient air quality in Atlanta, Georgia, USA, from the late 1990s through 2009. J. Air Waste Manage. Assoc. 64:808–816. doi:10.1080/10962247.2014.892039.
- Wang, B., M. Shao, S.H. Lu, B. Yuan, Y. Zhao, M. Wang, S.Q. Zhang, and D. Wu. 2010. Variation of ambient non-methane hydrocarbons in Beijing city in summer 2008. Atmos. Chem. Phys. 10:5911–5923. doi: 10.5194/acp-10-5911-2010.
- Wang, M., U. Gehring, G. Hoek, M. Keuken, S. Jonkers, R. Beelen, M. Eeftens, D.S. Postma, and B. Brunekreef. 2015. Air pollution and lung function in dutch children: A comparison of exposure estimates and associations based on land use regression and dispersion exposure modeling approaches. Environ. Health Perspect. 123:847–851. doi: 10.1289/ehp.1408541.
- Wang, M., T. Zhu, J. Zheng, R.Y. Zhang, S.Q. Zhang, X.X. Xie, Y.Q. Han, and Y. Li. 2009. Use of a mobile laboratory to evaluate changes in on-road air pollutants during the Beijing 2008 Summer Olympics. Atmos. Chem. Phys. 9:12857–12898. doi: 10.5194/acpd-9-12857-2009.
- Wang, S., J. Xing, B. Zhao, C. Jang, and J. Hao. 2014. Effectiveness of national air pollution control policies on the air quality in metropolitan areas of China. J. Environ. Sci. 26:13–22. doi: 10.1016/S1001-0742(13)60381-2.
- Wang, S., M. Zhao, J. Xing, Y. Wu, Y. Zhou, Y. Lei, K. He, L. Fu, and J. Hao. 2010. Quantifying the air pollutants emission reduction during the 2008 Olympic Games in Beijing. Environ. Sci. Technol. 44:2490–2496. doi: 10.1021/es9028167.
- Wang, T., and S. Xie. 2009. Assessment of traffic-related air pollution in the urban streets before and during the 2008 Beijing Olympic Games traffic control period. Atmos. Environ. 43:5682–5690. doi: 10.1016/j.atmosenv.2009.07.034.
- Wang, W., T. Primbs, S. Tao, and S.L. M. Simonich. 2009. Atmospheric particulate matter pollution during the 2008 Beijing Olympics. Environ. Sci. Technol. 43:5314–5320. doi: 10.1029/2006JD007448.Xiaohong.
- Wang, X., D. Westerdahl, L.C. Chen, Y. Wu, J. Hao, X. Pan, X. Guo, and K.M. Zhang. 2009. Evaluating the air quality impacts of the 2008 Beijing Olympic Games: On-road emission factors and black carbon profiles. Atmos. Environ. 43:4535–4543. doi: 10.1016/j.atmosenv.2009.06.054.
- Wang, Y., J. Hao, M.B. McElroy, J.W. Munger, H. Ma, D. Chen, and C.P. Nielsen. 2009. Ozone air quality during the 2008 Beijing Olympics—Effectiveness of emission restrictions. Atmos. Chem. Phys. Discuss. 9:9927–9959. doi: 10.5194/acpd-9-9927-2009.
- Weaver, C.P., X.Z. Liang, J. Zhu, P.J. Adams, P. Amar, J. Avise, M. Caughey, et al. 2009. A preliminary synthesis of modeled climate change impacts on U.S. regional ozone concentrations. Bull. Am. Meteorol. Soc. 90:1843–1863. doi: 10.1175/2009BAMS2568.1.
- Wong, C.-M., A. Rabl, T.Q. Thach, Y.K. Chau, K.P. Chan, B.J. Cowling, H.K. Lai, T.H. Lam, S.M. McGhee, H.R. Anderson, et al. 2012. Impact of the 1990 Hong Kong legislation for restriction on sulfur content in fuel. Res. Rep. Health Eff. Inst. Aug(170):5–91. https://www.ncbi.nlm.nih.gov/pubmed/23316618
- Wong, C.M., T.H. Lam, J. Peters, A.J. Hedley, S.G. Ong, A.Y. Tam, J. Liu, and D.J. Spiegelhalter. 1998. Comparison between two districts of the effects of an air pollution intervention on bronchial responsiveness in primary school children in Hong Kong. J. Epidemiol. Community Health 52:571–578. doi: 10.1136/jech.52.9.571.
- Wu, S., F. Deng, J. Niu, Q. Huang, Y. Liu, and X. Guo. 2010. Association of heart rate variability in taxi drivers with marked changes in particulate air pollution in Beijing in 2008. Environ. Health Perspect. 118:87–91. doi: 10.1289/ehp.0900818.
- Wyat Appel, K., P.V. Bhave, A.B. Gilliland, G. Sarwar, and S.J. Roselle. 2008. Evaluation of the Community Multiscale Air Quality (CMAQ) model version 4.5: Sensitivities impacting model performance; Part II—Particulate matter. Atmos. Environ. 42:6057–6066. doi: 10.1016/j.atmosenv.2008.03.036.
- Xing, J., Y. Zhang, S. Wang, X. Liu, S. Cheng, Q. Zhang, Y. Chen, et al. 2011. Modeling study on the air quality impacts from emission reductions and atypical meteorological conditions during the 2008 Beijing Olympics. Atmos. Environ. 45:1786–1798. doi: 10.1016/j.atmosenv.2011.01.025.
- Yuan, Z., V. Yadav, J.R. Turner, P.K.K. Louie, and A.K.H. Lau. 2013. Long-term trends of ambient particulate matter emission source contributions and the accountability of control strategies in Hong Kong over 1998–2008. Atmos. Environ. 76:21–31. doi: 10.1016/j.atmosenv.2012.09.026.
- Zigler, C., and F. Dominici. 2016. Demystifying causal inference in air pollution epidemiology. Presented at Health Effects Institute Annual Conference, Denver, CO, May 1–3.
- Zigler, C.M., and F. Dominici. 2014. Point: Clarifying policy evidence with potential-outcomes thinking—Beyond exposure-response estimation in air pollution epidemiology. Am. J. Epidemiol. 180:1133–1140. doi: 10.1093/aje/kwu263.
- Zigler, C.M., F. Dominici, and Y. Wang. 2012. Estimating causal effects of air quality regulations using principal stratification for spatially correlated multivariate intermediate outcomes. Biostatistics 13:289–302. doi: 10.1093/biostatistics/kxr052.
- Zigler, C.M., C. Kim, C. Choirat, J.B. Hansen, Y. Wang, L. Hund, J. Samet, and F. Dominici; HEI Health Committee. 2016. Causal inference methods for estimating long-term health effects of air quality regulations. Res. Rep. Health Eff. Inst. May(187):5–49. https://www.ncbi.nlm.nih.gov/pubmed/27526497