
ABSTRACT
This study integrates the relationship between measured surface concentrations of particulate matter 10 μm or less in diameter (PM10), satellite-derived aerosol optical depth (AOD), and meteorology in Roda, Virginia, during 2008. A multiple regression model was developed to predict the concentrations of particles 2.5 μm or less in diameter (PM2.5) at an additional location in the Appalachia region, Bristol, TN. The model was developed by combining AOD retrievals from Moderate Resolution Imaging Spectro-radiometer (MODIS) sensor on board the EOS Terra and Aqua Satellites with the surface meteorological observations. The multiple regression model predicted PM2.5 (r2 = 0.62), and the two-variable (AOD-PM2.5) model predicted PM2.5 (r2 = 0.4). The developed model was validated using particulate matter recordings and meteorology observations from another location in the Appalachia region, Hazard, Kentucky. The model was extrapolated to the Roda, VA, sampling site to predict PM2.5 mass concentrations. We used 10 km x 10 km resolution MODIS 550 nm AOD to predict ground level PM2.5. For the relevant period in 2008, in Roda, VA, the predicted PM2.5 mass concentration is 9.11 ± 5.16 μg m-3 (mean ± 1SD).
Implications: This is the first study that couples ground-based Particulate Matter measurements with satellite retrievals to predict surface air pollution at Roda, Virginia. Roda is representative of the Appalachian communities that are commonly located in narrow valleys, or “hollows,” where homes are placed directly along the roads in a region of active mountaintop mining operations. Our study suggests that proximity to heavy coal truck traffic subjects these communities to chronic exposure to coal dust and leads us to conclude that there is an urgent need for new regulations to address the primary sources of this particulate matter.
Introduction
The Appalachian Mountains encompass regions with rich coal deposits. The controversial coal-mining practice in the region, of stripping off the tops of mountains, is causing both air (Aneja et al., Citation2012) and water (Palmer et al., Citation2010; Gilbert, Citation2010) pollution problems. For efficient extraction of coal, temperate deciduous forests are cleared, topsoil is stripped off, and overburden and interburden rocks are broken apart and removed from above and between coal seams (Palmer et al., Citation2010). The excess rocks and dirt that do not fit back onto the disturbed ridgeline are dumped into adjacent valleys where they bury headwater streams (Office of Surface Mining Reclamation and Enforcement, 2010). As a consequence, the downstream water quality deteriorates (Hendryx and Ahern, Citation2009). The environmental issues associated with mountaintop mining with valley fills include disturbances in the biological communities and their physical environments. These disturbances in the ecosystem balance are associated with biodiversity loss, erosion, soil and water contamination, and particulate matter pollution (Palmer et al., Citation2010). As a result of the stress on the natural environment caused by these mining activities, the health and welfare of the surrounding human populations are adversely affected (Ahren et al., Citation2011; EPA, Citation2009). However, the impacts of surface coal mining on air quality have only been sparsely addressed (Aneja et al., Citation2012) and therefore require comprehensive and systematic monitoring and analysis.
The activities associated with surface coal mining, including topsoil removal, drilling, blasting, coal handling operations, coal hauling, transportation and dumping of overburden, and wind erosion of exposed surface, all inject particulate matter (PM) into the atmosphere. Major air pollutants near the surface coal mines were total suspended particulate matter and respirable particulate matter (Ghose and Majee, Citation2000; Ghose and Majee, Citation2007). The emission inventory for the Greater Metropolitan Region of New South Wales, Australia (Department of Environment and Climate Change, NSW, Citation2008), reported that the coal mining industry was the largest industrial emitter of fine particles, particles with aerodynamic diameter ≤10 μm, PM10 (~34% of total anthropogenic emissions), and particles with aerodynamic diameter ≤2.5 μm, PM2.5 (~14%) in 2008. Ghose (Citation2007) reported that drilling operations and wind erosion of coal stockpiles were respectively the two major dust sources in the mining area. Vehicular traffic on haul roads was identified as the largest source of fugitive dust, and can even contribute 80% of total dust emission (Ghose, Citation2007). The complex topography of the region often leads residents to build their houses very close to coal mine haul roads (Aneja et al., Citation2012). Coal hauling trucks entrain the temporal buildup of pollutants owing to reduced ventilation of these particulate emissions. PM in the atmosphere has a strong statistical correlation with increased hospitalization, emergency room visits, and self-dosage by asthma patients (Health Effects Institute [HEI], Citation2004). According to the World Health Organization Air Quality Guidelines of 2005 (WHO AQG: WHO, Citation2005), public authorities should take actions at the regional, national, and international levels to reduce human exposure to these air pollutants. Analysis of live births during 1996–2003 in the four states in the Central Appalachian region—Kentucky (KY), Tennessee (TN), Virginia (VA), and West Virginia (WV)—identified that both socioeconomic and environmental disturbances in mountaintop mining areas may be major factors contributing to elevated birth defect rates (Ahern et al., Citation2011).
Aneja et al. (Citation2012) conducted particulate matter measurements at Campbell (mine site) and at Willis, a Roda, VA, community where people live in the narrow hollows with their homes placed directly along the roads. These narrow hollows are located immediately below the mountains and between the mountaintops (Kurth et al., Citation2015). Proximity to the roads, having heavy traffic of the coal hauling trucks, and the poor ventilation owing to the complex topography of the region both add severity in the air quality problem of the region. Aneja et al. in Citation2012 identified coal hauling as the major contributor to the PM10 in the Roda community. The levels of respirable particulate matter were up to three times the National Ambient Air Quality Standard (NAAQS) of 150 μg m−3 (Aneja et al., Citation2012). In agreement with Ghose (Citation2006), Aneja et al. (Citation2012) also suggested trucks carrying materials from mining site as the major contributor to elevated levels of particulate matter in the Appalachian region. Based on their study, even though the particulate matter pollution in the eastern United States has been reduced significantly over the last 30 years, the observed PM10 mass concentration in Roda, VA, which is representative of the Appalachian coal mining region, showed significant PM10 levels compared to major cities in the eastern United States. The same study also revealed the presence of antimony, arsenic, beryllium, cadmium, chromium, cobalt, lead, manganese, mercury, nickel, and selenium in the collected samples from both Campbell and Willis (a group of metals identified as toxic or potentially toxic by the U.S. EPA National Ambient Air Toxics program). Moreover, all of these metals present in the Roda samples were known to be present in coal (Finkelman, Citation1995). Many states have adopted strategies or control measures that were typically included within the State Implementation Plans (SIPs) adopted pursuant to the Clean Air Act, to limit emissions of criteria air pollutants such as particulate matter. However, the SIP standards for fugitive dust emissions are ambiguous, and thus potentially unenforceable—such as the requirement in the Virginia SIP that coal mine operators take “reasonable precautions” to control fugitive dust but without specifying the “precautions” that must be taken. Therefore, monitoring and analysis of particulate matter on a regular basis will have significant contributions in improving the management of dust emissions associated with coal mining (Department of Environment and Climate Change and Water, The NSW Department of Planning and Industry & Investment, Citation2010).
Because the ground-based observations of particulate matter concentrations are limited in both space and time, it is important to determine the potential of satellite-based observations in understanding the particulate matter pollution in this region. Satellite-derived aerosol optical depth (AOD) has significant spatial and temporal coverage and therefore is a potential candidate as a surrogate for predicting the surface air quality. The studies conducted in the past, in different regions of the world, attempted to estimate the surface PM2.5 or PM10 from ground-measured or satellite-derived aerosol optical depth (AOD, τ) (Engel-Cox et al., Citation2006; Filip and Stefan, Citation2011; Pelletier et al., Citation2007; van Donkelaar et al., Citation2006; van Donkelaar et al., Citation2010; van Donkelaar et al., Citation2011). These studies demonstrated the promising predictive power of satellite derived AODs for fine particulate matter. The objective of the current study is to estimate the extent of surface particulate matter pollution in Roda, VA, a community representative of other communities in the Appalachian coal mining region. Based on Virginia county-wide surface coal production data for 2008, Wise County had the largest production of surface coal in 2008. We conducted air sampling of PM10 (but not PM2.5) during August 3–14, 2008, at two locations in the small community of Roda, VA, located very near to mountaintop mining sites.
As part of this analysis, a multiple regression model was developed by combining satellite retrievals of AOD with ground-based meteorology and particulate matter measurements at an additional location in Bristol, TN. The observed PM2.5 concentrations at another location in Hazard, KY, are used to validate the regression relation. This relation is then extrapolated to our measurement site (Roda, VA) to predict the surface PM2.5 concentrations. The current study demonstrates the potential of combining spatially and temporally frequent satellite AOD retrievals with meteorological observations, in regions devoid of air quality monitoring, to understand the surface particulate matter pollution.
Data and methodology
Site description
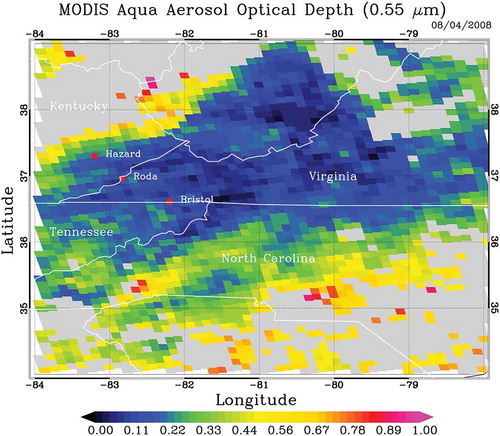
PM10 measurements were conducted at two locations in Roda, VA (). The sampling sites, Campbell (36º57′35″ N, 82º49′57″ W, 592 m) and Willis (36º57′8″ N, 82º49′14″ W, 568 m), are approximately 1 mile apart (Aneja et al., Citation2012). Around the time of the measurements, about 44% of Virginia’s surface coal production was taking place in Wise County (U.S. Energy Information Administration [EIA], Citation2008). The Campbell site is located along a haul road very near to the entrance of various coal mines, and therefore observations from this site represent PM emissions from the haul road with potential contributions from the mine sites. The Willis site is located along the same haul road approximately 1 mile away from the Campbell site and coal mines, and therefore represents the microenvironment to which the residents in Roda are exposed (Aneja et al., Citation2012).
Figure 1. Particulate matter measurements during August 3–14, 2008, were conducted at two locations in Roda, VA, at the Campbell site (a mine site) and at the Willis site (a site close to the haul road). The air quality and meteorology data from the two closest stations to the Roda, VA, used in this study include Bristol, TN, and Hazard, KY. The Aqua MODIS aerosol optical depth at 550 nm on August 4, 2008, is also shown.
Particulate matter measurement
Air sampling of PM10 was conducted for twelve days during August 3–14, 2008, at Campbell and Willis sites in Roda, VA (). By comparing the observations of particulate matter concentrations between the mine site (Campbell) and the location along the haul road (Willis), we can identify the contribution from coal hauling. The PM10 samplers used are Andersen/GMW model GUV-16H high-volume air samplers with size-selective inlets to collect particles with effective aerodynamic size smaller than 10 µm. Calibration and operation of the samplers were performed in accordance with the manufacturer’s specifications and the Environmental Protection Agency (EPA) regulations (EPA, 1983). Laboratory calibrations of the samplers are conducted prior to and after the field deployment. Moreover, the on-site calibration was performed every day during the measurement period. The sampling was conducted for 24 hr continuously for the 12 days. A detailed description of the site characteristics and the PM samplers used, along with the sampling method, is provided in Aneja et al. (Citation2012).
Air quality data
The air quality data were obtained from the two official PM monitoring stations located nearest to Roda, VA: one in Bristol, TN (36.608 N; 82.164 W, 550 m elevation), and the other in Hazard, KY (37.283 N; 83.209W, 280 m elevation) (). These data were downloaded from the EPA’s Air Quality System (AQS) AirData website (http://www.epa.gov/airquality/airdata). The 24-hr-averaged PM2.5 data were available with 2-day intervals at Bristol for all of 2008 and PM2.5, and PM10 data with 6-day intervals were available at Hazard from January to May 2008.
Meteorology
The daily average meteorological data—including air temperature (°F), relative humidity (%), wind speed (miles/hr), surface pressure (inches), and rainfall (inches)—were obtained for Bristol, TN (36°37’39’’ N; 82°10’15’’ W), Hazard, KY (37°24’43’’ N; 83°25’26’’ W), and Roda, VA (36.97° N, 82.56° W). These data were downloaded from the National Weather Service. Days with reported rainfall events are excluded from the analysis.
Satellite data
Satellite-derived AOD retrievals from Moderate Resolution Imaging Spectro-radiometer (MODIS) sensor onboard the Earth Observing System (EOS) Terra and Aqua satellites are available in high spatial and temporal resolutions. By collocating MODIS collection-5 aerosol optical depth (AOD) with the Aerosol Robotic Network (AERONET) AOD, Levy et al. (Citation2010) suggested that over land the estimated uncertainty of MODIS AOD falls within the error bounds of ±0.15τ ± 05. The MODIS 3-km and 10-km aerosol data were obtained from the National Aeronautics and Space Administration (NASA) Goddard Space Flight Center Web interface to the Level 1 and Atmosphere Archive and Distribution System (LAADS) (http://ladsweb.nascom.nasa.gov/data). MODIS Terra and Aqua level 2, collection 5.1, high-confidence retrievals of 550 nm AOD at 10 km × 10 km resolution are used in this study. The results are also compared with 3-km AOD retrievals from the MODIS Aqua satellite.
Weather Research and Forecasting (WRF) model simulation
The state-of-the-art Weather Research and Forecasting (WRF) model version 3.5.1 was used to simulate the meteorology of the study region centered at latitude 37.4° N, longitude –83.1° W. Three model domains with 9 × 9 km2, 3 × 3 km2, and 1 × 1 km2 horizontal resolutions with 51 vertical levels from ~8 m to ~20 km above ground level (AGL) were chosen for this simulation. The sizes of these three horizontal domains are respectively 810 km × 774 km, 453 km × 453 km, and 283 km × 268 km. The Yonsei University (YSU) Planetary Boundary Layer (PBL) parameterization scheme (Hong et al., Citation2006; Hu et al., Citation2013) is used in this simulation along with the revised MM5 surface layer scheme (Jiménez et al., Citation2012), Noah land surface model (LSM) (Tewari et al., Citation2004), WRF single-moment 5-class microphysics (Hong et al., Citation2004), RRTMG long-wave and short-wave radiation (Iacono et al., Citation2008), and Kain–Fritsch cumulus schemes (Kain, Citation2004). National Centers for Environmental Prediction (NCEP) North American Mesoscale (NAM) analysis data (6 hourly at 12 km horizontal grid resolution) (Rogers et al., Citation2009) are used for the initial and boundary conditions of WRF meteorological fields. The WRF model is run from 12 UTC on August 2 to 0 UTC on August 15, 2008. WRF outputs corresponding to the first 12 hr are excluded from this analysis. Output files are produced every 10 min and outputs from the 1-km (inner) domain are used in this study.
Methodology
MODIS 550 nm AOD with best quality data (quality assurance [QA] data flag = 3) are integrated with ground-based particulate matter and meteorological observations for the selected three stations (Bristol, TN; Roda, VA; and Hazard, KY) in the Appalachian region. As a first step in the integration, these data are collocated in both space and time. Days with reported rainfall events are excluded from this analysis, as these are washout events that reduce the concentrations of particulate matter in the air.
Based on the spatially and temporally coincident AOD and meteorology data, a multiple-regression model was developed for the surface PM2.5 for Bristol, TN, for the year 2008. Even though 3-km AOD were able to resolve fine aerosol features such as smoke plumes over land and ocean significantly better than the 10-km AOD (Remer et al., 2013), their data frequency is considerably small. Moreover, our sampling was conducted for a limited period. For these reasons, we included 10 km × 10 km AOD in the development of the regression relation. We used high-confidence (quality flag = 3) 550-nm AOD, and only cloud-free pixels are selected in this study. To collocate the satellite-derived AODs with ground-based measurements, we employ either a minimum distance method or an average method (Cheng et al., Citation2012). In the minimum-distance method, the satellite pixel closest in distance to the surface station is selected and paired with the surface measurement that is closest in time to the satellite overpass. In the second method, an averaging is done for the high-confidence (quality flag = 3 and cloud-free) retrievals of satellite pixels within a selected distance around the surface station. This is then paired with the surface measurements averaged over an appropriate time range. In this study, we chose the method of averaging to collocate the satellite AOD with the surface measurements.
At Bristol, TN, the collocated data are subjected to bivariate analysis between AOD and surface PM2.5 and multivariate analysis by additionally incorporating meteorological parameters to derive an empirical relation for the surface PM2.5. Once the particulate matter is released or formed in the atmosphere, its vertical and horizontal transports are governed by the meteorological conditions prevailing in the region. Since we are deriving an empirical relation for the surface particulate matter concentration based on satellite-derived AOD, which is a measure of the aerosol loading in the total atmospheric column, the incorporation of surface meteorology—such as surface temperature, relative humidity, wind speed, and surface pressure—may improve this prediction. Days with reported rainfall events were excluded to avoid the aerosol washout events. Before extending it to study the surface particulate matter concentrations in Roda, VA, the derived empirical relation was evaluated using the PM2.5 observations at Hazard, KY. The background conditions were not quantified and removed from the concentration of PM10 contributed by the coal hauling.
Results and discussion
As we discussed earlier, a bivariate model is developed to find the association between AOD and PM2.5. The linear relationship between AOD and PM2.5 at Bristol, TN, is
The r2 corresponding to the AOD–PM2.5 relation is 0.40 and is within the range of r2 (0.19–0.74) reported for cities in the eastern United States by Engel-Cox et al. (2004). In addition to the impact of humidity on its optical properties, meteorology plays important roles in the vertical distribution, dispersion, and settling of the atmospheric particulate matter. Therefore, incorporating meteorology in deriving the AOD–PM2.5 relationship is expected to improve the prediction of surface particulate matter. A multiple regression model is developed between meteorological parameters and MODIS AOD for predicting the surface PM2.5 at Bristol, TN:
where AOD is the aerosol optical depth at 550 nm; T is the air temperature (ºF); RH is the relative humidity (%); WS is the wind speed (mph); and P is the surface pressure (inches). Days with reported rainfall events are excluded in the derivation of this regression relation. and show the estimated PM2.5 along with the observations at Bristol, TN, based respectively on the two-variable simple regression model and the multivariate regression model. An important factor governing the successful prediction of PM2.5 from AOD is the vertical distribution of aerosols in the atmosphere. For an unstable atmosphere, the well-mixed boundary layer may result in an improved linear AOD–PM2.5 relationship and vice versa. For this reason, even though AOD can be used as a surrogate for the surface particulate matter concentrations, meteorology plays a significant role in the extent to which the respective values correspond (). With the incorporation of meteorology in the estimation of the surface PM2.5 concentration, r2 improved from 0.40 to 0.62. Our results suggest that meteorology plays an important role in determining the air quality of the study region. The model was evaluated and validated based on PM2.5 observations from Hazard, KY ().
Figure 2. For 2008, the observed PM2.5 is compared with the regression models predicted PM2.5 at Bristol, TN (a and b). The PM2.5 multiple regression model for Bristol, TN, is evaluated and validated at Hazard, KY (c). (a) Two-variable (AOD) regression model-predicted PM2.5. (b) Multiple-regression model-predicted PM2.5. (c) The observed PM2.5 is compared with multiple-regression model-predicted PM2.5 for Hazard, KY. The PM2.5 values for August (during the time measurements were made) are highlighted in gray (± 1SD for both observed and predicted PM2.5 is also shown).
The developed model was then extended to Roda, VA, to predict the surface particulate matter concentrations ( and ). We also compared results from the two-variable (AOD–PM2.5) model () with the multiple-regression (AOD–PM2.5–meteorology) model results ().
Figure 3. PM10 sampled at the Campbell site (PM10_C) and the Willis site (PM10_W) are shown during August 3–14, 2008 (Source: Aneja et al. [Citation2012]). The spatially and temporally collocated satellite aerosol optical depth (AOD) for MODIS Terra (10 × 10 km2 as Terra_10km), and Aqua (10 ×10 km2 as Aqua_10m) are shown. The multiple-regression model-predicted PM2.5 is also shown.
![Figure 3. PM10 sampled at the Campbell site (PM10_C) and the Willis site (PM10_W) are shown during August 3–14, 2008 (Source: Aneja et al. [Citation2012]). The spatially and temporally collocated satellite aerosol optical depth (AOD) for MODIS Terra (10 × 10 km2 as Terra_10km), and Aqua (10 ×10 km2 as Aqua_10m) are shown. The multiple-regression model-predicted PM2.5 is also shown.](/cms/asset/e755ef4d-e7af-431b-bef9-431520e7f79c/uawm_a_1245686_f0003_oc.jpg)
Figure 4. For Roda, VA, (a) the MODIS aerosol optical depth at 550 nm is compared with multiple regression model predicted PM2.5 for the year 2008, and (b) the observed PM10 is compared with multiple regression model (eq 2) predicted PM2.5 during August 3–14, 2008 (± 1SD for both observed and predicted PM2.5 is also shown).
Before applying the developed multiple regression model for predicting surface air quality at Roda, VA, the regression relation was evaluated and validated using the PM2.5 observations at Hazard, KY. shows model-predicted PM2.5 compared to observed PM2.5 at Hazard, KY. Particulate-matter observations at Hazard, KY were available during January–May 2008 with 6-day intervals. The predicted and observed PM2.5 correlated well with an r2 = 0.65.
The PM10 concentrations at Roda, VA, are shown in . The 24-hr average PM10 concentration during the study period August 3–14, 2008, at the Campbell site was 250.2 ± 135.0 μg m−3 and at the Willis site was 144.8 ± 60.0 μg m−3. The PM10 24-hr U.S. National Ambient Air Quality Standard is 150 μg m−3. The Campbell site is located very near to the entrance of various coal mines, and therefore the PM10 concentrations far exceeded those at the Willis site. In , spatially and temporally coincident MODIS Aqua and Terra AOD (10 km × 10 km) are shown compared to the observed PM10 for the sampling sites. Satellite-derived AOD is capable of capturing the diurnal variation pattern in the sampled PM10 at the Willis site. The Willis site is close to the haul road and is ~ 1 mile away from the Campbell site. The particulate-matter measurements from Willis site are more representative of the typical exposure in the region as it is further from the mine sites, and therefore we see an improved correlation between satellite-derived AOD and Willis PM10 as compared to Campbell PM10.
Using the outputs from WRF model simulation, we further examined the role of meteorology in the air quality of the study region. At Campbell (located at the entrance of mine sites), no or poor correlation was observed between WRF simulated planetary boundary layer (PBL) height, wind speed, wind direction, 2-m air temperature, and downwelling shortwave radiation. Except for the PBL height and relative humidity, the Willis site also showed relatively poor correlation for these simulated meteorological parameters with PM10. At Willis, the daily average PBL height moderately negatively correlated () with PM10 (r2 = ~0.50).
Figure 5. The correlation between WRF-simulated PBL height and PM10 is shown for the Willis site. The PBL height–PM10 showed moderate negative correlation (r2 = ~0.50) at this site. No or poor correlation was observed between PBL height and PM10 at the Campbell site.
During August 3–14, 2008, the WRF simulated average wind direction was north-northwesterly or northerly. The daily average wind direction at the Willis site ranged from ~304º to ~360–. The corresponding 10-m wind speed ranged from 1.85 m/sec to 3.5 m/sec. Aneja et al. (Citation2012) noted that at both the sites, the lowest concentration of PM10 (~30 μg m−3) was measured on the day that had no truck hauling. We noticed that excluding this particular day in the analysis improved the correlation between PM10 and relative humidity at Willis (r2 improved from 0.10 to 0.34) and at Campbell (r2 improved from 0.08 to 0.25). Other important factors noted during this study are the higher concentration of particulate matter at Campbell and that this mine site is ~1 mile northwest of the site along the haul road (Willis). Moreover, the prevailing wind direction in this region during the study period was north/northwesterly. All these factors suggest that the air quality at Willis may be influenced by coal mining and coal hauling.
The multiple-regression model-predicted PM2.5 correlates well with the observed PM10 pattern. During the measurement period, for the days with predicted PM2.5, the correlation (negative) between PBL height and predicted PM2.5 (r2 = 0.30) was comparable with that of PBL height and predicted PM10 (r2 = 0.32). For these days, the model-predicted PM2.5 and PM10 exhibited comparable correlation with WRF-simulated meteorological parameters. These factors suggest the possibility of the same source for PM10 and PM2.5 (coal mining operations, including truck hauling). At Roda, VA, the multiple-regression model-predicted PM2.5 was compared with MODIS 550-nm AOD for the year 2008 (). The predicted PM2.5 is well correlated with satellite-derived AOD (r2 = 0.54). Engel-Cox et al. (Citation2006) pointed out that the particulate matter that is transported upward is a contributing factor in the variability in this AOD–PM2.5 relationship. The multiple-regression model (eq 2) predicted PM2.5 was correlated with measured PM10 (). The slope of suggests a PM2.5 fraction of ~9.4% of PM10. We observed a similar relationship between measured PM2.5 and measured PM10 at Hazard, KY, which has a PM2.5 contribution of ~5.6% to PM10. This result is very similar to our predicted PM2.5 fraction at Roda, VA. The correlations (r2 = 0.51) between MODIS 550-nm AOD (mean ± 1SD is 0.197 ± 0.11) and PM10 (mean ± 1SD is 137.08 ± 56.95 μg m−3) during August 3–14, 2008, are shown for Roda, VA (). The World Health Organization (WHO) PM standards are as follows: The 24-hr PM10 standard is 50 μg m−3; and the 24-hr PM2.5 standard is 25 μg m−3. Our results show that the predicted PM2.5 at Roda, VA, in 2008 is 9.11 ± 5.19 μg m−3 with a minimum of 1.27 μg m−3 and a maximum of 30.20 μg m−3. On some days in 2008, the predicted PM2.5 exceeded the WHO 24-hr standard of 25 μg m−3.
Figure 6. The correlation between spatially and temporally collocated MODIS aerosol optical depth at 550 nm and PM10 during August 3–14, 2008, are shown for Roda, VA (± 1SD for both observed and predicted PM2.5 is also shown).
Conclusion
We have conducted particulate matter (PM10) measurements at Campbell, a site located very near coal mines, and at Willis, a site close to the haul road, both in the active mountaintop mining area of Roda, VA, located in Wise County. During the 12-day measurement period in August 2008, the 24-hr average PM10 concentration at the Campbell site was 250.2 ± 135.0 μg m−3, and at the Willis Site was 138.4 ± 62.9 μg m−3, while the PM10 24-hr U.S. national ambient air quality standard is 150 μg m−3.
The fact that Wise County is Virginia’s largest surface coal-producing county at the time may be the reason for elevated levels of particulate matter loading in the region as compared to major cities in the eastern United States. Therefore, to understand the impact of coal hauling on the ambient air quality by predicting the PM2.5 concentration at the site, we have developed a regression model by spatially and temporally integrating high-confidence 550-nm AOD retrievals from MODIS satellite sensors, ground-based observations of respirable particulate matter concentrations, and surface meteorological parameters. The comparison of the multiple-regression model-predicted PM2.5 (r2 = 0.62) and two-variable (AOD–PM2.5) predicted PM2.5 (r2 = 0.4) with the observations shows that including surface meteorology in the regression model improves the agreement between measured and calculated PM2.5.
The developed regression model was validated using particulate matter observations from Hazard, KY. At Roda, VA, the ratio between model-predicted PM2.5 and measured PM10 is a little less than 0.1. The multivariate model-predicted PM2.5 exceeded the World Health Organization (WHO) 24-hr PM2.5 standard on some days for which quality-assured AOD data were available in 2008. The current study sites are representative of communities in the southwest Virginia and parts of Appalachia that are commonly located in narrow hollows where homes are placed directly along the roads that experience heavy coal truck traffic in a region of active mountaintop mining operations. The need for developing control and mitigation strategies to protect the environment and safeguard the public health from particulate matter generated by coal hauling therefore warrants further detailed studies in this and similar regions. The current study demonstrates that integrating satellite-derived aerosol information with observed and model-simulated meteorology along with ground-based particulate matter observations may provide improved characterization of air quality in the region of interest.
Acknowledgment
The authors greatly appreciate the time and interest of the many volunteers, scientists, interest groups, and students who assisted them in the collection of the data and shared their knowledge and expertise. All the data are available from Priya R. Pillai ([email protected]).
Funding
The authors acknowledge support from the Southern Appalachia Mountain Stewards (SAMS), the Sierra Club, and Kenan Trust Fund (Project Reference #062287).
Additional information
Funding
Notes on contributors
Viney P. Aneja
Viney P. Aneja is a professor in the Department of Marine, Earth, and Atmospheric Sciences, North Carolina State University, Raleigh, NC.
Priya R. Pillai
Priya R. Pillai was a graduate student in the Department of Marine, Earth, and Atmospheric Sciences, North Carolina State University, Raleigh, NC. She is now at I.M. Systems Group Inc., College Park, MD.
Aaron Isherwood
Aaron Isherwood and Peter Morgan are members of the Sierra Club Environmental Law Program, Oakland, CA.
Peter Morgan
Aaron Isherwood and Peter Morgan are members of the Sierra Club Environmental Law Program, Oakland, CA.
Saurabh P. Aneja
Saurabh P. Aneja was a graduate student at the Nicholas School of the Environment, Duke University, Durham, NC. He is now a System Performance Engineer, Cypress Creek Renewables, Carrboro, NC.
References
- Ahern, M.M., M. Hendryx, J. Conley, J. Fedorko, A. Ducatman, and K.J. Zullig. 2011. The association between mountaintop mining and birth defects among live births in central Appalachia, 1996–2003. Environ. Res. 111(6):838–846. doi:10.1016/j.envres.
- Aneja, V.P., A. Isherwood, and P. Morgan. 2012. Characterization of particulate matter (PM10) related to surface coal mining operations in Appalachia. Atmos. Environ. 54:496–501. doi:10.1016/j.atmosenv.2012.02.063
- Cheng, T., H. Chen, X. Gu, T. Yu, J. Guo, and H. Guo. 2012. The inter-comparison of MODIS, MISR and GOCART aerosol products against AERONET data over China. J. Quant. Spectrosc. Radiat. Transfer 113:2135–45. doi:10.1016/j.jqsrt.2012.06.016.
- Department of Environment and Climate Change, NSW. 2008. NSW Air Emissions Inventory for the Greater Metropolitan Region in NSW. http://www.epa.nsw.gov.au/resources/air/aeibroc07335.pdf (accessed January 4, 2015).
- Department of Environment and Climate Change and Water, The NSW Department of Planning and Industry & Investment. 2010. The Environmental Compliance and Performance Audits: Management of Dust From Coal Mines. http://www.planning.nsw.gov.au/Portals/0/Development/Compliance/Publications/summary_audit_report_december_2010.pdf (accessed January 4, 2015).
- Engel-Cox, J.A., M.H. Raymond, R. Raymond, F. Dimmick, A.C. Rush, J.J. Szykman, J. Al-Saadi, D.A. Chu, and R.Z. Erica. 2006. Integrating lidar and satellite optical depth with ambient monitoring for 3-dimensional particulate characterization. Atmos. Environ. 40(40): 8056–67. doi:10.1016/j.atmosenv.2006.02.039
- Filip, F., and S. Stefan. 2011. Study of the correlation between the near-ground PM10 mass concentration and the aerosol optical depth. J. Atmos. Solar-Terrestrial Phys. 73:1883–89. doi:10.1016/j.jastp.2011.04.027
- Finkelman, R.B. 1995. Modes of occurrence of environmentally-sensitive trace 377 elements in coal. In Environmental Aspects of 378 Trace Elements in Coal, ed. D.J. Swaine and F. Goodarzi, 25. New York, NY: Springer.
- Ghose, M.K. 2006. Factal analysis of the dispersion of air pollutants. Inter. J. Environ. Studies. 63(2):179–187. http://dx.doi.org/10.1080/00207230500533041
- Ghose, M.K. 2007. Generation and quantification of hazardous dusts from coal mining in the Indian context. Environ. Monitor. Assess. 130(1–3):35–45. doi:10.1007/s10661-006-9451-y
- Ghose, M.K., and S.R. Majee. 2000. Assessment of dust generation due to opencast coal mining–an Indian case study. Environ. Monitor. Assess. 61(2):257–265. doi:10.1023/A:1006127407401
- Ghose, M.K. and S.R. Majee. 2007. Characteristics of hazardous airborne dust around an Indian surface coal mining area. Environ. Monitor. Assess. 130(1–3):17–25. doi:10.1007/s10661-006-9448-6
- Gilbert, N., 2010. Mountain mining damages streams. Nature 466:806. doi:10.1038/466806a
- Health Effects Institute. 2004. Health effects of outdoor air pollution in developing countries of Asia: A literature review. https://www.healtheffects.org/system/files/SpecialReport15.pdf (accessed December 15, 2015).
- Hendryx, M., and M. M. Ahern. 2009. Mortality in Appalachian coal mining regions: The Value of statistical life lost. Public Health Report 124(4):541–50.
- Hong, S.-Y., J. Dudhia, and S.-H. Chen. 2004. A revised approach to ice microphysical processes for the bulk parameterization of clouds and precipitation. Month. Weather Rev. 132(1):103–20. doi:10.1175/1520-0493(2004)132<0103:ARATIM>2.0.CO;2
- Hong, S.-Y., Y. Noh, and J. Dudhia. 2006. A new vertical diffusion package with an explicit treatment of entrainment processes. Month. Weather Rev. 134(9):2318–41. doi:10.1175/MWR3199.1
- Hu, X.‐M., P.M. Klein, and M. Xue. 2013. Evaluation of the updated YSU planetary boundary layer scheme within WRF for wind resource and air quality assessments. J. Geophys. Res. Atmos. 118(18):10,490–10,505. doi:10.1002/jgrd.50823
- Iacono, M.J., J.S. Delamere, E.J. Mlawer, M.W. Shephard, S.A. Clough, and W.D. Collins. 2008. Radiative forcing by long‐lived greenhouse gases: Calculations with the AER radiative transfer models. J. Geophys. Res. Atmos. 113(D13):D12103. doi:10.1029/2008JD009944
- Jiménez, P.A., J. Dudhia, J.F. González-Rouco, J. Navarro, J.P. Montávez, and E. García-Bustamante. 2012. A revised scheme for the WRF surface layer formulation. Month. Weather Rev. 140(3):898–918. doi:10.1175/MWR-D-11-00056.1
- Kain, J.S. 2004. The Kain–Fritsch convective parameterization: An update. J. Appl. Meteorol. 43:170–81. doi:10.1175/1520-0450(2004)043<0170:TKCPAU>2.0.CO;2
- Kurth, L., A. Kolker, M. Engle, N. Geboy, M. Hendryx, W. Orem, M. McCawley, L. Crosby, C. Tatu, M. Varonka, and C. DeVera. 2015. Atmospheric particulate matter in proximity to mountaintop coal mines: sources and potential environmental and human health impacts. Environ. Geochem. Health 37(3):529–44. doi:10.1007/s10653-014-9669-5.
- Levy, R.C., L.A. Remer, R.G. Kleidman, S. Mattoo, C. Ichoku, R. Kahn, and T.F. Eck. 2010. Global evaluation of the collection 5 MODIS dark-target aerosol products over land. Atmos. Chem. Phys. 10:10399–410. doi:10.5194/acp-10-10399-2010
- Office of Surface Mining Reclamation and Enforcement, Appalachian Region. 2010. Mountain Top Mining. http://www.arcc.osmre.gov/Divisions/TSD/Techservices/MountaintopMining/mtopmining.shtm (accessed November 18, 2015).
- Palmer, M.A., E.S. Bernhardt, W.H. Schlesinger, K.N. Eshleman, E. FoufoulaGeorgiou, M.S. Hendryx, A.D. Lemly, G.E. Likens, O.L. Loucks, and M.E. Power. 2010. Science and regulation. Mountaintop mining consequences. Science 327:148–49. doi:10.1126/science.1180543
- Pelletier, B., R. Santer, and J. Vidot. 2007. Retrieving of particulate matter from optical measurements: a semiparametric approach. J. Geophys. Res. 112(D06208): 18. doi:10.1029/2005JD006737
- Rogers, E., G. DiMego, T. Black, M. Ek, B. Ferrier, G. Gayno, Z. Janjic, Y. Lin, M. Pyle, V. Wong, and W.S. Wu. 2009. The NCEP North American mesoscale modeling system: Recent changes and future plans. Preprints, 23rd Conference on Weather Analysis and Forecasting/19th Conference on Numerical Weather Prediction. https://ams.confex.com/ams/pdfpapers/154114.pdf (accessed January 20, 2015).
- Tewari, M., F. Chen, W. Wang, J. Dudhia, M.A. LeMone, K. Mitchell, M. Ek, G. Gayno, J. Wegiel, and R.H. Cuenca. 2004. Implementation and verification of the unified Noah land surface model in the WRF model. In 20th Conference on Weather Analysis and Forecasting/16th Conference on Numerical Weather Prediction, 11–15. https://ams.confex.com/ams/pdfpapers/69061.pdf (accessed December 15, 2014).
- U.S. Energy Information Administration. 2008. Coal production data 2008.Office of Oil, Gas, and Coal Supply Statistics, U.S. Energy Information Administration (EIA), U.S. Department of Energy. http://www.eia.gov/beta/coal/data/browser (accessed November 20, 2014).
- U.S. Environmental Protection Agency. 1994. Ground Water and Wellhead Protection. Washington, DC: U.S. Environmental Protection Agency.
- van Donkelaar, A., R.V. Martin, M. Brauer, R. Kahn, R. Levy, C. Verduzco, and P.J. Villeneuve. 2010. Global estimates of ambient fine particulate matter concentrations from satellite-based aerosol optical depth: Development and applications. Environ. Health Perspect. 118(6):847–855. doi:10.1289/ehp.0901623
- van Donkelaar, A., R.V. Martin, R.C. Levy, A.M. DaSilva, M. Krzyzanowski, N.E. Chubarova, E. Semutnikova, and A.J. Cohen. 2011. Satellite-based estimates of ground-level fine particulate matter during extreme events: A case study of the Moscow fires in 2010. Atmos. Environ. 45:6226–32. doi:10.1016/j.atmosenv.2011.07.068.
- van Donkelaar, A., R.V. Martin, and R.J. Park. 2006. Estimating ground-level PM2.5 using aerosol optical depth determined from satellite remote sensing. J. Geophys. Res. 111: D21201. doi:10.1029/2005JD006996.
- World Health Organization. 2005. Air Quality Guidelines. http://www.euro.who.int/__data/assets/pdf_file/0005/78638/E90038.pdf ( accessed January 20, 2015).