
ABSTRACT
As part of two separate studies aimed to characterize ambient pollutant concentrations at schools in urban areas, we compare black carbon and particle count measurements at Adcock Elementary in Las Vegas, NV (April–June 2013), and Hunter High School in the West Valley City area of greater Salt Lake City, UT (February 2012). Both schools are in urban environments, but Adcock Elementary is next to the U.S. 95 freeway. Black carbon (BC) concentrations were 13% higher at Adcock compared to Hunter, while particle count concentrations were 60% higher. When wind speeds were low—less than 2 m/sec—both BC and particle count concentrations were significantly higher at Adcock, while concentrations at Hunter did not have as strong a variation with wind speed. When wind speeds were less than 2 m/sec, emissions from the adjacent freeway greatly affected concentrations at Adcock, regardless of wind direction. At both sites, BC and particle count concentrations peaked in the morning during commute hours. At Adcock, particle count also peaked during midday or early afternoon, when BC was low and conditions were conducive to new particle formation. While this midday peak occurred at Adcock on roughly 45% of the measured days, it occurred on only about 25% of the days at Hunter, since conditions for particle formation (higher solar radiation, lower wind speeds, lower relative humidity) were more conducive at Adcock. Thus, children attending these schools are likely to be exposed to pollution peaks during school drop-off in the morning, when BC and particle count concentrations peak, and often again during lunchtime recess when particle count peaks again.
Implications: Particle count concentrations at two schools were shown to typically be independent of BC or other pollutants. At a school in close proximity to a major freeway, particle count concentrations were high during the midday and when wind speeds were low, regardless of wind direction, showing a large area of effect from roadway emissions even when the school was not downwind of the roadway. At the second school, which sits in an urban neighborhood away from freeways, high particle counts occurred even though solar radiation was low during wintertime conditions, meaning that exposure to high particle counts can occur throughout the year.
Introduction
Particulate matter (PM) concentrations and composition vary spatially on an urban scale, which is particularly important with regard to species predominantly from traffic emissions, such as black carbon (BC) and particles with diameters less than 100 nm (called ultrafine particles, or UFP). The spatial variability of UFP and BC in urban areas has been studied across Europe using multiyear data sets; these studies show high UFP and BC concentrations next to roadways compared to urban background conditions (Hudda et al., Citation2010; Dall’Osto et al., Citation2011; Dall’Osto et al., Citation2013; Salma et al., Citation2014; Kumar et al., Citation2014; Pieters et al., Citation2015). While BC is emitted directly, UFPs can be both emitted and formed via multiple mechanisms (Kulmala et al., Citation2004; Robinson et al., Citation2007; Dall’Osto et al., Citation2013; Reche et al., Citation2011). The UFP monitor used in our studies counts particles with diameters between roughly 7 nm and 3 µm, and since “particles in the UFP size range account for the vast percentage of particle numbers in ambient air” (Health Effects Institute, Citation2013), the particle number concentration measured by this monitor is close to a true UFP concentration (Kumar et al., Citation2014) and has been used as such in prior work (South Coast Air Quality Management District, Citation2015b; Zhu et al., Citation2008). For clarity, we refer to our measurements as total particle counts, rather than strictly UFP.
Current PM mass standards in the United States were established by the U.S. Environmental Protection Agency (EPA) to safeguard human health. While near-road monitoring regulations exist in the United States for nitrogen dioxide (EPA, 2010), there are currently no near-road monitoring requirements in the United States for PM or PM components of any particle size. In Europe, there are emission regulations limiting total particle emissions (European Union [EU] 5b and 6 emissions standards) and multiple, ongoing, long-term monitoring sites that measure UFP and/or particle numbers (Heal et al., Citation2012; Reche et al., Citation2011; Pant and Harrison, Citation2013; von Bismarck-Osten et al., Citation2013). Multiple studies have also suggested that UFPs cause adverse health effects that differ from the effects of larger particles because of their large surface area per unit mass (Chio and Liao, Citation2008) and composition (Riddle et al., Citation2008); however, the Health Effects Institute (Citation2013) noted that studies thus far have “provided suggestive, but often inconsistent, evidence of adverse effects of short-term exposure to ambient UFPs.” While number concentrations of UFPs have associations with health effects, there is variation in UFP composition depending on the source and formation mechanism. For example, UFPs could include metals generated from emissions of motor oil or brake wear, or could be soluble particles of sulfate and/or organics (Riddle et al., Citation2007, Citation2008; Brines et al., Citation2015; Ham and Kleeman, Citation2011; Fine et al., Citation2004); these different types of particles may have different health effects.
UFPs are found in urban environments worldwide (Kulmala et al., Citation2004; Reche et al., Citation2011; Brines et al., Citation2015), but given their relatively small size, UFPs do not substantially contribute to fine particle mass. Both BC and UFP in urban areas are typically from traffic emissions (Urman, Gauderman, et al., Citation2014; Wong et al., Citation2003; Dallmann et al., Citation2012; May et al., Citation2014; Ham and Kleeman, Citation2011). UFPs are formed from combustion processes such as biomass burning and in-vehicle exhaust, either as the primary particulate emissions or as hot and semivolatile gases that rapidly condense after they are emitted (Kittelson, Citation1998; Kittelson et al., Citation2006). UFPs can also form through condensation of low-volatility precursor gases under photooxidative conditions and by the process of nucleation (Kulmala et al., Citation2004; Holmes, Citation2007; Stanier et al., Citation2004; Dall’Osto et al., Citation2013; Sowlat et al., Citation2016). These new-particle formation events typically occur during midday or afternoon, depending on meteorology (temperature, solar radiation, humidity, wind speed, etc.), precursor gas concentrations, and concentrations of existing particles.
BC is the main component in diesel particular matter (DPM), which has been found to be toxic to lung tissue (Mauderly, Citation1994; Weingartner et al., Citation1997; Seagrave et al., Citation2006; Hiura et al., Citation2000). DPM has also been linked to respiratory disease and heart rate variability (Urman, McConnell, et al., Citation2014; Ristovski et al., Citation2012; Schwarze et al., Citation2006), and was the largest contributor to cancer risk in the Los Angeles, CA, MATES-II, -III, and -IV studies (South Coast Air Quality Management District, Citation2000, Citation2008, Citation2015a).
BC and particle count are important to quantify because of their potential health impacts and typical high concentrations in urban area. It is especially important to quantify BC and particle count near locations where sensitive populations, such as children, may be exposed to air pollution not typically quantified as part of routine monitoring. Here, we report BC and particle count measurements recorded as part of two separate studies at two separate schools; one of the schools resides in a near-road environment, while the other is not near a highly trafficked roadway and better represents average urban conditions. The main objective of these studies was to characterize the pollutant concentrations at each school, including how concentrations varied with time of day and compared to other urban or near-road locations. Since these two studies had similar objectives, measured pollutants, and analysis approaches, we describe results from both schools here.
Methods
Monitoring site locations
Measurements were made at two schools as part of two separate studies; Adcock Elementary School (Adcock) in Las Vegas, NV, and Hunter High School (Hunter) in West Valley City, which is part of the greater Salt Lake City, UT, area. Adcock Elementary was chosen since it was one of three schools along the U.S. 95 freeway targeted as part of a settlement agreement between the Federal Highway Administration, the Nevada Department of Transportation, and the Sierra Club in 2007 when the U.S. 95 freeway was to be expanded. Air monitoring had previously been conducted there during 2007–2008 to determine ambient pollutant concentrations (Brown et al., Citation2012; Brown et al., Citation2014; McCarthy et al., Citation2013), and the additional monitoring done in 2013 was the final phase of the settlement agreement. As part of a separate project funded by the Utah Department of Transportation (UDOT), Hunter and four additional schools were chosen for air quality monitoring during 2011–2012; these schools are near the development of the Mountain View Corridor, a multiphase freeway expansion project in western Salt Lake County and northwestern Utah County.
The goal of the monitoring was to assess the air quality effects of the new roadway and help mitigate impacts from construction and emissions at the five schools. The monitoring conducted at Hunter occurred before freeway construction began in order to determine ambient concentrations before construction.
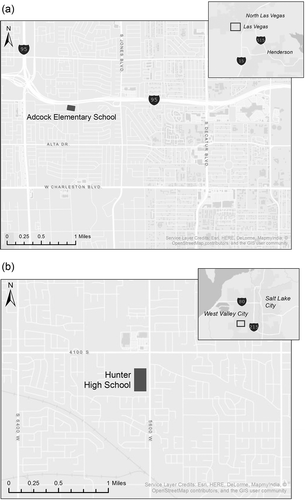
At Adcock, measurements were made on the north side of the school, 18 m from the U.S. 95 freeway roadside barriers (see ). The U.S. 95 freeway has six lanes in each direction, with an annual average daily traffic (AADT) volume of 198,000 vehicles. Adcock is also situated near two four-lane arterial roadways: Alta Drive, which has an AADT volume of 7,400 vehicles, and Torry Pines Drive, which has an AADT volume of 6,200 vehicles. Hunter is more than 6 km from a major freeway, and is next to minor two-lane arterials. At both schools, a 3 m × 5 m insulated, conditioned shelter housed the meteorological and air quality instruments. Meteorological data (wind speed, wind direction, temperature, etc.) were collected at 10 m above ground level (agl), while air sampling inlets were 2 m above the trailer roof, approximately 6 m agl.
Figure 1. Study locations: (a) Adcock Elementary School, Las Vegas, NV; (b) Hunter High School, Salt Lake City, UT.
Measurements
A summary of measurements from each site is provided in . Wind speed and direction data were vector-averaged from 1-min data to hourly values, while temperature, solar radiation, and relative humidity (RH) were all averaged to hourly values. BC data at 880 nm wavelength were collected using a Magee Scientific Aethalometer, model AE22. Time-stamp and filter tape spot saturation corrections were made using the Washington University Air Quality Lab AethDataMasher Version 7.0r BETA, from which hourly values were derived. Hourly averaged NO, NO2, and NOx measurements at Adcock were made using a Thermo model 42i chemiluminescence instrument. The particle count data were collected with a Teledyne-API model 651 condensation nuclei counter in 1-min intervals and then averaged up to hourly values, and required 75% of the 1-min data for each hour to be valid in order to create a 1-hr average. The 1-min and hourly data were visually screened for suspect data points and instrument drift during the measurement period and before analysis. Flow checks for the Aethalometer and 42i were conducted monthly with a NIST-traceable BGI deltaCal flowmeter. Meteorological equipment was audited at installation, and all sensors were within specification.
Table 1. Measurements at Adcock Elementary and Hunter High School.
Measurements were collected during late winter at Hunter, and in spring to early summer at Adcock; thus, a strict comparison of concentrations between the two studies is problematic because the meteorology during the two monitoring periods is different. For example, the higher temperatures and higher solar radiation at Adcock during spring and summer comprise a meteorological regime that makes particle formation more likely. Lower temperatures during late winter at Hunter may affect emissions, as colder vehicles tend to emit relatively more hydrocarbons (Cadle et al., Citation2001), potentially leading to more conducive conditions for particle formation.
Traffic data in Las Vegas were collected by the Nevada Department of Transportation (DOT) at the Torrey Pines overcrossing of U.S. 95, about 200 m from Adcock. Hourly traffic speed and volume (separated by six size bins) were measured and consolidated into two categories: (1) small vehicles shorter than 40 ft in length, and (2) large vehicles longer than 40 ft. Traffic data were available only for April 19–June 6. As part of data validation, total volume data were aggregated up to a daily total; the average daily total on U.S. 95 on weekdays (197,076 vehicles/day) was within 1% of the listed AADT value of 198,000 vehicles/day. Hourly values of total volume and speed by lane were also examined to identify any hours where data were suspect, but no suspect or invalid points were found. No traffic data are available for the arterial roads next to Hunter.
Results
Overview and temporal patterns of concentrations
A summary of concentrations at both sites for particle count, BC, and other parameters is shown in . On average, particle count concentrations at Adcock (10,981 particles/cm3) were 60% higher than at Hunter (6,755 particles/cm3). These concentrations are similar to the average range of “urban background” and “urban” concentrations (7,290–10,760 particles/cm3), which were summarized across multiple studies and conditions in Health Effects Institute (Citation2013) and Morawska et al. (Citation2008). BC concentrations are also slightly higher (13%) at Adcock compared to Hunter, likely due to the influence of roadway emissions from the U.S. 95 freeway. During the study, an average of 1.2% of the 197,076 AADT on the U.S. 95 freeway consisted of large vehicles such as trucks. Traffic volume on the freeway peaked in the afternoon, with a secondary peak in the morning. Overall, the traffic volume, fraction of large vehicles, and temporal pattern were similar to observations from a 2008 study at Adcock (Brown et al., Citation2014).
Table 2. Summary statistics of hourly particle concentration, BC, and PM10 concentrations and wind speed at Adcock (April 19–June 19, 2013) and at Hunter (February 9–February 24, 2012).
shows the average diurnal patterns for particle count and BC concentrations at both schools. At Hunter, both particle count and BC showed strong morning peaks at 8:00 a.m. local time, when school begins, and secondary afternoon/evening increases (from about 3:00 to 10:00 p.m.; ). The morning peak occurred when winds and atmospheric mixing height were low, and is likely due to traffic emissions on the nearby arterial roads plus an increase in emissions citywide during rush hours. In the afternoon and evening, BC concentrations typically remained low, while particle count concentrations increased to levels near the morning average maximum. This afternoon/evening peak in particle count concentrations occurred on about one-third of the study days.
Figure 2. Hourly averaged BC (µg/m3) and particle count (particles/cm3) concentrations at (a) Adcock Elementary, April 19–June 19, 2013 and (b) Hunter High, February 9–24, 2012.
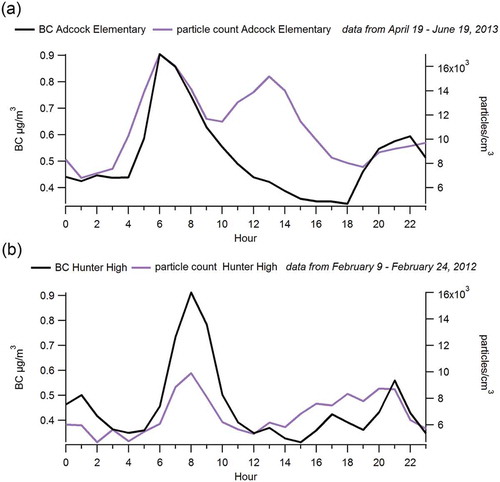
At Adcock (), the diurnal pattern for particle count differed from the pattern for BC. Both particle count and BC concentrations exhibited an early morning peak (when school is beginning) associated with rush hour traffic. Particle count concentrations peaked again midday, while BC concentrations showed a secondary peak with the evening rush hours. There was also a slight increase in particle count during the late evening. On weekends, particle count concentrations showed a modest morning peak followed by a main midday peak, while on weekdays the morning peak was strongest. BC concentrations had a morning peak on both weekends and weekdays, but concentrations were lower on weekends than on weekdays. A midday particle count peak occurred on nearly half of the days during the study, consistent with findings from prior studies (Holmes, Citation2007; Kulmala et al., Citation2004; Reche et al., Citation2011; Kumar et al., Citation2014), and has been ascribed to new particle formation. In the next section, we present an investigation of a few case study days at both sites where a midday or afternoon particle count peak occurred.
Particle count and BC concentrations with traffic and meteorological variations
Utilizing Adcock’s proximity to the U.S. 95 freeway, we examined how particle count and BC concentrations vary with changes in traffic and meteorology. Though both BC and particle counts are predominantly from traffic emissions, BC emissions are typically much higher from trucks than car emissions, and in an urban environment trucks are often the main source of BC (Pant and Harrison, Citation2013; Lambe et al., Citation2009). While truck emissions of particle counts are typically higher than car emissions (Robert et al., Citation2007; Ban-Weiss et al., Citation2010), car emissions dominate near-road particle counts since there are typically orders of magnitude more cars than trucks in urban environments (Rodríguez et al., Citation2007). In addition to variations in emissions by fleet mix, traffic volume, and traffic speed, meteorology also impacts concentrations.
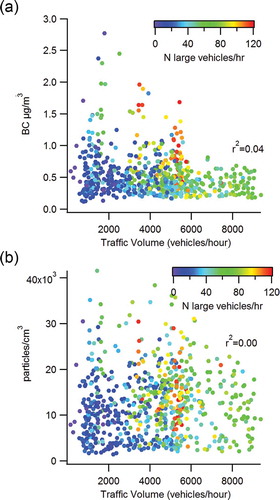
BC and particle count concentrations did not correlate with either traffic volume or vehicle speed. shows this lack of correlation for traffic volume (r2 values ranged from 0.00 to 0.04); in hours with relatively high vehicle volume (greater than 7,000 vehicles/hour), particle count and BC concentrations were no different than in hours with lower volume. Hours with higher than typical truck volume did not have higher particle count or BC concentrations, nor did lower vehicle speeds yield higher particle count or BC concentrations. This lack of correlation between BC and traffic parameters may be because there were very few hours during the monitoring campaign when Adcock was immediately downwind of the freeway. Only 10% of observations were made when Adcock was downwind of the freeway (i.e., where wind direction was between 290 and 60 degrees), and these observations came throughout the day and night.
Figure 3. Hourly concentrations of (a) BC (µg/m3) and (b) particle count (particles/cm3) at Adcock Elementary compared to traffic volume (vehicles/hr), colored by the number of large vehicles (those greater than 40 feet in length).
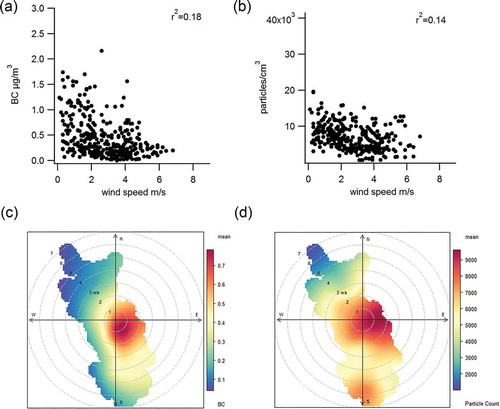
shows how BC and particle count concentrations varied with wind speed and wind direction, via scatter plot and polar plot. Polar plots were generated using the openair R package with the polarPlot function (Carslaw, Citation2015, Citation2016; Carslaw and Ropkins, Citation2012; Grange et al., Citation2016). These plots are used to show how average BC and particle count concentrations vary with wind speed and wind direction on a smoothed surface.
Figure 4. Wind speed (m/sec) at Adcock Elementary compared to hourly concentrations of (a) BC (µg/m3) (b) particle count (particles/cm3) and polar plots for (c) BC (µg/m3) and (d) particle count (particles/cm3).
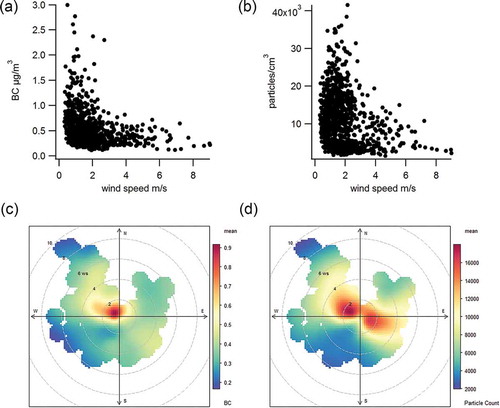
The downwind direction is roughly from 315 to 45 degrees (northwest to northeast); concentrations were generally low when winds were from this direction, in part because wind speeds were typically higher from this direction compared to winds from the south. Calm winds—those less than 1 m/sec—occurred 24% of the time, while low wind speeds—those between 1 and 2 m/sec—occurred 45% of the time. Particle count and BC concentrations were significantly higher when calm or low wind speeds occurred, compared to when winds were stronger. Prior work has shown that under low winds, the influence of freeway emissions can stretch hundreds of meters away from the freeway (Hu et al., Citation2009), which is likely the case here. Importantly, these calm and low winds occurred more than 50% of the time during the study, meaning that exposure to ambient BC and particle count concentrations at Adcock may be influenced more by wind speed than by wind direction. High BC concentrations are more associated with downwind, low wind speed conditions than under upwind, low wind speed conditions (). Particle count concentrations are generally high when wind speeds are low, regardless of wind direction. A scatter-plot matrix showing relationships across all parameters is shown in the Supplemental Information.
At Adcock, the freeway influence on BC and particle count concentrations at low wind speeds is shown in and , especially when compared to results for Hunter (). At Hunter, BC and particle count concentrations had a slightly higher correlation (r2 = 0.34) than at Adcock (r2 = 0.27), possibly because concentrations at Hunter are representative of a more mixed urban signal than at Adcock. BC concentrations at Hunter were somewhat lower with higher wind speeds, but particle count concentrations were similar across all wind speeds. Polar plots ( and ) further show a “smeared” concentration gradient, where BC and particle count concentrations are generally higher with winds coming from the central urban area to the east and south. At Hunter, BC concentrations decrease with higher wind speeds, but particle counts do not. This is in contrast to the Adcock results, likely because under the low wind speeds at Adcock, both BC and particle count concentrations are impacted by emissions from the freeway, regardless of wind direction. This is consistent with other studies, which have found that BC and particle count concentrations are only correlated with larger particles greater than 200 nm in diameter (Sun et al., Citation2015; Gramsch et al., Citation2014; Cheng et al., Citation2014; Reche et al., Citation2011).
Figure 5. Wind speed (m/sec) at Hunter High compared to hourly concentrations of (a) BC (µg/m3) and (b) particle count (particles/cm3), and polar plots for (c) BC (µg/m3) and (d) particle count (particles/cm3). The axis ranges for and are the same as those in and in order to aid comparison between figures.
We used a simple multilinear model in R (fitted.model: lm) to identify which among the monitored variables (meteorology, air quality, and traffic at Adcock) had the largest predictive capability for Adcock and Hunter particle count; full results are provided in the Supplemental Information. At Adcock, wind speed, solar radiation, NO, and NO2 were the most significant predictive variables, resulting in an r2 of 0.60 to predict particle count concentrations. Adding additional variables (traffic volume and speed, other meteorological variables, and BC) did not result in an improvement in r2. At Hunter, wind speed, BC, PM10, and RH were the most significant predictors, but these only resulted in an r2 of 0.45. Including other parameters (such as solar radiation, wind direction, and temperature) did not increase the r2. Wind speed was the only common significant predictor of particle count concentrations at both sites.
Examination of midday peak particle count concentrations
Midday peaks of particle count concentrations occurred at both sites, though these peaks occurred much more frequently at Adcock than at Hunter. Of the 44 days with particle count data at Adcock, roughly 20 days had a morning particle count and BC concentration peak and a corresponding midday particle count peak, with no peak in BC. At Hunter, roughly 4 out of the 16 days with particle count data had midday or early afternoon particle count concentration peaks, with no peak in BC. shows morning and midday peaks at Adcock (recorded on April 30 and June 4), days when no midday peak occurred at Adcock (April 29 and June 5), and an afternoon particle count peak at Hunter (February 20).
Figure 6. Hourly measurements of particle count (particles/cm3), BC (µg/m3), NOx (ppb, Adcock only), wind speed (m/sec), and RH (%) for (a) April 29 and 30, 2013, at Adcock (b) June 4 and 5, 2013, at Adcock and (c) February 19 and 20, 2012, at Hunter.
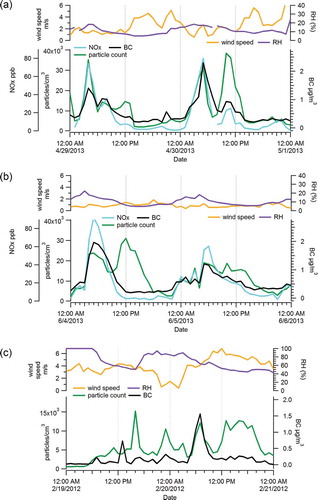
At Adcock, the midday peaks typically occurred when wind speed (<2 m/sec) and RH (<20%) were low and solar radiation was high, though there are a number of days where these conditions were true without a midday peak. The particle count peak did not correspond with changes in traffic speed or volume on the adjacent U.S. 95 freeway, since traffic speed and volume were typically similar every weekday. NOx concentrations were well correlated with BC during the study (r2 = 0.68), meaning that the midday particle count peaks typically did not occur with peaks in NOx.
At Hunter, midday particle count peaks were less frequent and occurred under a range of RH (40–80%) and modest wind speeds (1–6 m/sec). For example, on February 20, particle count and BC concentrations had a strong morning peak, and particle counts peaked again in the afternoon when wind speeds were 4–6 m/sec, while both PM10 and BC concentrations stayed low.
Discussion
Midday peaks in particle number have been seen in urban and rural environments as recently summarized in Kumar et al. (Citation2014), and have been ascribed to new particle formation events. These events can occur when low volatility gaseous species condense, and typically occur when solar radiation is high and wind speed and RH are low (Kulmala et al., Citation2004; Holmes, Citation2007). For example, Gramsch et al. (Citation2014) found that in Santiago, Chile, UFP concentrations typically peaked in the afternoon on days with high solar radiation and moderate PM concentration, though not on all days with such meteorological and PM conditions; the number of secondary particles correlated modestly with solar radiation (r2 = 0.46). They also note that afternoon UFP concentration peaks occasionally occurred on days with low solar radiation and high PM, and that afternoon peaks did not occur on all days with high radiation and PM. In Taipei, Taiwan, Cheng et al. (Citation2014) consistently observed summertime midday peaks in UFP concentrations over multiple years, attributing the observation to a combination of photochemical nucleation and condensation. Across multiple cities in Europe, Reche et al. (Citation2011) report similar findings; BC and particle number have a consistent morning pattern at all sites, with midday or early afternoon peaks in particle number occurring when BC and other primary pollutant concentrations are low. The midday UFP peaks sometimes occurred with coincident sulfur dioxide (SO2) peaks, but not consistently, indicating there are likely multiple pathways for new particle formation (Holmes, Citation2007; Kumar et al., Citation2014). The observations at Adcock are similar to findings reported elsewhere; both particle number and BC concentrations peaked in the morning, but only particle number had a second peak in the midday.
As seen in the average diurnal profile in , there was on average no midday UFP peak at Hunter. shows one of the few days—February 20—that did have a midday peak. On this day, wind speeds were modest (4-6 m/sec) and RH was at 40%; these are very different conditions than those with which a midday peak was seen at Adcock. In the literature, midday peaks are most common in the summertime, but multiple studies have also observed the occasional peak in wintertime (Reche et al., Citation2011). For example, Stanier et al. (Citation2004) observed new particle formation in Pittsburgh, PA, during both winter and summer. In a review of particle formation studies, Holmes (Citation2007) notes multiple mechanisms by which particles may form, including lower temperatures coupled with clean air, which describes the conditions during the February 20 peak at Hunter.
At the Adcock site next to the U.S. 95 freeway, particle count and BC concentrations were significantly higher when wind speeds were low—simply being next to the freeway resulted in high concentrations regardless of traffic speed or volume. BC concentrations tracked overall traffic patterns, while particle count concentrations were high in the morning (coincident with the morning commute) and were also high at other hours, typically midday. In a review of multiple air quality studies in Europe, Reche et al. (Citation2011) noted a narrow variation in the particle number to BC ratio across the monitoring sites in the morning, with much more variation later in the day, likely due to new particle formation. They also found that while BC concentrations tend to reflect local traffic levels and emissions mixture, particle number did not.
At both the Adcock and Hunter sites, midday or afternoon particle count peaks occurred with no corresponding peak in BC. We interpret this lack of a BC peak to mean not an increase in emissions, but rather conducive meteorology that began particle formation. At the Adcock site, there was more days with new particle formation due to the site’s higher solar radiation, lower RH, and lower wind speeds; these conditions have been shown to increase new particle formation in studies around the world (Kulmala et al., Citation2004; Holmes, Citation2007; Kumar et al., Citation2014). These meteorological conditions appeared necessary for new particle formation, though not completely sufficient, as these conditions were met on some days when particle count concentrations did not peak in the midday/afternoon. On the days without a midday peak in particle count concentrations, it may be that preexisting particles acted as a sink for newly formed particles, inhibiting their formation and growth; it could also be that precursor gas concentrations, such as volatile organic compounds or SO2, were not high enough to trigger significant formation (Holmes, Citation2007; Dall’Osto et al., Citation2011; Reche et al., Citation2011; Kumar et al., Citation2014).
While midday/afternoon particle count concentration peaks occur more often in summer, there were multiple occurrences of midday/afternoon peaks at Hunter in February. At Hunter, there was no consistent relationship between meteorology and afternoon particle count concentration peaks, except that these peaks occurred on sunny days when PM10 concentrations were relatively low. As at Adcock, low wind speeds and RH plus sufficient solar radiation did not always result in higher particle count concentrations at Hunter; other factors that were not measured, such as precursor gas concentrations, likely account for the inconsistencies seen between meteorology and particle count concentrations at both sites.
Conclusion
BC and particle count concentrations at two urban schools in the western United States were compared, where one school—Adcock Elementary—is located next to a large freeway, and the other school—Hunter High—is located in an area more representative of urban background. At Adcock, wind direction becomes nearly irrelevant under low wind speed conditions, and emissions from the adjacent freeway lead to a significant increase in BC and particle count concentrations. In contrast, there is little to no change in BC and particle count concentrations at Hunter with increasing wind speed. BC and particle count concentrations peaked in the morning for both sites, coincident with morning commute traffic, though at the near-road Adcock site neither concentration had a correlation with traffic speed, traffic volume, or fleet mix. Lastly, midday and afternoon particle count peaks were observed at both sites, which we ascribe to new particle formation typically occurring under low wind speed and high solar radiation conditions.
Supplemental_FINAL.docx
Download MS Word (216.9 KB)Acknowledgment
The authors thank Sonoma Technology, Inc. for supporting part of this work, and Teledyne-API for supplying the UFP monitor. At STI, Jennifer DeWinter, Kim Lorentz, and Theresa O’Brien assisted with the data processing.
Funding
The Utah Department of Transportation and Nevada Department of Transportation were partial funders of this work.
Supplemental data
Supplemental data for this paper can be accessed on the publisher’s website.
Additional information
Funding
Notes on contributors
Steven G. Brown
Steven G. Brown, David L. Vaughn, and Paul T. Roberts are scientists at Sonoma Technology, Inc., an air quality consulting firm in Petaluma, CA.
David L. Vaughn
Steven G. Brown, David L. Vaughn, and Paul T. Roberts are scientists at Sonoma Technology, Inc., an air quality consulting firm in Petaluma, CA.
Paul T. Roberts
Steven G. Brown, David L. Vaughn, and Paul T. Roberts are scientists at Sonoma Technology, Inc., an air quality consulting firm in Petaluma, CA.
References
- Ban-Weiss, G.A., M.M. Lunden, T.W. Kirchstetter, and R.A. Harley. 2010. Size-resolved particle number and volume emission factors for on-road gasoline and diesel motor vehicles. J. Aerosol Sci. 41(1):5–12. doi:10.1016/j.jaerosci.2009.08.001. http://www.sciencedirect.com/science/article/pii/S0021850209001402.
- Brines, M., M. Dall’Osto, D.C.S. Beddows, R.M. Harrison, F. Gómez-Moreno, L. Núñez, B. Artíñano, F. Costabile, G.P. Gobbi, F. Salimi, et al. 2015. Traffic and nucleation events as main sources of ultrafine particles in high-insolation developed world cities. Atmos. Chem. Phys. 15:5929–45. doi:10.5194/acp-15-5929-2015. http://www.atmos-chem-phys.net/15/5929/2015/acp-15-5929-2015.pdf.
- Brown, S.G., T. Lee, G.A. Norris, P.T. Roberts, J.L. Collett, Jr., P. Paatero, and D.R. Worsnop. 2012. Receptor modeling of near-roadway aerosol mass spectrometer data in Las Vegas, Nevada, with EPA PMF. Atmos. Chem. Phys. 12:309–25. doi:10.5194/acp-12-309-2012. STI-3873. http://www.atmos-chem-phys.net/12/309/2012/.
- Brown, S.G., M.C. McCarthy, J.L. DeWinter, D.L. Vaughn, and P.T. Roberts. 2014. Changes in air quality at near-roadway schools after a major freeway expansion in Las Vegas, Nevada. J. Air Waste Manage. Assoc. 64(9):1002–12. doi:10.1080/10962247.2014.907217. STI-3889.
- Cadle, S.H., P. Mulawa, P. Groblicki, C. Laroo, R.A. Ragazzi, K. Nelson, G. Gallagher, and B. Zielinska. 2001. In-use light-duty gasoline vehicle particulate matter emissions on three driving cycles. Environ. Sci. Technol. 35(1):26–32. doi:10.1021/es0010554
- Carslaw, D.C. 2015. The openair manual—Open-source tools for analysing air pollution data. London, UK: King’s College London.
- Carslaw, D.C. 2016. Polarplotr: Bivariate polar plots for air pollution data analysis. https://github.com/davidcarslaw/polarplotr.
- Carslaw, D.C., and K. Ropkins. 2012. openair—An R package for air quality data analysis. Environ. Model. Software 27–28:52–61. doi:10.1016/j.envsoft.2011.09.008.
- Cheng, Y.-H., Y.-Y. Kao, and J.-J. Liu. 2014. Correlations between black carbon mass and size–resolved particle number concentrations in the Taipei urban area: A five-year long-term observation. Atmos. Pollut. Res. 5(1):62–72. doi:10.5094/APR.2014.008. http://www.sciencedirect.com/science/article/pii/S1309104215303421.
- Chio, C.-P., and C.-M. Liao. 2008. Assessment of atmospheric ultrafine carbon particle-induced human health risk based on surface area dosimetry. Atmos. Environ. 42(37):8575–84, doi:10.1016/j.atmosenv.2008.08.027.
- Dall’Osto, M., X. Querol, A. Alastuey, C. O’Dowd, R.M. Harrison, J. Wenger, and F.J. Gómez-Moreno. 2013. On the spatial distribution and evolution of ultrafine particles in Barcelona. Atmos. Chem. Phys. 13:741–59. doi:10.5194/acp-13-741-2013. http://www.atmos-chem-phys.net/13/741/2013/.
- Dall’Osto, M., A. Thorpe, D.C.S. Beddows, R.M. Harrison, J.F. Barlow, T. Dunbar, P.I. Williams, and H. Coe. 2011. Remarkable dynamics of nanoparticles in the urban atmosphere Atmos. Chem. Phys. 11:6623–37. doi:10.5194/acp-11-6623-2011. http://www.atmos-chem-phys.net/11/6623/2011/.
- Dallmann, T., S. DeMartini, T. Kirchstetter, S. Herndon, and T. Onasch. 2012. On-road measurement of gas and particle phase pollutant emission factors for individual heavy-duty diesel trucks. Environ. Sci. Technol. 46(15):8511–18. doi:10.1021/es301936c
- Fine, P.M., S. Shen, and C. Sioutas. 2004. Inferring the sources of fine and ultrafine particulate matter at downwind receptor sites in the Los Angeles basin using multiple continuous measurements. Aerosol Sci. Technol. 38:182–95. doi:10.1080/02786820390229499
- Gramsch, E., F. Reyes, P. Oyola, M.A. Rubio, G. López, P. Pérez, and R. Martínez. 2014. Particle size distribution and its relationship to black carbon in two urban and one rural site in Santiago de Chile. J. Air Waste Manage. Assoc. 64(7):785–96. doi:10.1080/10962247.2014.890141.
- Grange, S.K., A.C. Lewis, and D.C. Carslaw. 2016. Source apportionment advances using polar plots of bivariate correlation and regression statistics. Atmos. Environ. 145:128–34. http://dx.doi.org/10.1016/j.atmosenv.2016.09.016.
- Ham, W.A., and M.J. Kleeman. 2011. Size-resolved source apportionment of carbonaceous particulate matter in urban and rural sites in central California. Atmos. Environ. 45(24): 3988–95. doi:10.1016/j.atmosenv.2011.04.063. http://www.sciencedirect.com/science/article/pii/S1352231011004523.
- Heal, M.R., P. Kumar, and R.M. Harrison. 2012. Particles, air quality, policy and health. Chem. Soc. Rev. 41:6606–30. doi:10.1039/C2CS35076A
- Health Effects Institute. 2013. Understanding the health effects of ambient ultrafine particles. Report prepared by the HEI Review Panel on Ultrafine Particles, Health Effects Institute, Boston, MA, January. http://pubs.healtheffects.org/getfile.php?u=893.
- Hiura, T.S., N. Li, R. Kaplan, M. Horwitz, J.C. Seagrave, and A.E. Nel. 2000. The role of a mitochondrial pathway in the induction of apoptosis by chemicals extracted from diesel exhaust particles. J. Immunol. 165:2703–11. doi:10.4049/jimmunol.165.5.2703
- Holmes, N.S. 2007. A review of particle formation events and growth in the atmosphere in the various environments and discussion of mechanistic implications. Atmos. Environ. 41(10): 2183–201. doi:10.1016/j.atmosenv.2006.10.058. http://www.sciencedirect.com/science/article/pii/S1352231006010934.
- Hu, S., S. Fruin, K. Kozawa, S. Mara, S.E. Paulson, and A.M. Winer. 2009. A wide area of air pollutant impact downwind of a freeway during pre-sunrise hours. Atmos. Environ. 43:2541–9. doi:10.1016/j.atmosenv.2009.02.033. http://www.sciencedirect.com/science/article/pii/S1352231009001617.
- Hudda, N., K. Cheung, K.F. Moore, and C. Sioutas. 2010. Inter-community variability in total particle number concentrations in the eastern Los Angeles air basin. Atmos. Chem. Phys. 10:11385–99. doi:10.5194/acp-10-11385-2010. http://www.atmos-chem-phys.org/10/11385/2010/acp-10-11385-2010.pdf.
- Kittelson, D.B. 1998. Engines and nanoparticles: A review. J. Aerosol Sci. 29(5–6): 575–88, doi:10.1016/S0021-8502(97)10037-4. http://www.sciencedirect.com/science/article/pii/S0021850297100374.
- Kittelson, D.B., W.F. Watts, and J.P. Johnson. 2006. On-road and laboratory evaluation of combustion aerosols—Part 1: Summary of diesel engine results. J. Aerosol Sci. 37(8): 913–30, doi:10.1016/j.jaerosci.2005.08.005.
- Kulmala, M., H. Vehkamaki, T. Petäjä, M. Dal Maso, A. Lauri, V.M. Kerminen, W. Birmili, and P.H. McMurry. 2004. Formation and growth rates of ultrafine atmospheric particles: A review of observations. J. Aerosol Sci. 35(2): 143–76. doi:10.1016/j.jaerosci.2003.10.003. http://www.sciencedirect.com/science/article/pii/S0021850203004373.
- Kumar, P., L. Morawska, W. Birmili, P. Paasonen, M. Hu, M. Kulmala, R.M. Harrison, L. Norford, and R. Britter. 2014. Ultrafine particles in cities. Environ. Int. 66:1–10. doi:10.1016/j.envint.2014.01.013. http://www.sciencedirect.com/science/article/pii/S016041201400018X?np=y.
- Lambe, A.T., J.M. Logue, N.M. Kreisberg, S.V. Hering, D.R. Worton, A.H. Goldstein, N.M. Donahue, and A.L. Robinson. 2009. Apportioning black carbon to sources using highly time-resolved ambient measurements of organic molecular markers in Pittsburgh. Atmos. Environ. 43:3941–50. doi:10.1016/j.atmosenv.2009.04.057. http://nature.berkeley.edu/ahg/pubs/Lambe%20et%20al%202009%20Atmos%20Env.pdf.
- Mauderly, J.L. 1994. Toxicological and epidemiological evidence for health risks from inhaled engine emissions. Environ. Health Perspect. 102:165–71. doi:10.2307/3431948
- May, A.A., N.T. Nguyen, A.A. Presto, T.D. Gordon, E.M. Lipsky, M. Karve, A. Gutierrez, W.H. Robertson, M. Zhang, C. Brandow, O. Chang, S. Chen, P. Cicero-Fernandez, L. Dinkins, M. Fuentes, S.-M. Huang, R. Ling, J. Long, C. Maddox, J. Massetti, E. McCauley, A. Miguel, K. Na, R. Ong, Y. Pang, P. Rieger, T. Sax, T. Truong, T. Vo, S. Chattopadhyay, H. Maldonado, M.M. Maricq, and A.L. Robinson. 2014. Gas- and particle-phase primary emissions from in-use, on-road gasoline and diesel vehicles. Atmos. Environ. 88(0): 247–60. doi:10.1016/j.atmosenv.2014.01.046. http://www.sciencedirect.com/science/article/pii/S1352231014000715.
- McCarthy, M.C., J.F. Ludwig, S.G. Brown, D.L. Vaughn, and P.T. Roberts. 2013. Filtration effectiveness of HVAC systems at near-roadway schools. Indoor Air 23(3): 196–207. doi:10.1111/ina.12015. STI-906034-3629. http://onlinelibrary.wiley.com/doi/10.1111/ina.12015/abstract.
- Morawska, L., Z. Ristovski, E.R. Jayaratne, D.U. Keogh, and X. Ling. 2008. Ambient nano and ultrafine particles from motor vehicle emissions: Characteristics, ambient processing and implications on human exposure. Atmos. Environ. 42:8113–38. doi:10.1016/j.atmosenv.2008.07.050. http://www.sciencedirect.com/science/article/pii/S1352231008006961.
- Pant, P., and R.M. Harrison. 2013. Estimation of the contribution of road traffic emissions to particulate matter concentrations from field measurements: A review. Atmos. Environ. 77:78–97. doi:10.1016/j.atmosenv.2013.04.028. http://www.sciencedirect.com/science/article/pii/S1352231013002732.
- Pieters, N., G. Koppen, M. Van Poppel, S. De Prins, B. Cox, E. Dons, V. Nelen, et al. 2015. Blood pressure and same-day exposure to air pollution at school: Associations with nano-sized to coarse PM in children. Environ. Health Perspect. 123(7): 737–42. doi:10.1289/ehp.1408121. http://ehp.niehs.nih.gov/1408121/.
- Reche, C., X. Querol, A. Alastuey, M. Viana, J. Pey, T. Moreno, S. Rodríguez, et al. 2011. New considerations for PM, black carbon and particle number concentration for air quality monitoring across different European cities. Atmos. Chem. Phys. 11(13): 6207–27. doi:10.5194/acp-11-6207-2011. http://www.atmos-chem-phys.net/11/6207/2011/.
- Riddle, S.G., M.A. Robert, C.A. Jakober, M.P. Hannigan, and M.J. Kleeman. 2007. Size distribution of trace organic species emitted from heavy-duty diesel vehicles. Environ. Sci. Technol. 41(6): 1962–9. doi:10.1021/es0617183.
- Riddle, S.G., M.A. Robert, C.A. Jakober, M.P. Hannigan, and M.J. Kleeman. 2008. Size-resolved source apportionment of airborne particle mass in a roadside environment. Environ. Sci. Technol. 42(17): 6580–6. doi:10.1021/es702827h.
- Ristovski, Z.D., B. Miljevic, N.C. Surawski, L. Morawska, K.M. Fong, F. Goh, and I.A. Yang. 2012. Respiratory health effects of diesel particulate matter. Respirology 17:201–12. doi:10.1111/j.1440-1843.2011.02109.x.
- Robert, M.A., S. VanBergen, M.J. Kleeman, and C.A. Jakober. 2007. Size and composition distributions of particulate matter emissions: Part 1—Light-duty gasoline vehicles. J. Air Waste Manage. Assoc. 57(12): 1414–28. doi:10.3155/1047-3289.57.12.1414.
- Robinson, A.L., N.M. Donahue, M.K. Shrivastava, E.A. Weitkamp, A.M. Sage, A.P. Grieshop, T.E. Lane, J.R. Pierce, and S.N. Pandis. 2007. Rethinking organic aerosols: Semivolatile emissions and photochemical aging. Science 315:1259. doi:10.1126/science.1133061
- Rodríguez, S., R.V. Dingenen, J.-P. Putaud, A. Dell’Acqua, J. Pey, X. Querol, A. Alastuey, et al. 2007. A study on the relationship between mass concentrations, chemistry and number size distribution of urban fine aerosols in Milan, Barcelona and London. Atmos. Chem. Phys. 7:2217–32. doi:10.5194/acp-7-2217-2007. http://www.atmos-chem-phys.net/7/2217/2007/.
- Salma, I., T. Borsós, Z. Németh, T. Weidinger, P. Aalto, and M. Kulmala. 2014. Comparative study of ultrafine atmospheric aerosol within a city. Atmos. Environ. 92:154–61. doi:10.1016/j.atmosenv.2014.04.020. http://www.sciencedirect.com/science/article/pii/S1352231014002921.
- Schwarze, P., J. Øvrevik, M. Låg, M. Refsnes, P. Nafstad, R. Hetland, and E. Dybing. 2006. Particulate matter properties and health effects: consistency of epidemiological and toxicological studies. Hum. Exp. Toxicol. 25(10): 559–79, doi:10.1177/096032706072520 http://het.sagepub.com/content/25/10/559.abstract.
- Seagrave, J., J.D. McDonald, E. Bedrick, E.S. Edgerton, A.P. Gigliotti, J.J. Jansen, L. Ke, L.P. Naeher, S.K. Seilkop, M. Zheng, and J.L. Mauderly. 2006. Lung toxicity of ambient particulate matter from southeastern U.S. sites with different contributing sources: Relationships between composition and effects. Environ. Health Perspect. 114(9): 1387–93. doi:10.1289/ehp.9234
- South Coast Air Quality Management District. 2000. MATES-II: Multiple Air Toxics Exposure Study in the South Coast Air Basin. Final report prepared by the South Coast Air Quality Management District, Diamond Bar, CA, March. http://www.aqmd.gov/matesiidf/matestoc.htm.
- South Coast Air Quality Management District. 2008. MATES-III: Multiple Air Toxics Exposure Study in the South Coast Air Basin. Final report prepared by the South Coast Air Quality Management District, Diamond Bar, CA, September. http://www.aqmd.gov/home/library/air-quality-data-studies/health-studies/mates-iii/mates-iii-final-report.
- South Coast Air Quality Management District. 2015a. Multiple Air Toxics Exposure Study in the South Coast Air Basin: MATES IV. Final report, May. http://www.aqmd.gov/docs/default-source/air-quality/air-toxic-studies/mates-iv/mates-iv-final-draft-report-4-1-15.pdf?sfvrsn=7.
- South Coast Air Quality Management District. 2015b. Multiple Air Toxics Exposure Study: MATES IV final report. http://www.aqmd.gov/docs/default-source/air-quality/air-toxic-studies/mates-iv/mates-iv-final-draft-report-4-1-15.pdf?sfvrsn=7 (accessed February 8, 2017).
- Sowlat, M.H., S. Hasheminassab, and C. Sioutas. 2016. Source apportionment of ambient particle number concentrations in central Los Angeles using positive matrix factorization (PMF). Atmos. Chem. Phys. 16:4849–66. doi:10.5194/acp-16-4849-2016. http://www.atmos-chem-phys.net/16/4849/2016/.
- Stanier, C.O., A.Y. Khlystov, and S.N. Pandis. 2004. Nucleation events during the Pittsburgh Air Quality Study: Description and relation to key meteorological, gas phase, and aerosol parameters. Aerosol Sci. Technol. 38(S1): 253–64, doi:10.1080/02786820390229570.
- Sun, Y., X. Song, Y. Han, Y. Ji, S. Gao, Y. Shang, S. Lu, T. Zhu, and W. Huang. 2015. Size-fractioned ultrafine particles and black carbon associated with autonomic dysfunction in subjects with diabetes or impaired glucose tolerance in Shanghai, China. Part. Fibre Toxicol. 12(8). doi:10.1186/s12989-015-0084-6. http://particleandfibretoxicology.biomedcentral.com/articles/10.1186/s12989-015-0084-6.
- U.S. Environmental Protection Agency. 2010. Final revisions to the primary national ambient air quality standard for nitrogen dioxide. https://www3.epa.gov/ttn/naaqs/standards/nox/fr/20100209.pdf (accessed February 8, 2017).
- Urman, R., J. Gauderman, S. Fruin, F. Lurmann, F. Liu, R. Hosseini, M. Franklin, E. Avol, B. Penfold, F. Gilliland, B. Brunekreef, and R. McConnell. 2014. Determinants of the spatial distributions of elemental carbon and particulate matter in eight Southern Californian communities. Atmos. Environ. 86:84–92. doi:10.1016/j.atmosenv.2013.11.077. http://www.sciencedirect.com/science/article/pii/S1352231013009485.
- Urman, R., R. McConnell, T.S. Islam, E.L. Avol, F.W. Lurmann, H. Vora, W.S. Lin, E.B. Rappaport, F.D. Gilliland, and W.J. Gauderman. 2014. Associations of children’s lung function with ambient air pollution: Joint effects of regional and near-roadway pollutants. Thorax 69(6): 540–7, doi:10.1136/thoraxjnl-2012-203159.
- von Bismarck-Osten, C., W. Birmili, M. Ketzel, A. Massling, T. Petäjä, and S. Weber. 2013. Characterization of parameters influencing the spatio-temporal variability of urban particle number size distributions in four European cities. Atmos. Environ. 77:415–29. doi:10.1016/j.atmosenv.2013.05.029.
- Weingartner, E., H. Burtscher, and U. Baltensperger. 1997. Hygroscopic properties of carbon and diesel soot particles. Atmos. Environ. 31(15): 2311–27. doi:10.1016/S1352-2310(97)00023-X
- Wong, C.P., T.L. Chan, and C.W. Leung. 2003. Characterisation of diesel exhaust particle number and size distributions using mini-dilution tunnel and ejector-diluter measurement techniques. Atmos. Environ. 37(31): 4435–46. doi:10.1016/S1352-2310(03)00571-5
- Zhu, Y., D.C. Fung, N. Kennedy, W.C. Hinds, and A. Eiguren-Fernandez. 2008. Measurements of ultrafine particles and other vehicular pollutants inside a mobile exposure system on Los Angeles freeways. J. Air Waste Manage. Assoc. 58(3): 424–34. doi:10.3155/1047-3289.58.3.424.