
ABSTRACT
An explicit NOx chemistry method has been implemented in AERMOD version 15181, ADMSM. The scheme has been evaluated by comparison with the methodologies currently recommended by the U.S. EPA for Tier 3 NO2 calculations, that is, OLM and PVMRM2. Four data sets have been used for NO2 chemistry method evaluation. Overall, ADMSM-modeled NO2 concentrations show the most consistency with the AERMOD calculations of NOx and the highest Index of Agreement; they are also on average lower than those of both OLM and PVMRM2. OLM shows little consistency with modeled NOx concentrations and markedly overpredicts NO2. PVMRM2 shows performance closer to that of ADMSM than OLM; however, its behavior is inconsistent with modeled NOx in some cases and it has less good statistics for NO2. The trend in model performance can be explained by examining the features particular to each chemistry method: OLM can be considered as a screening model as it calculates the upper bound of conversion from NO to NO2 possible with the background O3 concentration; PVMRM2 includes a much-improved estimate of in-plume O3 but is otherwise similar to OLM, assuming instantaneous reaction of NO with O3; and ADMSM allows for the rate of this reaction and also the photolysis of NO2. Evaluation with additional data sets is needed to further clarify the relative performance of ADMSM and PVMRM2.
Implications: Extensive evaluation of the current AERMOD Tier 3 chemistry methods OLM and PVMRM2, alongside a new scheme that explicitly calculates the oxidation of NO by O3 and the reverse photolytic reaction, shows that OLM consistently overpredicts NO2 concentrations. PVMRM2 performs well in general, but there are some cases where this method overpredicts NO2. The new explicit NOx chemistry scheme, ADMSM, predicts NO2 concentrations that are more consistent with both the modeled NOx concentrations and the observations.
Introduction
Planners and policymakers are concerned about levels of nitrogen dioxide (NO2) in the atmosphere due to the associated negative health and environmental effects. Six principal pollutants are included in the U.S. Environmental Protection Agency (EPA) National Ambient Air Quality Standards (NAAQS), including NO2. NO2 has both hourly and annual standards: the 98th percentile of 1-hr daily maximum concentrations averaged over 3 years must not exceed 100 ppb and the annual mean must be lower than 53 ppb. The hourly concentrations of NO2 are significantly affected by atmospheric chemical reactions. Atmospheric dispersion models that are used to predict pollutant concentration levels for comparison with the NAAQS must therefore allow for chemical reactions of NO2; this is achieved either by solving the chemical rate equations or by using simplified approaches.
When nitrogen oxide (NOx, the sum of NO and NO2) is emitted from a combustion process via an industrial stack, the NO2/NOx in-stack ratios for many source types are typically of the order 5–20% (ISR, Citation2016). This is much lower than the proportion of NOx that is NO2 in the atmosphere well downstream of sources, which typically lies in the range 50–90% depending on solar intensity and ambient pollution levels; see, for example, Guerreiro et al. (Citation2010).
At short time scales (up to several minutes) the most important chemical reactions can be described by the following coupled system:
In order to predict NO2 concentrations, these reactions need to be allowed for in local air dispersion models such as AERMOD (Cimorelli et al., Citation2004) and ADMS (Carruthers et al., Citation1994); the level of complexity should relate to the application. AERMOD version 15181 includes a number of chemistry methods for predicting NO2 concentrations. The current regulatory approaches are tiered, with Tier 1 assuming full conversion of all NOx to NO2; Tier 2, in which a fixed equilibrium ratio of NO2 to NOx is applied to annual average NOx concentrations; and Tier 3, where detailed site-specific ratios of NO2 to NOx are calculated. In the most recent U.S. EPA proposals for the revision of the Guideline on Air Quality Models (EPA, Citation2015a) the Ambient Ratio Method 2 (ARM2) (Podrez, Citation2015) is recommended for Tier 2 calculations, and the ozone limiting method (OLM) (Cole and Summerhays, Citation1979) and the plume volume molar ratio method (PVMRM) (Hanrahan, Citation1999a) are recommended for Tier 3. The latest version of PVMRM (PVMRM2) is the most advanced method based on estimates of the amount of O3 entrained into the plume during advection downstream; however, PVMRM2 assumes reaction (1) is instantaneous and neglects the photolysis of NO2, reaction (2). This paper presents model evaluation of a modified version of AERMOD 15181 that includes an explicit representation of both reactions (1) and (2). This ADMS Method (hereafter referred to as ADMSM) is a modification to the explicit NOx chemistry scheme that is included in the ADMS dispersion model (Carruthers et al., Citation2003).
Model evaluation results from four U.S. databases are presented in this paper: specifically, the Palaau (Hawaii) and Empire Abo (New Mexico) databases, previously used for evaluation of PVMRM by Hanrahan (Citation1999b); the Wainwright (Alaska) database used for evaluation of OLM and PVMRM by Hendrick et al. (Citation2013); and the Prudhoe Bay (Alaska) database, which was used for evaluation of the ADMS chemistry schemes in Smith et al. (Citation2016). The focus of this work is on assessing model performance for Tier 3 evaluations; consequently, results from ADMSM are presented alongside those from OLM and PVMRM2. Model performance measures used comprise statistics relating to overall model predictions of average and maximum concentrations, in addition to chemistry method performance measures.
When assessing a model’s ability to predict NO2 concentrations, it is necessary to distinguish the performance of the chemical schemes from the performance of the base model determined by dispersion and model inputs. NOx concentrations are unaffected by local chemistry, so evaluation of model predictions for NOx needs to be undertaken alongside NO2 in order to reach correct conclusions regarding chemistry method performance. Good chemistry method performance is signified by consistency between model predictions of NOx and NO2, not necessarily by good performance for NO2; in particular, if NOx is overestimated then NO2 should be overestimated and NO2/NOx underestimated, and the converse is true if NOx is underestimated.
Current AERMOD chemistry methods
The methodology used and limitations of the AERMOD chemistry methods currently recommended for use in Tier 3 evaluations are discussed in the following. Prior to this discussion, it is helpful to briefly recall the processes taking place within a dispersing plume of material released into the atmosphere from a source transported downstream by the wind, as shown in . This “instantaneous” plume meanders in the transverse and vertical directions due to turbulent eddies with length scales larger than the plume width, and it is also meanders in the transverse direction due to meso-scale changes in wind direction. Turbulent eddies with length scales smaller than the instantaneous plume width entrain ambient air into the instantaneous plume and increase its size. This ambient air contains “background” pollutant concentration levels, so entrainment is the mechanism by which background pollution, including O3, enters the plume. Since ambient air takes time to mix across the plume, more ambient air is entrained at the instantaneous plume edges as ambient air entrained earlier is mixed toward the center of the plume; thus, at any particular distance downstream background pollution entrained into the plume has a range of residence times limited by the time it takes for the plume to be advected to that distance downstream. Finally, we note that dispersion models generally predict concentrations within the ensemble plume, which represents an average of the instantaneous plume concentration over an appropriate averaging time, typically 1 hr ().
Figure 1. Diagrammatic representation of the chemistry processes within a plume.
OLM
OLM is a method recommended for use in Tier 3 evaluations. Primary NO and NO2 concentrations due to each emission source are determined by the underlying dispersion model, AERMOD. OLM determines the generation of secondary NO2 at a receptor point from the oxidation of NO by O3 (reaction (1)) by assuming an infinite rate constant, and using the NO concentration determined from the sum of NO from all plumes contributing at the receptor point and the background O3 concentration. The total NO2 concentration is determined by summing this NO2 concentration with primary NO2 in the plume. A constant ambient equilibrium ratio may be applied as an upper limit on the percentage of NOx that is NO2. The method requires specification of background O3 concentrations (which may be hourly), an ambient NO2/NOx ratio and an in-stack NO2/NOx ratio. The method will, in general, overestimate the conversion of NO to NO2 as it assumes reaction (1) is instantaneous, neglects photolysis of NO2, and assumes that the O3 concentration in the plume is that of the background.
PVMRM2
PVMRM2 is a modification to PVMRM that the U.S. EPA recommends for use with Tier 3 evaluations. As with OLM, this method determines the NO2 concentration arising from oxidation of NO by O3 from reaction (1), assuming an infinite rate constant and using the total NO from all plumes contributing at a receptor point as determined by AERMOD. In PVMRM2 the amount of O3 available for reaction is determined from the dilution of the instantaneous plume (“relative plume” in PVMRM literature), which is directly related to the entrainment of ambient air and hence O3. At a particular downstream distance the O3/NOx ratio in the instantaneous plume is converted to an NO2/NOx ratio from reaction (1) with an infinite rate constant. This is then applied to ensemble mean plume NOx concentrations to determine NO2 concentrations.
In stable conditions, the dimensions of the instantaneous plume are assumed to be a fixed proportion of the ensemble mean plume predicted by AERMOD. In convective conditions the instantaneous plume size is calculated directly from the turbulence dissipation rate and source–receptor travel time (EPA, Citation2015b). When more than one plume contributes to the NOx concentration, the width of the instantaneous plume is extended to encompass the major contributing sources with dimension equal to the largest transverse distance between the contributing sources plus the “instantaneous” width of the dominant plume. PVMRM2 requires the same model inputs as OLM, that is, background O3 concentrations, an ambient NO2/NOx ratio, and an in-stack NO2/NOx ratio.
PVMRM2 more accurately predicts the concentration of O3 in the plume compared with OLM, but, as with OLM, the method assumes reaction (1) is instantaneous and does not account for photolysis of NO2. Further, some aspects of the model formulation appear inconsistent. For instance, in stable conditions, the assumption that the dimensions of the instantaneous plume depend linearly on ensemble mean plume size is not correct since the instantaneous plume growth depends on turbulence with length scales smaller than the instantaneous plume dimensions, but the ensemble mean plume dimensions are affected by all turbulent length scales (Thomson, Citation1990).
In addition, the use of different plume dimension formulations for stable and convective cases means there may be step changes in model predictions during the transition between stable and convective meteorological conditions. Finally, the PVMRM2 approach to accounting for multiple plumes may lead to discontinuities in model predictions as the sources included within the plume width calculations may vary between output locations.
Explicit NOx chemistry method (ADMSM)
In this section we describe the ADMSM chemistry scheme that has been implemented in AERMOD. As with the implementation of PVMRM2 in AERMOD, ADMSM is applied to the plume NOx concentrations calculated by AERMOD. ADMSM also uses an approach broadly similar to PVMRM2 for entrainment of ambient O3 and NOx, making use of the instantaneous plume spread to determine the O3 available for chemical reactions occurring within the plume; however, there are significant differences in detail.
The stages in the analysis are as follows. At each receptor, the standard AERMOD dispersion routines are used to calculate the ensemble plume NOx and primary NO2 concentration from each source. For each receptor and source combination, the instantaneous plume concentration is evaluated from the ensemble plume concentration using the ratio of cross-sectional areas of the ensemble and instantaneous plumes, and also the amount of background material entrained into the plume is calculated. The expression for the instantaneous plume spread, (m), is based on Thomson (Citation1990) and is calculated as
where is the ensemble plume spread (m),
is the source diameter (m),
is the source–receptor travel time (sec), and
is the energy dissipation rate (m2/sec3).
Total concentrations of NO, NO2, and O3 at each receptor are calculated by summing the instantaneous plume concentrations and the “minimum” entrained background concentration; this “minimum” is taken to be the lowest entrained background over all plumes that contribute significantly to the concentration at the receptor. This necessarily provides an upper bound for the O3 concentration, since the ozone concentration mixed into one plume from another plume is always less than or equal to the background ozone concentration. This limit thus allows for some, but not necessarily all, of the reduction in the entrained ozone concentration due to interacting plumes.
The following chemical reaction scheme is then applied to the total concentration of unreacted pollutants at each receptor point:
with reaction coefficient and photo-dissociation rate
defined as
where is the temperature (K) and
is solar radiation (W/m2). These coefficients have been taken from the Generic Reaction Set (GRS) chemistry scheme, which is a semi-empirical photochemical model developed originally by CSIRO in Australia (Azzi and Johnson, Citation1992; Venkatram et al., Citation1994). A fifth-order Runge–Kutta scheme with adaptive time-stepping is used to solve the equations, to give “postchemistry” concentrations at each receptor.
The postchemistry NO and NO2 values at each receptor are partitioned between the sources, based on the partitioning of the prechemistry NOx, to give postchemistry NO and NO2 instantaneous plume concentrations for each receptor and source combination. The postchemistry ensemble plume concentrations are then calculated from these postchemistry instantaneous plume concentration values, again using the ratio of the plume cross-sectional areas.
Input required for ADMSM includes NOx as calculated by AERMOD, emission rates for NOx and NO2, and (preferably hourly) background concentrations of O3, and in addition background (hourly) concentrations of NOx and NO2 concentrations if not negligible. The model derives photolysis rates from solar radiation and the reaction time, which is calculated, at each receptor point, as the concentration weighted average of the travel time from each source to the receptor under consideration.
ADMSM provides a more complete model of plume chemistry scheme than either OLM or PVMRM2; however, there inevitably remain some limitations in this scheme, which include the following: The assumption that the reaction time is the concentration-weighted average of the travel time from each source to the receptor does not allow for the fact that ozone is entrained continuously, resulting in a tendency to overestimate reaction time and hence NO2. In common with PVMRM2, the method assumes uniform mixing of entrained O3 across a plume, again tending to overestimate NO2, and finally, it does not account for the effect of building-induced turbulence on the growth of the instantaneous plume, which could result in increased rates of entrainment of O3 increasing NO2.
AERMOD applies a minimum O3 value of 40 ppb in stable conditions, to account for higher concentrations of O3 above ground in stable conditions. However, the use of a hard-coded limit is difficult to justify in general, so for the implementation of ADMSM in AERMOD, this restriction has been removed; the restriction remains in PVMRM2. The application of this minimum value only affects a relatively small proportion of meteorological conditions, so it does not impact significantly on model predictions.
Evaluation databases
The evaluation makes use of four databases. Of these, three (Palaau, Empire Abo, and Wainwright) have been discussed in the literature in relation to the evaluation of OLM and PVMRM2 within AERMOD. The fourth database relates to a measurement campaign undertaken in the vicinity of a drilling rig in Prudhoe Bay, Alaska, that has previously been used to evaluate ADMS chemistry schemes. No quantitative attempt has been made to assess the uncertainties associated with each study, as this would require a detailed inspection of all source data used to generate all model inputs. However, as the accuracy of emissions data directly relates to the accuracy of model outputs, it is of note that the Palaau and Empire Abo databases have time-independent emission data, whereas Wainwright includes hourly data that have been derived from fuel use data; Prudhoe Bay emissions data are calculated from daily fuel use data.
Brief descriptions of the data sets are given in the following, and summarizes the data-set configurations.
Table 1. Summary of the model evaluation data-set configurations.
Palaau
A full year (1993) of hourly, ground-level measurements of NOx, NO2, and O3 was recorded by the Hawaii Department of Health at a monitoring station located 220 m northwest of the Palaau Generating Station on the island of Molokai in Hawaii. The station consisted of four diesel-engine generators and an oil-fired combustion turbine; no source was dominant.
The AERMOD input files configured to represent Palaau were provided by the EPA and have been used for several model evaluation studies (MACTEC, Citation2005; EPA, Citation2011). Some changes were made to these files. Specifically, the in-stack-ratio for Palaau emissions was reduced from 20% to 10%; this change was motivated by inspection of the observation data. shows the observed NO2/NOx values, and clearly the minimum NO2/NOx is 10% or less at the receptor. In the majority of meteorological conditions this ratio increases with distance from the stack; thus, the in-stack ratio for the sources at Palaau is closer to 10% than to 20%. Background concentrations of NOx and NO2 have been estimated as an average of the concentrations from all wind directions apart from those considered for the model evaluation.
Figure 2. Palaau observed NO2/NOx shown as a function of observed NOx concentrations.
Empire Abo
The Empire Abo Gas plant in New Mexico includes a number of different sources: 15 compressor engines, five boilers, two heaters, a sulfur recovery unit flare, an inlet flare, an acid gas flare, and a diesel fire pump; as for Palaau, no source was dominant. Hourly ground-level measurements of NOx, NO2, and O3 were recorded at two monitors, one located 1.6 km north of the plant, and one 2.5 km south, from June 1993 to June 1994.
The AERMOD input files configured to represent Empire Abo were provided by the EPA and have been used for several model evaluation studies (MACTEC, Citation2005; EPA, Citation2011). Some changes were made to these files. Specifically, using the same method for inspecting the observed NO2/NOx ratio as Palaau, the in-stack ratio for Empire Abo sources was reduced from 20% to 10%. For each hour, background concentrations of NOx and NO2 have been taken as the concentrations recorded by the upwind monitor. Concentrations recorded at the north and south monitors have otherwise been treated as separate data sets.
Wainwright
The database consists of measurements from a single monitor located about 500 m to the east-southeast of a small power plant; the plant is close to Wainwright, a town on the coast of northwest Alaska. The power plant has five generators, each with an exhaust chimney. The monitoring campaign lasted approximately 1 year (September 2009 to September 2010) and hourly concentrations of a full range of pollutants were recorded; NOx, NO2, and O3 are used in this evaluation exercise.
The model configuration used in this work is based on that presented in Hendrick et al. (Citation2013). However, following inspection of the source data, the authors corrected errors relating to unit conversions and stack parameter data (although these corrections did not significantly alter the model results); the NO2/NOx ratio was reduced from 20% to 10% following inspection of the observations, following the same methodology as that used for Palaau. As the Wainwright site is remote and removed from anthropogenic pollution sources, background concentrations of NOx and NO2 have been neglected.
Prudhoe Bay
Prudhoe Bay A Pad is an oil well on the Alaska North Slope. For this study, measurement equipment was installed approximately 60 m northwest of a drilling rig for a 40-day period in January and February 2007. In addition to hourly NOx, NO2, and O3 concentrations, meteorological measurements were recorded at the monitor. Of the 10 sources of emissions on the rig, releases from only three of the generators were considered sufficiently large to include in the modeling.
In contrast to the other evaluation databases, upper air and mixing height meteorological data were not available for input to AERMOD’s meteorological preprocessor, AERMET. Consequently, a subset of meteorological parameters from Smith et al. (Citation2016), which have been processed using the ADMS meteorological preprocessor, are used in the current study.
Results and discussion
Model predictions are compared to observations for the cases where the wind disperses the plume in the direction of the monitor. For all studies apart from Prudhoe Bay, a wind sector of 60° was used, whereas for Prudhoe Bay, the proximity of the monitor to the rig allowed a larger wind sector (85°). As the focus of the paper is to assess the performance of chemistry schemes within AERMOD, not the performance of the dispersion model itself, it is important to distinguish AERMOD’s performance in predicting NOx from the performance of the chemistry schemes in predicting NO2 concentrations from the calculated NOx. Consequently, in the following discussion, NOx model predictions are presented alongside NO2 predictions, and the accuracy of model predictions for the NO2/NOx ratio is analyzed. In order to avoid singular behavior in the results when the NO2/NOx ratio is calculated, observed values with NOx < 20 µg/m3 have been removed from the analyses.
presents quantile–quantile plots of NOx alongside those for NO2, for each study separately. Model performance in terms of predictions of NOx concentrations (plots on the left) is determined by the dispersion model formulation and the accuracy of model inputs. Modeled NOx concentrations are underpredicted for three of the studies (Palaau, Empire Abo North, and Prudhoe Bay). Conversely, the majority of the AERMOD NOx concentrations predicted at Empire Abo South and Wainwright are overpredicted.
Figure 3. Quantile–quantile plots of NOx (left) and NO2 (right) for all studies: (a) Palaau NOx. (b) Palaau NO2, with a black arrow indicating the data point for which the NO2 concentration predicted by PVMRM exceeds that predicted by OLM. (c) Empire Abo North NOx. (d) Empire Abo North NO2. (e) Empire Abo South NOx. (f) Empire Abo South NO2. (g) Prudhoe Bay NOx. (h) Prudhoe Bay NO2. (i) Wainwright NOx. (j) Wainwright NO2. NO2 concentrations colored by chemistry method; data points corresponding to observed NOx ≥ 20 µg/m3 included.
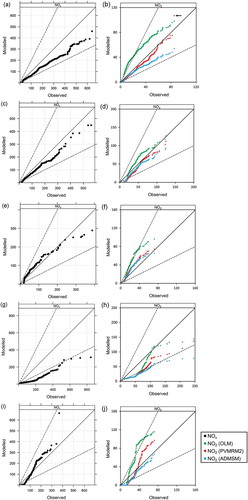
In , qualitatively good model performance in terms of NOx chemistry is indicated by the NOx and NO2 quantile–quantile plots showing broadly consistent trends, and, in particular, if NOx is over-/underpredicted then NO2 should also be over-/underpredicted. Taking for example the Palaau case, OLM overestimates NO2 in contrast to NOx, which is underestimated, and the trends are also different, showing poor performance of OLM. By contrast, there is a broad level of consistency between the ADMSM prediction of NO2 and the AERMOD prediction of NOx. PVMRM2 shows consistency for low NOx values but appears inconsistent for higher NOx, overestimating generation of NO2. Note that the highest value of NO2 predicted by PVMRM2 is greater than the upper bound for NO2 as determined by OLM; this can be seen by the red data point in (indicated by an arrow), which is higher than the green data point corresponding to the same observed NO2 concentration. Considering the quantile–quantile plots for all the studies, we can conclude in broad qualitative terms that the OLM prediction of NO2 is generally inconsistent with the calculated NOx and is overestimated for all cases; ADMSM appears consistent for each of the studies except Wainwright; and PVMRM2 is consistent for each of the studies for low values of NO2, but tends to overpredict the higher values more, especially for Palaau and Prudhoe Bay.
Further insight is gained from examining the mean NO2/NOx hourly ratio for each case study for the different chemistry methods (). First, considering only observation data, there is a general trend for measured NO2/NOx ratios to increase with distance of the receptor from the source, which is consistent with conversion of NO to NO2 as the plume moves downwind of the source. The exception to this is Prudhoe Bay, where conversion is fast due to the initial plume concentration of NO being relatively small and the measurements only taking place in the Alaskan winter when the rate of photolysis is very small at most.
Figure 4. Comparison of predicted average hourly NO2 to NOx ratios against the observed value for cases where observed NOx ≥ 20 µg/m3; studies presented according to source–receptor distance (closest on left).
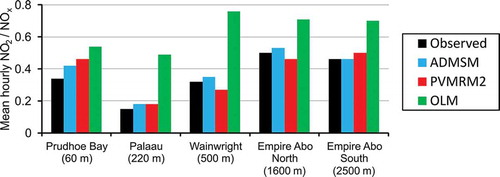
In terms of the modeled mean hourly NO2/NOx ratios, if AERMOD NOx predictions are underestimated, then a consistent model should overpredict the NO2/NOx ratio. This is because the conversion from NO to NO2 occurs more rapidly as, relatively, there is more O3 available; the converse is also true. The ADMSM ratios shown in are consistent for all cases except Wainwright, PVMRM2 is consistent for three of the cases but not Empire Abo (North and South), and OLM is inconsistent, overpredicting the ratio by a considerable amount for each of the studies.
Further analysis of the performance of the chemistry methods in predicting hourly average concentrations of NO2 is provided by figures that show the ratio of modeled to observed NO2 against modeled to observed NOx, color coded according to the observed NOx concentration (Smith et al., Citation2016). These plots are shown in for each of the data sets. In order to interpret these plots, first consider a case where for a given hour a model predicts both NOx and NO2 precisely at a receptor point (location (1,1) on the plots), so in this case model inputs are accurate and both the dispersion model and the chemistry method are performing perfectly. Let us consider how the perfect chemistry method should perform if NOx is overpredicted due to inaccuracies in the dispersion or the NOx emission rate but with the background O3 and emission ratio NO2/NOx unchanged. The NO2 concentration will also increase, but this increase is less than linear with NOx because there is relatively less O3 to oxidize the NO. The consequence is that for a good chemistry model, if NOx is overpredicted by the model then NO2 should also in general be overpredicted, but the ratio of the modeled to observed values of NO2 should be smaller than the ratio of the modeled to observed values of NOx, and vice versa. With reference to the plots, a model has good performance for both NOx and NO2 if the points are focused on (1,1). However, even if NOx is not accurately predicted, good chemistry scheme performance is indicated by the points lying in the blue triangles between the diagonal and horizontal blue lines on the plots, and conversely, if the large proportion of points lie well outside the blue triangles the model is poor. It is noted that poor specification of the O3 background or the emission ratio of NO2/NOx may result in some deviation from the preceding, which may explain some of the scatter in the figures, in addition to the chemistry model performance.
Figure 5. Ratio of modeled to observed NO2 against the ratio of modeled to observed NOx for ADMSM (left), PVMRM2 (middle), and OLM (right) for (a) Palaau, (b) Empire Abo North,. (c) Empire Abo South, (d) Prudhoe Bay, and (e) Wainwright. Points are colored by observed NOx concentration; ratios between 0.1 and 10.0 only presented, but all data points corresponding to observed NOx ≥ 20 µg/m3 are included in the analysis (see ).
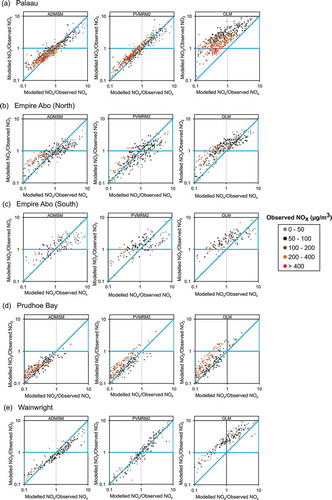
With reference to , for ADMSM, for all cases except Prudhoe Bay, the points generally show the characteristics of good chemistry scheme performance with most points lying within or close to the two blue triangles, most particularly for Palaau; fewer points lie within the triangles for PVMRM2, indicating somewhat less good performance and a lower correlation between errors in NOx and errors in NO2 for that scheme. By contrast, the performance of OLM as indicated by these plots is poor, with most points lying outside the triangles designating appropriate sensitivity of NO2 to NOx. Summarizing the percentage of points within the blue triangles () confirms that ADMSM shows the most consistent performance.
Table 2. Summary of the percentage of points within the ‘correct’ triangles (highlighted in blue in ; observed NOx ≥ 20 µg/m3), with best statistics in bold.
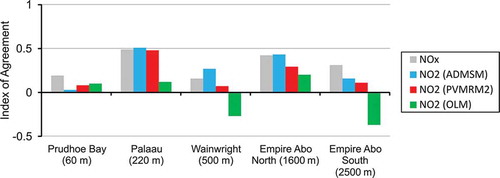
Finally, we present some overall statistics of the performance of AERMOD in predicting NOx and of the performance of AERMOD together with the chemistry schemes in predicting NO2. Of particular interest is whether the different performance of the chemistry schemes discussed in the preceding has significance for predicted NO2 concentrations. The statistic used is the Index of Agreement, IoA (Willmott et al., Citation2011), given by
where and
are individual observation and prediction values, respectively, and
is the mean of observed values. This parameter spans between –1 and +1, with values approaching +1 representing better model performance. shows IoA values for all studies for both NOx and NO2. First, considering AERMOD model performance in terms of prediction of NOx concentrations, the Palaau, Empire Abo (North), and Empire Abo (South) data sets are the most robust, with IoA values of 0.48, 0.42, and 0.31, respectively; the IoA is lower for Prudhoe Bay and Wainwright with values of 0.19 and 0.16, respectively. With reference to the IoA values for NO2, ADMSM gives the best performance for all cases except Prudhoe Bay. By contrast, the performance of OLM is poor. PVMRM2’s performance is generally closer to that of ADMSM than that of OLM.
Figure 6. Index of Agreement for NOx and NO2 predictions; studies presented according to source–receptor distance (closest on left); observed NOx ≥ 20 µg/m3.
Conclusion
This paper presents an evaluation of the AERMOD Tier 3 methodologies OLM and PVMRM2 for predicting NO2 concentrations, alongside an explicit NOx chemistry scheme implemented in AERMOD, ADMSM. Four U.S. data sets are used for evaluation purposes, specifically, Palaau (Hawaii), Empire Abo (New Mexico), Wainwright (Alaska), and Prudhoe Bay (Alaska); the Empire Abo campaign includes measurements from monitors located to the north and south of the site, so provides two data sets.
Considering all the data sets, ADMSM-modeled concentrations of NO2 show the most consistency with the AERMOD calculations of NOx and the highest Index of Agreement. ADMSM predictions are on average lower than those from both OLM and PVMRM2. OLM shows little consistency with modeled NOx and markedly overpredicts NO2. PVMRM2 shows performance closer to that of ADMSM than OLM; however, it shows anomalous behavior in some cases and has less good statistics for NO2. This trend in model performance can be explained by examining the features particular to each chemistry method: OLM can be considered as a screening model, as it calculates an upper bound for conversion of NO to NO2 possible for the background O3 concentration; PVMRM2 includes a much-improved estimate of in-plume O3 but is otherwise similar to OLM, assuming instantaneous reaction of NO with O3; and ADMSM allows for the rate of this reaction and also the photolysis of NO2.
Funding
This work was funded by the American Petroleum Institute.
Additional information
Funding
Notes on contributors
David J. Carruthers
All authors have or had affiliations with Cambridge Environmental Research Consultants (CERC): David J. Carruthers is Technical Director, Jenny R. Stocker a Principal Consultant, Andrew Ellis worked for CERC as a Consultant, Martin D. Seaton is a Principal Consultant, and Stephen E. Smith a Consultant.
Jenny R. Stocker
All authors have or had affiliations with Cambridge Environmental Research Consultants (CERC): David J. Carruthers is Technical Director, Jenny R. Stocker a Principal Consultant, Andrew Ellis worked for CERC as a Consultant, Martin D. Seaton is a Principal Consultant, and Stephen E. Smith a Consultant.
Andrew Ellis
All authors have or had affiliations with Cambridge Environmental Research Consultants (CERC): David J. Carruthers is Technical Director, Jenny R. Stocker a Principal Consultant, Andrew Ellis worked for CERC as a Consultant, Martin D. Seaton is a Principal Consultant, and Stephen E. Smith a Consultant.
Martin D. Seaton
All authors have or had affiliations with Cambridge Environmental Research Consultants (CERC): David J. Carruthers is Technical Director, Jenny R. Stocker a Principal Consultant, Andrew Ellis worked for CERC as a Consultant, Martin D. Seaton is a Principal Consultant, and Stephen E. Smith a Consultant.
Stephen E. Smith
All authors have or had affiliations with Cambridge Environmental Research Consultants (CERC): David J. Carruthers is Technical Director, Jenny R. Stocker a Principal Consultant, Andrew Ellis worked for CERC as a Consultant, Martin D. Seaton is a Principal Consultant, and Stephen E. Smith a Consultant.
References
- Azzi, M., and G. Johnson. 1992. An introduction to the generic reaction set photochemical smog mechanism. Proc. 11th Clean Air Conf. 4th Regional IUAPPA Conf., Brisbane, Australia.
- Carruthers, D.J., S.J. Dyster, and C.A. McHugh. 2003. Factors affecting inter-annual variability of NOx and NO2 concentrations from single point sources. Clean Air Environ. Protect. 33(1):15–20.
- Carruthers, D.J., R.J. Holroyd, J.C.R. Hunt, W-S. Weng, A.G. Robins, D.D. Apsley, D.J. Thompson, and F.B. Smith. 1994. UK-ADMS: A new approach to modelling dispersion in the earth’s atmospheric boundary layer. J. Wind Eng. Ind. Aerodynamics 52:139–53. doi:10.1016/0167-6105(94)90044-2
- Cimorelli, A.J., S.G. Perry, A. Venkatram, J.C. Weil, R.J. Paine, R.B. Wilson, R.F. Lee, W.D. Peters, R.W. Brode, and J.O. Paumier. 2004. AERMOD: Description of model formulation. U.S. Environmental Protection Agency, EPA-454/R-03-004, September.
- Cole, H.S., and J.E. Summerhays. 1979. A review of techniques available for estimating short-term NO2 concentrations. J. Air Pollut. Control Assoc. 29(8):812–7. doi:10.1080/00022470.1979.10470866
- Guerreiro, C., J. Horálek, F. de Leeuw, C. Hak, C. Nagl, P. Kurfürst, and J. Ostatnická. 2010. Status and trends of NO2 ambient concentrations in Europe. The European Topic Centre on Air and Climate Change (ETC/ACC) Technical paper 2010/19. https://www.researchgate.net/publication/260600537_Status_and_trends_of_NO2_ambient_concentrations_in_Europe (accessed March 1, 2017).
- Hanrahan, P.L. 1999a. The plume volume molar ratio method for determining NO2/NOx ratios in modeling—Part I: Methodology. J. Air Waste Manage. Assoc. 49(11):1324–31. doi:10.1080/10473289.1999.10463960
- Hanrahan, P.L. 1999b. The plume volume molar ratio method for determining NO2/NOx ratios in modeling—Part II: Evaluation studies. J. Air Waste Manage. Assoc. 49(11):1332–8. doi:10.1080/10473289.1999.10463961
- Hendrick, E.M, V.R. Tino, S.R. Hanna, and B.A. Egan. 2013. Evaluation of NO2 predictions by the plume volume molar ratio method (PVMRM) and ozone limiting method (OLM) in AERMOD using new field observations. J. Air Waste Manage. Assoc. 63(7):844–54. doi:10.1080/10962247.2013.798599
- ISR: NO2/NOx in-stack ratio database. 2016. http://www.epa.gov/ttn/scram/no2_isr_database.htm (accessed March 1, 2017).
- MACTEC. 2005. Evaluation of Bias in AERMOD-PVMRM. Alaska DEC Contract No. 18-9010-12. https://www3.epa.gov/ttn/scram/7thconf/aermod/pvmrm_bias_eval.pdf (accessed March 1, 2017).
- Podrez, M. 2015. An update to the ambient ratio method for 1-h NO2 air quality standards dispersion modelling, J. Atmos. Environ. 103:163–70. doi:10.1016/j.atmosenv.2014.12.021
- Smith, S.E., J.R. Stocker, M.D. Seaton, and D.J. Carruthers. 2016. A validation study of the ADMS plume chemistry schemes. Proceedings of the 17th International Conference on Harmonisation, Budapest, Hungary, May 9–12.
- Thomson, D.J. 1990. A stochastic model for the motion of particle pairs in isotropic high Reynolds number turbulence, and its application to the problem of concentration variance. J. Fluid Mech. 210:113–53. doi:10.1017/S0022112090001239
- U.S. Environmental Protection Agency. 2011. Additional clarification regarding application of Appendix W Modeling Guidance for the 1-hour NO2 National Ambient Air Quality Standard. Attachment A—Summary of AERMOD model performance for 1-hour NO2 concentrations. https://www3.epa.gov/scram001/guidance/clarification/Additional_Clarifications_AppendixW_Hourly-NO2-NAAQS_FINAL_03-01-2011.pdf (accessed March 1, 2017).
- U.S. Environmental Protection Agency. 2015a. Revision to the guideline on air quality models: Enhancements to the AERMOD Dispersion modeling system and incorporation of approaches to address ozone and fine particulate matter. 40 CFR Part 51, RIN 2060-AS54. https://www.federalregister.gov/documents/2015/07/29/2015-18075/revision-to-the-guideline-on-air-quality-models-enhancements-to-the-aermod-dispersion-modeling (accessed March 1, 2017).
- U.S. Environmental Protection Agency. 2015b. Addendum to AERMOD Model Formulation Document. Presented at the U.S. EPA’s 11th Conference on Air Quality Modeling, Research Triangle Park, NC, August 12–13. https://www3.epa.gov/ttn/scram/7thconf/aermod/Addendum_to_MFD_v15181.pdf (accessed March 1, 2017).
- Venkatram A., P. Karamchandani, P. Pai, and R. Goldstein. 1994 The development and application of a simplified ozone modelling system (SOMS). Atmos. Environ. 28(22): 3365–78.
- Willmott, C.J., S.M. Robeson, and K. Matsuura. 2011. A refined index of model performance. Int. J. Climatol. 32(13):2088–94. doi:10.1002/joc.2419