
ABSTRACT
Black carbon (BC) or elemental carbon (EC) is a by-product of incomplete fuel combustion, and contributes adversely to human health, visibility, and climate impacts. Previous studies have examined nondestructive techniques for particle light attenuation measurements on Teflon® filters to estimate BC. The incorporation of an inline Magee Scientific OT21 transmissometer into the MTL AH-225 robotic weighing system provides the opportunity to perform optical transmission measurements on Teflon filters at the same time as the gravimetric mass measurement. In this study, we characterize the performance of the inline OT21, and apply it to determine the mass absorption cross-section (MAC) of PM2.5 BC across the United States. We analyzed 5393 archived Teflon® filters from the Chemical Speciation Network (CSN) collected during 2010–2011 and determined MAC by comparing light attenuation on Teflon® filters to corresponding thermal EC on quartz-fiber filters. Results demonstrated the importance of the initial transmission (I0) value used in light attenuation calculations. While light transmission varied greatly within filter lots, the average I0 of filter blanks during the sampling period provided an estimate for archived filters. For newly collected samples, it is recommended that filter-specific I0 measurements be made (i.e., same filter before sample collection). The estimated MAC ranged from 6.9 to 9.4 m2/g and varied by region and season across the United States, indicating that using a default value may lead to under- or overestimated BC concentrations. An analysis of the chemical composition of these samples indicated good correlation with EC for samples with higher EC content as a fraction of total PM2.5 mass, while the presence of light-scattering species such as crustal elements impacted the correlation affecting the MAC estimate. Overall, the method is demonstrated to be a quick, cost-effective approach to estimate BC from archived and newly sampled Teflon® filters by combining both gravimetric and BC measurements.
Implications: Robotic optical analysis is a valid, cost-effective means to obtain a vast amount of BC data from archived and current routine filters. A tailored mass absorption cross-section by region and season is necessary for a more representative estimate of BC. Initial light transmission measurements play an important role due to the variability in blank filter transmission. Combining gravimetric mass and BC analysis on a single Teflon® filter reduces costs for monitoring agencies and maximizes data collection.
Introduction
Black carbon (BC), a by-product of incomplete combustion, impacts visibility (Watson, Citation2002) and climate (Bond et al., Citation2013; Ramanathan and Carmichael, Citation2008). Emissions from combustion sources containing BC are increasingly being linked with adverse human health effects, including lung cancer, cardiovascular diseases, mortality, and morbidity (Cassee et al., Citation2013; Grahame et al., Citation2014; Pope and Dockery, Citation2006; Rohr and Wyzga, Citation2012), although linking specific components of particulate matter (PM) to short- and long-term health effects is still an area of ongoing research (Grahame et al., Citation2014; Rohr and Wyzga, Citation2012; Wyzga and Rohr, Citation2015).
BC is commonly used to refer to the strongly light-absorbing carbon (Bond and Bergstrom, Citation2006; Chow et al., Citation2009) that is typically quantified through optical measurement techniques (Chow et al., Citation2009), whereas elemental carbon (EC) typically refers to thermally refractory carbon that is operationally defined and determined by thermal–optical methods (Birch and Cary, Citation1996; Chow et al., Citation2007; Chow et al., Citation1993; Peterson et al., Citation2002; Watson et al., Citation2005). National air quality monitoring networks in the United States (e.g., the Environmental Protection Agency [EPA] Chemical Speciation Network [CSN] and the National Park Service [NPS] Interagency Monitoring for Protected Visual Environments [IMPROVE]) use filter-based sampling and analysis methodologies to quantify PM2.5 (PM less than 2.5 µm in aerodynamic diameter) mass and composition. In the CSN (~145 locations) and IMPROVE networks (~156 locations) (Solomon et al., Citation2014), ambient samples are collected on Teflon® filter media (henceforth listed as Teflon in this article) for mass and elemental analysis, nylon filter media for ion analysis, and quartz-fiber filter media for organic carbon (OC) and EC analysis. The EPA Federal Reference Method (FRM) network (~900 locations), established to determine regulatory compliance, measures PM2.5 mass on Teflon filters.
Previous studies have demonstrated good correlation between EC (measured on quartz filters) and particle light attenuation (batt) measured on Teflon filters (Chow et al., Citation2010; Frank et al., Citation2010; White et al., Citation2016), suggesting the potential utility of batt measurements as a quick and efficient way to obtain a measure of EC without the need for a quartz filter. Chow et al. (Citation2010) compared batt measurements of filter samples obtained from special studies and from the IMPROVE network against EC on quartz filters. Measurements of batt in that study were performed using techniques such as the laser integrating plate method (LIPM) (Cahill et al., Citation1984; Horvath, Citation1997), the hybrid integrating plate/sphere (HIPS) (Campbell et al., Citation1995) (both at wavelength [λ] = 633 nm), and the densitometer integrating plate method (DIPM; λ= ~550 nm) (Chow et al., Citation2010). They found good correlations (r2 > 0.75) and mass absorption cross-sections (MAC) ranging from 8.8 to 12.5 m2/g that exhibited more spatial variation than seasonal variation. We follow the recommendation by Bond and Bergstrom (Citation2006) and refer to the absorption per unit mass factor as MAC. Frank et al. (Citation2010) investigated the applicability of the Magee Scientific (www.mageescientific.com) SootScan model OT21 transmissometer at 7 sites in the eastern and western United States and found MAC of around 10–11 m2/g (λ = 880 nm). White et al. (Citation2016) presented a calibration approach that they had developed for the HIPS. They report MAC ranging from ~6 to ~18 m2/g (λ = 633 nm) across the IMPROVE sites with a seasonal trend, with its variability potentially linked to influence from dust concentrations.
Being able to estimate BC from Teflon filters thus enhances the ability to expand the spatial scale of estimated EC measurements at a lower cost than thermal OC/EC analysis, if, for example, it is performed routinely on these network filters. The ability to automate such measurements on Teflon filters using a robotic weighing system (RWS) (Presler-Jur et al., Citation2016) while also measuring gravimetric mass provides exceptional value by generating concurrent BC data at reduced human labor effort relative to multiple manual measurements. Further, the ability to analyze archived filters enables expanding the temporal extent of estimated EC data. This study examines the feasibility of such a system for large-scale measurements and investigated BC analysis on Teflon filters in order to evaluate a fast, nondestructive analytical technique. The incorporation of an inline OT21 transmissometer into an MTL AH-225 automated RWS provides the opportunity to easily evaluate optical transmission readings on Teflon filters while maintaining a high sample throughput. We build upon the earlier work and perform a large-scale evaluation of batt measurements on archived Teflon filters using the OT21 instrument.
The OT21 instrument has been used previously to measure BC on Whatman 41 filters (Ahmed et al., Citation2009), quartz-fiber filters (Forder, Citation2014; Pohl et al., Citation2014), and Teflon filters (Kamboures et al., Citation2013). Using an assumed MAC of 16.6 m2/g, Ahmed et al. (Citation2009) calculated BC from their batt measurements of ambient air and found good correlations and slopes of near unity when regressed against EC by the National Institute for Occupational Safety and Health (NIOSH) method (Birch and Cary, Citation1996). They also found that the agreement varied by site, potentially due to differences in chemical composition, and therefore recommended site-specific calibration of the OT21. Forder (Citation2014) compared OT21 batt to EC measured by a European method and found excellent agreement for a large range in EC loadings of mine air (up to 300 µg/filter). Pohl et al. (Citation2014) used the OT21 in their BC measurements (with an assumed MAC of 16.6 m2/g) of the marine boundary layer. Kamboures et al. (Citation2013) measured BC emissions from gasoline vehicles using multiple instruments including an OT21. Comparison of EC by the IMPROVE_A thermal optical reflectance (TOR) protocol (Chow et al., Citation2007) to OT21 BC (estimated using an assumed MAC of 16 m2/g) showed fair to good correlation (r2 = 0.37 to 0.85), although the data were very limited. Most of these studies used an assumed value of MAC. Frank et al. (Citation2010) presented an initial evaluation of the OT21 on Teflon filters with a specific goal of using this methodology for estimating BC. We expand upon this initial work (Frank et al., Citation2010) and focus specifically on documenting the performance of the OT21 instrument for estimating BC and evaluating MAC by region and season. The specific objectives of this study include (a) a detailed evaluation of the applicability and the performance of the OT21 in estimating BC concentrations, with a specific interest for use in archived filters; and (b) estimating regional and seasonal MAC and the impact of the chemical composition. Specifically, this paper focuses on establishing the performance of the RWS inline OT21 in achieving those objectives.
Experimental methods
Particle light absorption measurements
Particle light absorption is determined by measuring the amount of light attenuated when passed through a sampled filter. Measurements of batt were performed using a Magee Scientific SootScan model OT21 transmissometer (Magee Scientific Corporation, Berkeley, CA). The OT21 system used in this study is a modified version that is incorporated into an MTL Corporation AH-225 Precision Weighing System (Minneapolis, MN), an RWS that is designed to provide automated, accurate, gravimetric mass measurements on a large scale (Presler-Jur et al., Citation2016). This inline version of the OT21 system is hereafter referred to as the Robotic OT21 to distinguish it from the benchtop Magee Scientific SootScan model OT21 transmissometer (Benchtop OT21). The RWS filter weighing system software (Version 3.0.5) also controls the entire BC analysis process with the inline Robotic OT21. The RWS is linked to a computer database that records data collected by the robotic system, including light transmission values from the Robotic OT21. The Benchtop OT21 is connected to a laboratory computer to transmit the transmission values electronically using the Magee Scientific software Transmissometer version 1.0.6.0. The SootScan model OT21 transmissometer technology is the same for both the Robotic and Benchtop models. This BC analysis technique is nondestructive.
Both OT21s are located in a climate-controlled walk-in environmental chamber in the RTI International Gravimetry Laboratory that is tightly controlled for temperature and relative humidity to meet federal requirements for gravimetric analysis. More information about the RWS and the environmental chamber can be found in Presler-Jur et al. (Citation2016).
The SootScan OT21 transmissometer measures the intensity of light transmitted through a blank filter (I0) and a sampled filter (I) at two wavelengths (880 nm in the infrared (IR) spectrum and 370 nm in the ultraviolet (UV) range). Assuming that the light attenuation through a filter follows the Beer–Lambert law,
where L is the optical path length, obtained from the volume of the air sampled (m3) and the sampled area (m2) on the filter, one can calculate batt in units of inverse megameters (Mm−1) at a specific wavelength as follows:
The light attenuation is typically expressed in “ATN units” at a specific wavelength as seen in eq 3. This calculation allowed for the comparison of the Benchtop OT21 to the Robotic OT21:
BC, compared to other aerosol species, absorbs light strongly at the 880 nm wavelength; however, as we move into the UV spectrum (370 nm measurement in the OT21), BC and other forms of carbon, including organic species, absorb light (Andreae and Gelencser, Citation2006; Kirchstetter et al., Citation2004). For the purpose of this study, the UV data are mainly used from a quality assurance perspective. The BC concentration (µg/m3) is therefore calculated using batt at 880 nm and the MAC, σatt[λ] (m2/g), as shown in eq 4. The MAC is represented by the slope of the linear regression of EC by thermal analysis against batt at 880 nm. The BC concentration is therefore dependent on the value of the MAC, which means that a more representative MAC is needed for a reliable BC estimate as detailed later in the development of region-and season-specific MAC.
To perform optical transmission analysis on a Teflon filter with the OT21, the light intensity needs to be reduced with a diffusing filter as per manufacturer recommendations. In the RWS, the Robotic OT21 has been modified to include a GP47 permanent backing filter to allow for automated analysis of multiple Teflon filters that are preloaded into filter carriers. This is necessary as this backing material cannot be included with the filter in the RWS carrier (see supplemental material, Figure S1). The GP47 material is a Teflon-coated glass substrate that provides the necessary light diffusion through the Teflon filter media (Magee Scientific, Citation2016). The figures in the supplemental material also demonstrate another important difference between the Robotic and Benchtop OT21 instruments. In the Benchtop OT21, the diffusing filter is a removable T60 Teflon-coated borosilicate glass fiber medium that is loaded into the Benchtop OT21 cassette (a cassette is the carrier that holds the filter; see supplemental material, Figure S2). The cassettes of the Benchtop OT21 are made such that the instrument is always analyzing 15 mm of the sample surface regardless of the size of the filter media, whereas the RWS carriers are low profile to only hold the filter ring. This allows the Robotic OT21 to analyze a larger surface area than 15 mm (supplemental material, Figure S2). An additional difference is that the Robotic OT21 measurement cavity had to be shortened to half the size of the Benchtop OT21, which allows the robotic arm to place the filter in the correct location for analysis. The RWS software communicates with the Robotic OT21 on the position setting, which allows the OT21 to know whether the filter inside the cavity is a blank or sampled filter. This is a difference from the Benchtop OT21 measurements in which two separate positions (Magee Scientific, Citation2016)—one for the blank and the other for the sampled filter—are present, and the analyst places the filter tray into the relevant position.
Per manufacturer recommendations (Magee Scientific, Citation2016), neutral density filter (NDF) disks are made from standard photometric materials and can be used to check the analyzer response. When analyzed by an OT21 transmissometer, the NDFs have a reproducible absorbance, which allows for quality control tracking of the OT21 performance. For the Benchtop/Robotic OT21 comparison study, neutral density filters (NDFs) were procured from Edmund Optics (Barrington, NJ) with ND nominal optical densities of 0.15, 0.3, 0.4, 0.5, and 0.6 to analyze a wide range of IR and UV attenuation values. To fit the 47-mm filter carriers, the standard diameter NDF size of 50-mm was ground down to 47 mm by Prism Research Glass (Raleigh, NC). These NDFs were then certified by Magee Scientific by verifying against their reference NDF set.
Filter media
All filter analyses for the Benchtop/Robotic OT21 comparison study and evaluation of the Robotic OT21 were completed using Whatman (GE Health Care, Pittsburgh, PA) and MTL (MTL Corporation, Minneapolis, MN) Teflon 47-mm filters. Since these filters were part of the routine CSN/FRM measurement network and were subject to gravimetric analysis, the filters were evaluated prior to use to meet the EPA FRM specifications and conditioned for ambient air PM gravimetric analysis (EPA, Citation1998, Citation2012a, Citation2012b, Citation2012c, Citation2013a, Citation2013b). Further, since these were previously sampled archived filters that did not have initial transmittance values, I0, of the unsampled filter, laboratory blank filters were used to estimate I0. Given the variation in the Teflon filter media surface, a collection of nearly 150 blank Teflon filters was pulled from our laboratory archives to provide an average blank transmission value for I0 for each filter lot and across all the blank filters available. The majority of the sampled filters that were analyzed in this study had been collected as part of the CSN, with a smaller subset of filters collected for the State and Local Air Monitoring Stations (SLAMS) Network. However, estimation of the MAC and BC was performed using just the CSN Whatman Teflon 47-mm filters.
EC and other particle chemical speciation data
All particle chemical speciation data used in this study were obtained from RTI’s CSN database that consists of quality-assured chemical speciation data posted by RTI to the EPA Air Quality System (AQS). This study utilized archived Teflon filters collected during 2010–2011 as part of the CSN with corresponding valid quartz EC measurements by the IMPROVE_A method to do a full characterization of the MAC. The Teflon filters were archived in a walk-in cooler maintained at 4°C. An evaluation of this size would provide data necessary to have a clear picture of how the MAC could change by region or season. Quartz filters were analyzed by Desert Research Institute (Reno, NV) for OC/EC by the IMPROVE_A thermal optical reflectance (TOR)/transmittance (TOT) carbon analysis protocol (Chow et al., Citation2007). Teflon filters were analyzed for mass by gravimetry and 33 elements by energy-dispersive x-ray fluorescence (EDXRF) (Gutknecht et al., Citation2010), and nylon filters were analyzed for ions including sulfate, nitrate, ammonium, sodium, and potassium by ion chromatography, both performed at RTI International (Research Triangle Park, NC) (Flanagan et al., Citation2006; Solomon et al., Citation2014). The OC/EC data and the remaining chemical composition data were linked to respective sampling events within RTI’s CSN database, to allow for an evaluation of the impact of composition on the estimated MAC values.
Project analysis techniques
Before embarking upon a large-scale evaluation of the absorption measurements using the Robotic OT21, RWS performance was first evaluated through a full-scale analysis of the robotic filter weighing capability. The arm movements were closely monitored using the weighing results. Our results showed that the RWS showed a high degree of precision and accuracy with no significant drift and with negligible effect of static electricity, and imparted no contamination onto the filters (Presler-Jur et al., Citation2016).
Next, the Robotic OT21 was verified against a Benchtop OT21 to ensure that minor differences in the configuration described in the preceding sections did not hinder its performance. First, the impact of the differences in the backing material on light transmission was evaluated. Next, the filter light transmission measurements made on the two instruments were compared. For the Robotic OT21 measurements the “BC procedure,” a setting in the system software, was used. In this procedure, the robotic arm retrieves the filter in the transport carrier from the balance (or from a holding silo) and places the filter in the transport carrier into the Robotic OT21 (see supplemental material, Figure S1). When the robotic arm is fully inside the Robotic OT21 cavity, the cavity is completely closed to outside light. Teflon filters that had been previously analyzed on the Benchtop OT21 were analyzed on the Robotic OT21. In addition, filters that were in use in the RTI Gravimetry Laboratory at the time of this study were analyzed on both the Robotic and Benchtop systems. This validation of Robotic OT21 against the Benchtop OT21 was repeated throughout this study with filters from 2010 and 2014–2016 to continually verify the performance and consistency of the Robotic OT21.
About 200–800 sampled filters per EPA Region () covering all four seasons were analyzed on the Robotic OT21 to encompass a wide range of BC concentrations. BC concentration (µg/m3) was calculated as per eqs 2–4. A linear regression of the EC and batt at 880 nm was used to empirically derive the MAC, σatt[λ] (m2/g), represented by the slope. The slopes (MAC) and correlation values of the least-squares regression analysis were compared to evaluate how the MAC varied by Teflon filter lot, mass concentration, EPA Region, and season. In our discussion, we use the square of the correlation coefficient (i.e., coefficient of determination, r2). During this analysis, it was determined that further investigation into how I0 affected the MAC and correlation was warranted. Therefore, the MAC empirical derivation was also completed with both an average within each filter lot and an average using all blank filters analyzed during the study.
Table 1. List of sites within each EPA Region chosen for analysis in the tailored MAC study.
Results and discussion
Comparison of manual and robotic optical absorption
To evaluate the Robotic OT21’s use of the GP47 diffusion medium, raw GP47 material was acquired from MTL Corporation and analyzed against the T60 diffusion paper with the NDFs. This was performed on both the Robotic and the Benchtop OT21s using the certified NDFs, which showed no difference between the two backing materials for the ATN. In addition, the GP47 permanent backing diffusion filter was analyzed and evaluated to confirm that there was no light absorption of that material. This procedure developed during the study was meant to mimic the recommended routine check to analyze the backing filter media in both Position 1 and Position 2 of the Benchtop OT21. To do this in the Robotic OT21, an empty carrier was used to seal the back of the Robotic OT21 for both the blank analysis and the sample analysis. Results showed that there was no interference of the GP47 permanent backing filter and no difference between the two backing media for the 47-mm filter analysis. A comparison of the NDF ATN of the Robotic OT21 to the certified values also illustrated proper lamp performance and provided a method to track the long term performance of the OT21 as recommended by the manufacturer.
Direct comparisons of filter analysis between both OT21s consistently showed good agreement between the Benchtop OT21 and Robotic OT21 for sampled filters. highlights the initial large scale comparison performed in 2014 for filters sampled in 2007 that had been previously analyzed in 2010 on the Benchtop OT21 as part of another study. Light attenuation measurements by the Robotic OT21 were highly correlated (r2 >0.96) with near unity slope (0.98 at 880 nm). A small subset of these filters, selected at random from the original collection of filters, was then repeated in 2016 on the Robotic OT21 toward the completion of this study to track drifts. Results showed excellent consistent performance (slope = 0.99 and r2 ~1), as shown in .
Figure 1. Comparison of Robotic OT21 and Benchtop OT21 IR and UV attenuation for filters previously analyzed on the Benchtop in 2010 and analyzed (a) in 2014 on the Robotic OT21 and (b) as recheck on the Robotic OT21 of a subsample (39) of these filters in 2016.
By analyzing the entire filter sample surface area, the Robotic OT21 will see all the variability, discolorations, and variation in both the unsampled Teflon material and the sample surface. The variability across an unsampled Teflon surface is highlighted in the supplemental material, Figure S3, using scanning electron microscopy (SEM) at increasing magnification that illustrates the potential for light transmission to vary across the uneven blank filter surface. shows how this larger analysis area will affect the correlation of the two instruments by comparing the raw transmission values of unsampled and sampled filters analyzed by both Benchtop OT21 and the Robotic OT21. This investigation was performed with both Teflon media types analyzed, MTL () and Whatman (). For both media types, the exposed filters show slightly better agreement than the unsampled filters, partly due to the masking of the variations on the filter surface by the particle sample deposit. For the MTL filters (), the analysis shows that while there are differences in the raw transmission values between the Robotic OT21 and Benchtop OT21, the agreement in the raw IR transmission at 880 nm is good. We believe that this difference in the magnitude of the transmission readings originates from differences in the filter area that is analyzed with the Robotic O21 (see supplemental material, Figure S2). However, when converted to batt and ultimately to BC concentration (for this illustration using a typical MAC of 10 m2/g [Chow et al., Citation2010; Frank et al., Citation2010]), the BC concentrations show very good correlation (r2 = 0.94) with a slope of 0.92 and negligible intercept 0.16 (see supplemental material, Figure S4).
Figure 2. Comparison of Robotic OT21 and Benchtop OT21 analysis for unsampled and sampled filters illustrating the correlation for (a) raw transmission for MTL brand filters and (b) raw transmission for Whatman brand filters.
also illustrates a difference in the Robotic OT21 analysis of Whatman filters over MTL filters. As seen in , for the Whatman filters, the agreement between the Benchtop and Robotic OT21s appears to vary, as demonstrated by the lower correlations. There is also a larger variation in raw blank IR transmission at 880 nm observed with the Whatman filters. The support ring on Whatman filters is made with polymethylpentene (PMP), while the MTL support filter ring is polytetrafluoroethylene (PTFE) with polyfluoroalkoxy (PFA), which creates a more rigid copolymer, preventing the curve that is commonly found with Whatman filters and is known as the “Pringle” effect (EPA, Citation2011). Understanding the importance of a flat filter is necessary, as the Benchtop OT21 cassette cover holds the filter flat, while the Robotic carrier only holds the filter at the edges, allowing the filter to sit without being pressed flat. The agreement seen between the Robotic and Benchtop OT21s in was likely due to a combination of the large number of sampled filters analyzed and the exposed Whatman filters being considerably flatter if not completely flat after being pressed into a sampling cassette. The light attenuation calculation uses the transmission through a blank/unexposed Teflon filter for I0 (eq 2), making the unexposed filter used a critical component of the analysis to ultimately calculate the BC. This variation in the blank filter transmission value could impact the I0 result for filters that are not laying as flat as possible in the robotic carriers.
Robotic light attenuation calculation
reveals that the transmission value of the unexposed filter (I0) can vary with individual Teflon filters, which is an important value in the calculation of BC from light attenuation measurements (eq 2). To further analyze the impact of this effect on estimation of BC in archived filters, nearly 150 blanks spanning the same time period of the sampled filters used in this study were analyzed. The initial transmission value I0 was calculated two ways. First, an average of all of these blanks was used and referred to as the “All Average I0” transmission value. Second, blanks for specific lots of filters sampled in 2010 and 2011 with more than three blank filters available were averaged to see how the raw transmission value would vary, which was referred to as the “Lot-Specific I0.” shows how the transmission values within the lots and individual filters within the lots are affected by the differences in filter characteristics. It also illustrates that individual IR transmission values within a lot can vary considerably affecting the Lot-Specific I0.
Figure 3. Raw transmission of blank filters analyzed for this study where individual lots are grouped and averaged. The count (n) is that of blank filters from the respective individual lot. The All Average Blank is that of every blank filter from the time frame of the archived filter analysis.
This variability in the blank I0 value in the Robotic OT21 could be an issue for lightly loaded filters and may bias the estimate of the BC on the filter if the blank Teflon filter surface transmitted less light than a sampled filter, as this would cause the I0 transmission value to be lower for the blank filter than the transmission value (I) for the sampled filter. As seen in , the raw IR transmitted intensity can vary by as much as 60,000 units between individual filters, about 35,000 units between extreme lot-specific averages, and about 26,000 units between the extreme lot and the All Average I0.
Given the variation in I0, we explored whether I0 was a function of the nominal filter weight of the Teflon filter that would help develop a relationship to estimate I0 for archived filters (since tare—i.e., unsampled filter—weight is available for all filters). shows the distribution of IR raw transmission as a function of nominal filter weight for the MTL filters in use during the time of this study and used in the Benchtop OT21 comparison (). In this figure, the diamonds are the unsampled MTL filters. The data illustrate a variable range in raw IR transmission values at 880 nm with no clear trend of I0 as a function of filter weight.
Figure 4. Raw IR transmission values at 880 nm as a function nominal filter weight for unsampled and exposed MTL filters in use at the time of this study.
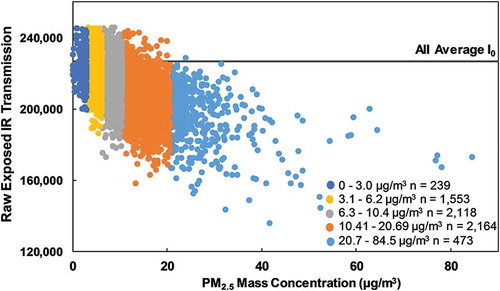
shows the raw IR transmission value at 880 nm for exposed filters having an overall decreasing value with increasing PM2.5 mass concentration, which is expected as with higher levels of PM2.5 the light absorption should increase. Also shown in the figure is the All Average I0. This figure clearly illustrates the importance of the I0 value used in the batt calculation. Overall, about 14% of the samples are impacted, as using the All Average I0 value (~226,000) will have negative batt for filter samples with a transmission reading (I) above 226,000 (All Average I0). This is observed with PM2.5 mass concentrations up to 20 μg/m3 (except at a few points between 20 and 30 μg/m3), and thus these samples cannot be used in BC calculations. PM2.5 mass concentration ranges used for further analysis in this study are illustrated in the figure with varying color. As shown in , this impact is larger for lightly loaded samples (~37% of samples for mass loading <3 µg/m3, ~ 27% of samples in 3–6 µg/m3, and <14% of samples in 6 to 10 µg/m3).
Figure 5. Raw IR transmission reading at 880 nm for exposed filters as a function of PM2.5 mass concentration (μg/m3).
I0 blank transmission of archived filters
In total, 5393 sampled filters from 2010 and 2011 were analyzed to determine batt and to study the effect of I0 value on the derivation of the MAC. Using both the All Average I0 and the Lot-Specific I0, batt was estimated and regressed against EC to determine MAC. The MAC across the filter lots ranged from 6.6 to 10.5 m2/g. In addition, the correlation (r2) of batt with EC varied from 0.3 to 0.9 (supplemental material, Table ST1). shows the difference in the scatter for two example lots (with the lowest and highest correlation) summarized in Table ST1. The scatter is higher for Lot 2010-5, which had the lowest correlation of all the lots. Evident in Table ST-1 and is that differences in the Lot-Specific I0 versus All Average I0 only affect the y-intercept since in eq 2, I0 is the only value that is different. Therefore, the value of I0 does not impact the derivation of the MAC. Regardless, it is important in the estimation of a representative BC value.
Figure 6. Investigation of a lot-specific derivation of MAC for lots 2010-5 and 2011-5 illustrating differences between using (a) Lot-Specific I0 and (b) All Average I0.
Alternatively, one could evaluate the impact of the Lot-Specific I0 on BC estimation, by using a MAC value of 10 m2/g found in the literature (Chow et al., Citation2010; Frank et al., Citation2010). shows a specific lot (lot number 2011-4) for which the correlation of the estimated BC with EC TOR was fair at 0.5 with a large degree of scatter. On the other hand, demonstrates that for another lot (lot 2011-5) there was a high degree of correlation (r2 = 0.9). In addition to the correlation being low in , this also shows that the Lot-Specific I0 has a greater number of negative BC concentrations, which is caused by the Lot-Specific I0 value being lower than the majority of the PM exposed samples for this lot. Therefore, all of this points to the large variation in I0 and its importance in estimating BC concentrations. Therefore, for purposes of deriving region-specific and season-specific MAC, the All Average I0 appears to be a good initial estimate with a lower impact on the number of negative batt values. Also, the correlation does not differ whether we use a Lot-Specific I0 or All Lot Average I0. While this information is apparent from Table ST1, the figure provides a visual demonstration of the impact on BC estimation.
Figure 7. Correlation of the calculation of BC using an estimated MAC of 10 m2/g to the EC TOR by IMPROVE_A for the (a) 2011-4 and (b) 2011-5 Lot-Specific I0.
Tailored mass absorption cross-section (MAC)
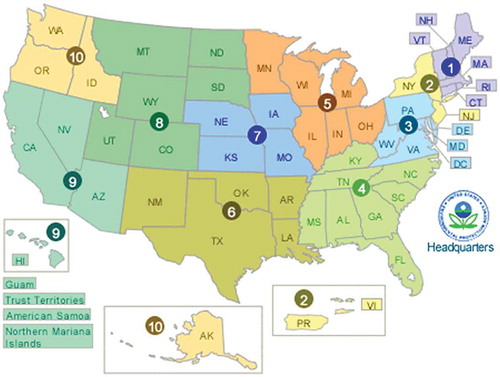
A comprehensive characterization of the MAC by region and season was performed. Early results from this study illustrated the need for a large number of archived filters to investigate changes in the MAC. For example, the supplemental material Table ST2 highlights preliminary analysis of filters sampled in 2014 that showed seasonal variability in the correlation and the slope. These early results illustrated the need for expanded work in examining regional and seasonal differences and potential causes for variability in the correlation. This also demonstrates the potential need for a tailored MAC by region and season. This analysis grouped sites by EPA Regions () and included specific sites within each region as summarized in for a total of 5393 filters sampled in 2010–2011. The All Average I0 was used in the batt calculation.
Figure 8. Image of the 10 EPA Regions as found on https://www.epa.gov/aboutepa/visiting-regional-office.
shows the regional variation of batt as a function of EC TOR by the IMPROVE_A method with derived MAC values ranging from 6.9 to 9.4 m2/g. The data were further parsed by season within each region. The results are summarized in . Supplemental material Table ST3 presents the detailed list of MAC values, y-intercepts, and r2 for each EPA Region.
Table 2. MAC derivation for the 10 EPA Regions.
Figure 9. Seasonal variation of the (bars) MAC and (circles) correlation across all 10 EPA Regions.
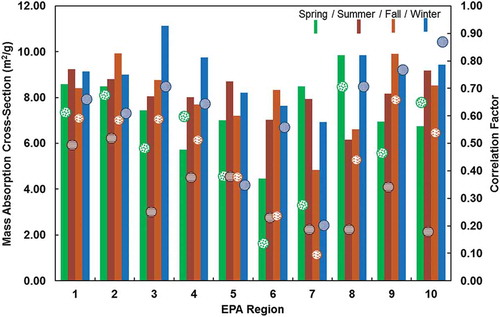
The regional analysis showed poor to reasonable correlations (r2 = 0.17 to 0.76) and MAC (slope) ranging from 6.9 to 9.4 m2/g. Region 7 showed the lowest correlation (r2 = 0.17), while Region 10 had the highest correlation (r2 = 0.76). As seen in the supplemental material Figure S5, there is significant scatter in the data for Region 7, with low EC loadings (typically less than 0.5 to 1 µg/m3, except for a few data points). As seen in , the low correlation was persistent across all seasons, with spring showing a slightly better correlation of 0.28. It is possible that the EC values had higher uncertainty due to low loadings. In contrast, Region 10 had an overall higher correlation and exhibited stronger correlation (r2 = 0.87) in winter, when BC concentrations in Region 10 are higher (as seen in the EC concentrations in the supplemental material in Figure S5) due to possible wood burning or oil combustion for winter heating. The low correlation for the summer season in Region 10 is most likely due to lower EC concentrations and relatively lower mass loading (~6 µg/m3) that may add additional uncertainties into both EC and batt measurements. For Region 10, the MAC ranged from 6.8 to 9.4 m2/g in the spring and winter. Taking the example of Region 10, the MAC in spring is about 27% lower than that in winter, implying that the BC would be lower by a similar magnitude. This also implies that using a default value of 10 m2/g may overestimate the BC concentrations in spring by ~47%, demonstrating the need for a seasonal MAC.
Table 3. Derived slope (MAC), y-intercept, and correlation for the seasonal variation in the relationship of light attenuation as a function of EC by IMPROVE_A TOR (μg/m3) for Region 7 and Region 10.
The seasonal analysis () shows that, overall, the summer and fall seasons have lower correlations than winter and spring seasons for the majority of the EPA Regions. In addition, the MAC values range from 4 to 11 m2/g with no apparent relationship to how well batt correlates with EC TOR by IMPROVE_A.
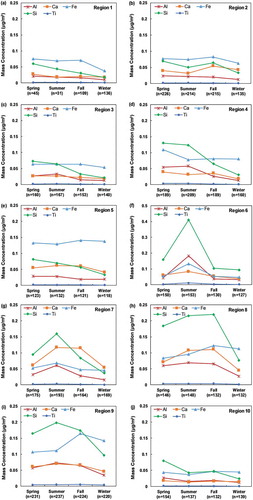
To understand the potential reasons for the varied correlation, presents the average chemical composition for Summer and Winter seasons for selected regions covering the eastern (Region 3), central (Region 7), and western United States (Region 10) to aid in the discussion. All three regions show low correlation (r2 = 0.18–0.25) for the summer season. During winter, Region 7 still showed low correlation (r2 = 0.20), while Region 3 (r2 = 0.71) and Region 10 (r2 = 0.87) showed good to excellent correlations. The data shows some interesting patterns that may help explain the observed correlations. The average EC concentration in Region 10 was about 10% of the total PM2.5 mass, while that in summer was around 6% of the mass. EC was only 3 to 4% of the mass in Region 7 during both summer and winter seasons, and in Region 3 during summer, while being about 6% in winter. The high correlation appears to be related to the relative percent of EC in mass. Inorganic ions (sulfate, ammonium, and nitrate) with light-scattering properties comprised about 39 to 52% of the mass in Region 3, 31 to 62% in Region 7, and 20 to 25% in Region 10. Fuller et al. (Citation1999) noted that the mixing state of carbon plays a role in the MAC. shows the average concentrations of certain elements used to calculate the fine soil component in the IMPROVE network. These elements show a higher occurrence during spring through fall seasons and are lowest in winter. It is interesting to observe that the magnitude of these elemental concentrations increases as we move into the central and western United States (Regions 6 through 9), and is lowest for Regions 1, 2, and 10, consistent with areas where we would expect wind-blown dust events (Hand et al., Citation2016). Extremely low seasonal correlation in EPA Regions located in the central United States (Regions 6, 7, and 8) appears to be also related to a higher dust component in the spring, summer, and fall seasons evident in . The larger fraction of non-EC components combined with the low EC concentration likely contributed to the low correlation for nonwinter seasons in the eastern and western United States, as well as throughout the year in the central part of the United States. The lower correlations also introduce uncertainties into the MAC estimation and its reliability in BC estimation in particular regions and seasons. For example, Region 7 showed r2 < 0.2 in summer through winter. It may be useful to use an MAC from a nearby region rather than those estimated for this region specifically.
Figure 10. Average PM2.5 chemical compositions in EPA Regions 3, 7, and 10 during summer and winter seasons as measured by the CSN. The remaining species was calculated by subtracting the sum of the species indicated from the total PM2.5 mass concentration. Note that this category will include the multiplier for OC, soil components, and any undetermined species.
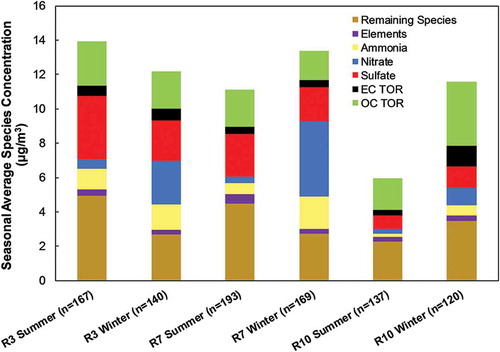
Figure 11. Seasonal evaluation of the fine soil fraction using aluminum (Al), calcium (Ca), iron (Fe), silicon (Si), and titanium (Ti) analyzed by XRF for (a) Region 1, (b) Region 2, (c) Region 3, (d) Region 4, (e) Region 5, (f) Region 6, (g) Region 7, (h) Region 8, (i) Region 9, and (j) Region 10. Note that the y-axis scales are same for all regions, except Region 6.
In general, the MAC (at 880 nm) mostly ranged between 7 and 10 m2/g in this study. Assuming that the MAC varies inversely with wavelength, this is equivalent to ~11 to 16 m2/g at 550 nm, the wavelength at which values have been previously reviewed (Bond and Bergstrom, Citation2006). This is similar to the range of values reported in literature (Bond and Bergstrom, Citation2006; Chou et al., Citation2005; Chow et al., Citation2010; White et al., Citation2016). Bond and Bergstrom (Citation2006) recommended an MAC of 7.5 m2/g for fresh uncoated BC. Fuller et al. (Citation1999) also suggested a similar value for fresh particles, but noted that aged particles and the mixing state may enhance the MAC to as much as 10 m2/g. It has been shown that filter-based light absorption measurements are subject to artifacts due to absorption enhancement by the filter material and due to multiple scattering effects within the aerosol deposit (Bond et al., Citation1999; Bond and Bergstrom, Citation2006; Chow et al., Citation2009; Virkkula et al., Citation2005). In their review, Bond and Bergstrom (Citation2006) summarized the different correction factors that varied by filter type. For Zefluor PTFE membrane filters, the absorption enhancement was 1.3 to 2.4 times. This study utilized archived ambient filters and did not have accompanying light-scattering data to perform detailed artifact correction. Thus, the MAC determined in this study needs to be considered as uncorrected for absorption enhancement effects and may be a factor of 2 higher. Nevertheless, recognizing this limitation, the uncorrected MAC estimated in this study is applicable to the CSN and FRM filters used to estimate BC from light transmission measurements that would be equivalent to thermal EC TOR, which is our main objective.
In addition to deriving the MAC values, the study also demonstrated the importance of the I0 measurements and its potential impact. As indicated in the preceding sections, having an I0 transmission value that is lower than that of an exposed filter (I) results in a negative batt. As seen in , this effect is illustrated further in terms of BC calculated using a fixed MAC of 10 m2/g for purposes of demonstration. Individual filters with PM2.5 mass concentrations up to 20 μg/m3 were seen to have negative BC estimations due to the I0 value. On the contrary, where feasible, measuring light transmission of the same filter before (I0) and after sampling (I) offers the best solution. This is a recommended approach for future measurements and is cost-effective to perform the I0 measurement during the process of tare weighing. demonstrates the benefit of this approach, where MTL filters were analyzed prior to sampling to acquire the I0, minimizing the amount of values with negative attenuation.
Figure 12. BC calculation using a constant MAC of 10 m2/g as a function of PM2.5 mass concentration (μg/m3) using (a) All Average I0 on archived Whatman filters and (b) filter-specific I0 on MTL filters in use during the study.
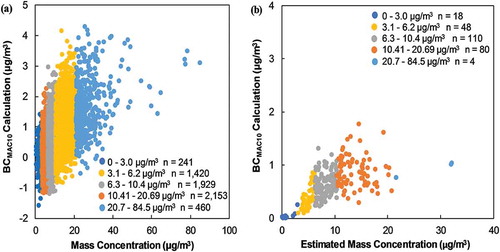
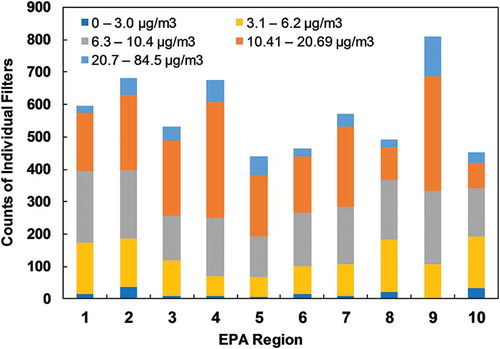
highlights the counts of each mass concentration for EPA Regions for all the sampled filters analyzed in the MAC study. Region 9 had the most numbers of filters with PM2.5 mass concentrations above 10 μg/m3. Looking specifically at the variation of batt as a function of EC TOR by IMPROVE_A for Region 9 illustrated improved correlation factors for larger mass concentrations where net mass concentration ranges of 10.41–20.69 and 20.7–84.5 μg/m3 had correlations of 0.65 and 0.75, respectively. Results aligned with those of the entire data set as seen in , where lightly loaded filters may have high uncertainty in this analysis with estimated I0 values as seen with the 0–3 μg/m3 range having no correlation for the calculation of the Region 9 MAC in that concentration range, while the ranges that included 10–84.5 μg/m3 had both MAC values close to literature and high correlation.
Table 4. Region 9 relationship of PM2.5 mass concentration (μg/m3) for the derived slope (MAC), y-intercept, and correlation.
Figure 13. Counts of individual filters within each mass concentration range for EPA Regions for all the sampled filters analyzed in the MAC study.
Conclusion
Results in this study showed that the relationship between thermal–optical EC and RWS light attenuation, batt, from ambient samples acquired through the robotic optical analysis provides an MAC, σatt, comparable to ranges found in literature (Chow et al., Citation2010). robotic optical analysis is a valid, cost-effective means to obtain a vast amount of BC data from archived and current routine Teflon filters, allowing further analysis of the seasonal and regional variability in the MAC. Based on the estimated human effort involved in manual optical absorption analysis, robotic light absorption analysis provides approximately a 75% time saving over manual transmission analysis.
The Robotic OT21 analyzes a larger area of the filter over the Benchtop OT21, allowing us to fully investigate the effect of the filter blank, I0, in the calculation of the batt. This evaluation illustrated that for the archived Teflon filters used in this study, a filter blank transmission value estimated using lab blanks from the same period was not completely representative of the actual blank transmission for all samples. This impacted the resulting attenuation calculations where the transmission through the unexposed filter was lower than that of the exposed filter. Using an estimated blank I0 affects the y-intercept in the derivation of MAC, and the I0 value will cause a larger number of negative batt and lower BC calculations especially for a low PM2.5 loading. While there is not an effect on the derived MAC or correlation values, for a more accurate calculation of BC with minimal false negatives, a filter-specific blank measurement (i.e., transmission of blank filter during tare weighing process) is necessary. It is recommended that the transmission analysis be performed on the filter prior to sampling to allow for a more accurate BC calculation and for this analysis to be used as a surrogate for OC/EC measurements in locations with low BC and low PM2.5 emissions. As a tool to explore relationships of the most tailored approach to the MAC derivation, we believe that utilizing an estimated I0 value on archived filters is valuable, as evident in the high correlation values to the EC TOR by IMPROVE_A seen during this study for winter months and high PM2.5 mass concentrations (more than 10 μg/m3).
This large-scale evaluation of the relationship between batt and EC TOR by IMPROVE_A illustrated that MAC values can range from 5 to 11 m2/g with varying levels of correlation. Investigation into the effects of mass concentration, seasonal variation, and regional variability showed that MAC and correlation were highly variable with considerably negligible correlation at low PM2.5 mass concentrations. Seasonally, the correlations were typically the lowest during summer (r2 = 0.2 to 0.5) and highest during winter (r2 = 0.6 to 0.9) except for EPA Regions 5 and 7, which showed low correlations even in winter. The EPA Regions in the central portion of the country had low correlation (r2 of 0.10–0.38) and highly variable MAC, especially in the spring, summer, and fall. These findings appear to be related to the EC fraction in mass (the higher the EC, the higher the correlation), the presence of light-scattering species and soil-component (the larger the fraction of species, the lower the correlation), and total PM2.5 mass (the lower the mass, the lower the correlation). The findings suggest the need for using a region-specific MAC for a more representative BC estimate. The data also imply that in certain regions (e.g., Region 4, Region 10), a seasonally different MAC may also need to be used. Applying a season- and region-specific factor with the I0 measured on the same filter as the exposed filter will provide a basis for utilizing optical analysis on Teflon filter media to estimate BC. This will maximize data collection for future samples with an efficient determination of both net gravimetric mass and BC on a single Teflon filter reducing costs for monitoring agencies.
Supplemental Material Robotic Optical Carbon Manuscript Presler-Jur Review
Download PDF (1.8 MB)Acknowledgment
Research described in this paper was made possible by RTI International Internal Research and Development Award. One of the authors (PD) was also supported by a RTI Professional Development Award. The authors gratefully acknowledge the guidance of Neil Frank of the EPA (retired) and the assistance of Wayne Winstead, Sara Harrison, Linda Andrews, Ed Rickman, Eric Poitras, and Laura Haines of RTI International. Mention of commercial products or services and/or links to non-EPA sites do not imply official EPA endorsement.
Supplemental data
Supplemental data for this paper can be accessed on the publisher’s website.
Additional information
Notes on contributors
Paige Presler-Jur
Paige Presler-Jur and Prakash Doraiswamy are research environmental scientists at RTI International in Research Triangle Park, NC.
Prakash Doraiswamy
Paige Presler-Jur and Prakash Doraiswamy are research environmental scientists at RTI International in Research Triangle Park, NC.
Okisha Hammond
Okisha Hammond is an environmental scientist at RTI International in Research Triangle Park, NC.
Joann Rice
Joann Rice is a physical scientist at the Environmental Protection Agency in the Office of Air Quality Planning and Standards in Research Triangle Park, NC.
References
- Ahmed, T., V.A. Dutkiewicz, A. Shareef, G., Tuncel, S. Tuncel S.,, and L. Husain. 2009. Measurement of black carbon (BC) by an optical method and a thermal-optical method: Intercomparison for four sites. Atmos. Environ. 43:6305–11. doi: 10.1016/j.atmosenv.2009.09.031
- Andreae, M.O., and A. Gelencser. 2006. Black carbon or brown carbon? The nature of light-absorbing carbonaceous aerosols. Atmos. Chem. Phys. 6:3131–48. doi: 10.5194/acp-6-3131-2006
- Birch, M.E., and R.A. Cary. 1996. Elemental carbon-based method for monitoring occupational exposures to particulate diesel exhaust. Aerosol Sci. Technol. 25:221–41. Doi: 10.1080/02786829608965393
- Bond, T.C., T.L. Anderson, and D.E. Campbell. 1999. Calibration and intercomparison of filter-based measurements of visible light absorption by aerosols. Aerosol Sci. Technol. 30:582–600. Doi: 10.1080/027868299304435
- Bond, T.C., and R.W. Bergstrom. 2006. Light absorption by carbonaceous particles: An investigative review. Aerosol Sci. Technol. 40, 27–67. Doi: 10.1080/02786820500421521
- Bond, T.C., S.J. Doherty, D.W. Fahey, P.M. Forster, T. Berntsen, B.J. DeAngelo, M.G. Flanner, S. Ghan, B. Kärcher, D. Koch, et al. 2013. Bounding the role of black carbon in the climate system: A scientific assessment. J. Geophys. Res. Atmos. 118:5380–552. Doi: 10.1002/jgrd.50171
- Cahill, T.A., R.A. Eldred, D.J. Shadoan, P.J. Feeney, B.H. Kusko, and Y. Matsuda. 1984. Complete elemental analysis of aerosols: PIXE, FAST, LIPM, and MASS. Nucl. Instrum. Methods Phys. Res. Sect. B 231:291–5. Doi: 10.1016/0168-583X(84)90381-1
- Campbell, D.E., S. Copeland, and T.A. Cahill. 1995. Measurement of aerosol absorption coefficient from Teflon filters using integrating plate and integrating sphere techniques. Aerosol Sci. Technol. 22:287–92. doi: 10.1080/02786829408959747
- Cassee, F.R., M.-É. Héroux, M.E. Gerlofs-Nijland, and F.J. Kelly. 2013. Particulate matter beyond mass: Recent health evidence on the role of fractions, chemical constituents and sources of emission. Inhal. Toxicol. 25:802–12. doi: 10.3109/08958378.2013.850127
- Chou, C.C.K., W.N. Chen, S.Y. Chang, T.K. Chen, and S.H. Huang. 2005. Specific absorption cross-section and elemental carbon content of urban aerosols. Geophys. Res. Lett. 32:L21808. doi: 10.1029/2005GL024301
- Chow, J.C., J.G. Watson, L.-W.A. Chen, M.C.O. Chang, N.F. Robinson, D. Trimble, D., S. Kohl. 2007. The IMPROVE_A temperature protocol for thermal/optical carbon analysis: Maintaining consistency with a long-term database. J. Air Waste Manage. Assoc. 57:1014–23. doi: 10.3155/1047-3289.57.9.1014
- Chow, J.C., J.G. Watson, P. Doraiswamy, L.-W.A. Chen, D.A. Sodeman, D.H. Lowenthal, K. Park, W.P. Arnott, N. Motallebi. 2009. Aerosol light absorption, black carbon, and elemental carbon at the Fresno Supersite, California. Atmos. Res. 93:874–87. doi:10.1016/j.atmosres.2009.04.010
- Chow, J.C., J.G. Watson, M.C. Green, and N.H. Frank. 2010. Filter Light attenuation as a surrogate for elemental carbon. J. Air Waste Manage. Assoc. 60:1365–75. doi: 10.3155/1047-3289.60.11.1365
- Chow, J.C., J.G. Watson, L.C. Pritchett, W.R. Pierson, C.A. Frazier, and R.G. Purcell. 1993. The DRI thermal/optical reflectance carbon analysis system: Description, evaluation and applications in U.S. air quality studies Atmos. Environ.` 27A:1185–201. doi: 10.1016/0960-1686(93)90245-T
- Flanagan, J.B., R.K.M. Jayanty, E.E. Rickman, Jr., and M.R. Peterson. 2006. PM2.5 Speciation Trends Network: Evaluation of whole-system uncertainties using data from sites with collocated samplers. J. Air Waste Manage. Assoc. 56:492–9. doi: 10.1080/10473289.2006.10464516
- Forder, J.A. 2014. Simply scan—Optical methods for elemental carbon measurement in diesel exhaust particulate. Ann. Occup. Hyg. 58:889–98. doi:10.1093/annhyg/meu037
- Frank, N., J. Rice, and J. Tikvart. 2010. Optical measurements of PM2.5 collected on Teflon filters to estimate elemental carbon. Air and Waste Management Association (AWMA) International Specialty Conference on Leapfrogging Opportunities for Air Quality Improvement, May 2010, Xi’an, Shaanxi Province, China.
- Fuller, K.A., W.C. Malm, and S.M. Kreidenweis. 1999. Effects of mixing on extinction by carbonaceous particles. J. Geophys. Res. 104:15941–54. doi: 10.1029/1998JD100069
- Grahame, T.J., R. Klemm, and R.B. Schlesinger. 2014. Public health and components of particulate matter: The changing assessment of black carbon. J. Air Waste Manage. Assoc. 64:620–60. doi: 10.1080/10962247.2014.912692
- Gutknecht, W., J. Flanagan, A. McWilliams, R.K.M. Jayanty, R. Kellogg, J. Rice, P. Duda, R.H. Sarver. 2010. Harmonization of uncertainties of x-ray fluorescence data for PM2.5 air filter analysis. J. Air Waste Manage. Assoc. 60:184–94. doi: 10.3155/1047-3289.60.2.184
- Hand, J.L., W.H. White, K.A. Gebhart, N.P. Hyslop, T.E. Gill, and B.A. Schichtel. 2016. Earlier onset of the spring fine dust season in the southwestern United States. Geophys. Res. Lett. 43:2016GL068519. doi: 10.1002/2016GL068519
- Horvath, H. 1997. Experimental calibration for aerosol light absorption measurements using the integrating plate method—Summary of the data. J. Aerosol Sci. 28:1149–61. doi: 10.1016/S0021-8502(97)00007-4
- Kamboures, M.A., S. Hu, Y. Yu, J. Sandoval, P. Rieger, S.-M. Huang, S. Zhang, I. Dzhema, D. Huo, A. Ayala, et al. 2013. Black carbon emissions in gasoline vehicle exhaust: A measurement and instrument comparison. J. Air Waste Manage. Assoc. 63:886–901. doi: 10.1080/10962247.2013.787130
- Kirchstetter, T.W., T. Novakov, and P.V. Hobbs. 2004. Evidence that the spectral dependence of light absorption by aerosols is affected by organic carbon. J. Geophys. Res. 109:D21208. doi: 10.1029/2004JD004999
- Magee Scientific. 2016. Magee Scientific SootScanTM model OT21 transmissometer user manual. http://www.mageesci.com/EACworkshop2016/MANUALS/OT21/OT21_UsersManual_V52.pdf
- Peterson, M.R., M.H. Richards, E.D. Winegar, and R.J. Tropp. 2002. Thermal-optical-transmittance analysis for organic, elemental, carbonate, total carbon, and OCX2 in PM2.5 by the EPA/NIOSH method. Proceedings, Symposium on Air Quality Measurement Methods and Technology—2002, Air & Waste Management Association, Pittsburgh, PA, 83-81–83-19.
- Pohl, K., M. Cantwell, P. Herckes, and R. Lohmann. 2014. Black carbon concentrations and sources in the marine boundary layer of the tropical Atlantic Ocean using four methodologies. Atmos. Chem. Phys. 14:7431–43. doi: 10.5194/acp-14-7431-2014
- Pope, C.A. III, and D.W. Dockery. 2006. Health effects of fine particulate air pollution: Lines that connect. J. Air Waste Manage. Assoc. 56:709–42. doi: 10.1080/10473289.2006.10464485
- Presler-Jur, A.P., P. Doraiswamy, F.X. Weber, O. Hammond, L.C. Greene, and R.K.M. Jayanty. 2016. Performance of a robotic weighing system and quality practices for gravimetric mass measurements. Aerosol Air Qual. Res. 16:2438–51. doi: 10.4209/aaqr.2015.12.0670
- Ramanathan, V., and G. Carmichael. 2008. Global and regional climate changes due to black carbon. Nat. Geosci. 1:221–27. doi: 10.1038/ngeo156
- Rohr, A.C., and R.E. Wyzga. 2012. Attributing health effects to individual particulate matter constituents. Atmos. Environ. 62:130–52. doi: 10.1016/j.atmosenv.2012.07.036
- Solomon, P.A., D. Crumpler, J.B. Flanagan, R.K.M. Jayanty, E.E. Rickman, and C.E. McDade. 2014. U.S. national PM2.5 chemical speciation monitoring networks—CSN and IMPROVE: Description of networks. J. Air Waste Manage. Assoc. 64:1410–38. doi: 10.1080/10962247.2014.956904
- U.S. EPA. 1998. Quality assurance guidance document 2.12: Monitoring PM2.5 in ambient air using designated reference or Class I equivalent methods. Research Triangle Park, NC: U.S. EPA.
- U.S. EPA. 2011. Frequently asked questions and answers associated with deployment of MTL 46.2 mm PTFE filters in the PM2.5, PM–10, and low-volume lead (Pb) monitoring networks, February 15, 2011. https://www3.epa.gov/ttnamti1/files/ambient/qaqc/Filterarticlefinalfaq.pdf ( accessed September 28, 2016).
- U.S. EPA. 2012a. 40 CFR Appendix J to Part 50—Reference method for the determination of particulate matter as PM10 in the atmosphere. Fed. Reg.
- U.S. EPA. 2012b. 40 CFR Appendix L to Part 50—Reference method for the determination of fine particulate matter as PM2.5 in the atmosphere. Fed. Reg.
- U.S. EPA. 2012c. 40 CFR Appendix O to Part 50—Reference method for the determination of coarse particulate matter as PM10-2.5 in the Atmosphere. Fed. Reg.
- U.S. EPA. 2013a. 40 CFR Parts 50, 53 and 58—National Ambient Air Quality Standards for particulate matter: Final rule. Fed. Reg. 78:3085–287.
- U.S. EPA. 2013b. Quality assurance handbook for air pollution measurement systems, Volume II, Ambient air quality monitoring program. Research Triangle Park, NC: U.S. EPA.
- Virkkula, A., N.C. Ahlquist, D.S. Covert, W.P. Arnott, P.J. Sheridan, P.K. Quinn, D.J. Coffman. 2005. Modification, calibration and a field test of an instrument for measuring light absorption by particles. Aerosol Sci. Technol. 39:68–83. doi:10.1080/027868290901963
- Watson, J.G. 2002. Visibility: Science and regulation. J. Air Waste Manage. Assoc. 52:628–713. doi: 10.1080/10473289.2002.10470813
- Watson, J.G., J.C. Chow, and L.W.A. Chen. 2005. Summary of organic and elemental carbon/black carbon analysis methods and intercomparisons. Aerosol Air Qual. Res. 5:65–102. doi: 10.1080/10473289.2002.10470813
- White, W.H., K. Trzepla, N.P. Hyslop, and B.A. Schichtel. 2016. A critical review of filter transmittance measurements for aerosol light absorption, and de novo calibration for a decade of monitoring on PTFE membranes. Aerosol Sci. Technol. 50:984–1002. doi: 10.1080/02786826.2016.1211615
- Wyzga, R.E., and A.C. Rohr. 2015. Long-term particulate matter exposure: Attributing health effects to individual PM components. J. Air Waste Manage. Assoc. 65:523–43. doi: 10.1080/10962247.2015.1020396