
ABSTRACT
This study characterized the seasonal concentration (C) and emission (E) patterns of odor, ammonia (NH3), and hydrogen sulfide (H2S) over the course of a whole year and their diurnal patterns in cold, warm, and mild seasons for a naturally ventilated free-stall dairy barn. It was found that seasonal odor and NH3 and H2S emissions varied greatly: from 17.2 to 84.4 odor units (OU) sec−1 AU−1 (AU: animal unit, 500 kg of animal body mass), from 0.27 to 0.92 mg sec−1 AU−1, and from 3 to 105 μg sec−1 AU−1, respectively. The overall concentrations of odor and NH3 were higher in the winter, whereas the emissions were higher in the mild and warm seasons. Diurnal variation was most significant for odor emission (OE) in the mild season when the ratio of maximum (279.2 OU sec−1 AU−1) to minimum value (60.5 OU sec−1 AU−1) was up to 4.6. The indoor air quality was also evaluated by considering not only the health effect of individual gases, but also the additive effect of NH3 and H2S. Results showed that the indoor air quality was poorest in cold seasons when NH3 C could exceed the threshold limit set out in occupational health regulation, and in fact could worsen due to the additive effect of the two gases. Further, it was suggested NH3 was a good indicator for predicting odor concentration (OC) or OE. The impact of climatic parameters on odor and gases were also examined, and it was found ventilation rate (VR) negatively affected OC and NH3 C, but positively impacted OE and NH3 E. Using 70% of the total data, a multilinear model for OE was developed as a function of VR and indoor relative humidity and was validated to be acceptable using the rest of the data.
Implications: Diurnal and seasonal variations of odor, NH3, and H2S concentrations and emissions were monitored for a naturally ventilated dairy barn in a cold region. The emission factors were calculated and indoor air quality was evaluated. The overall odor and NH3 concentrations were higher in winter, whereas emissions were higher in the mild and warm seasons. Diurnal variation was most significant for odor emission in the mild season, when the ratio of maximum to minimum value was up to 4.6. The results can be used to estimate odor and gas emissions from other dairy barns in Canada and other cold regions.
Introduction
Intensive animal housing and feeding operations around the world have been rapidly developed and have raised public concern about their adverse impact on human health and the environment. Intensive animal production is associated with various air emissions, including NH3 and H2S, as well as being a general odor nuisance, leading to complaints of eye, nose, and throat irritation, headache, and drowsiness (Schiffman, Citation1998). At low concentrations, NH3 and H2S are both potential threats for respiratory irritation, neurological effects, and immunological effects, and can even result in death at very high concentrations (Copeland, Citation2014). Additionally, NH3 not only contributes to eutrophication of surface water and nitrate contamination of groundwater, but also impairs atmospheric visibility through forming an aerosol (U.S. EPA, Citation2004).
Agriculture is the most important NH3 emission source, with the majority of NH3 emissions being attributed to livestock production (Webb et al., Citation2005). In Canada, animal agriculture contributed 64% of total NH3 emissions as shown by a national inventory in 2002 (Carew, Citation2010). Several studies have been carried out to quantify air emissions from different animal sectors (Gay et al., Citation2003; Hayes et al., Citation2006); however, odor data from dairy operations are still limited (Zhu et al., Citation2000; Gay et al., Citation2003; Zhao et al., Citation2007; Akdeniz et al., Citation2012a; Mosquera et al., Citation2006; Rzeźnik et al., Citation2014). For dairy barns in Canada specifically, there are no published odor emission data, and NH3 and H2S emission data are also insufficient. It was indicated that odor and gas emissions varied by animal species, climate, region, ventilation rate, and so on (Gay et al., Citation2003; Ngwabie et al., Citation2009), and odor and gas concentrations and emissions from animal barns would also vary diurnally and seasonally (Sun et al., Citation2010; Wang, Citation2007). Therefore, long-term measurements for different animal species, different regions (climates), and different seasons are necessary to improve the air emission database involving livestock production. This first step is necessary for establishing appropriate control and mitigation strategies for odor and gas emissions. Diurnal and seasonal variations of gas emissions, including NH3 from dairy barns, have been characterized (Saha et al., Citation2014); however, diurnal and seasonal odor emission patterns from dairy buildings have not been well studied. Additionally, given that livestock room air is composed of hundreds of components (Ni et al., Citation2012), the indoor air quality of dairy barns has not been thoroughly evaluated in research studies considering the combined health effect of the multiple components, as well as their possible diurnal and seasonal concentration variabilities.
As odor measuring is time-consuming and costly, there is often a desire to relate odor to an odorous component such as NH3 or H2S, components that are relatively easy to measure. Amon et al. (Citation1997) reported a good relationship between OC and NH3 C in a clinoptilolite-treated broiler room. Blanes-Vidal et al. (Citation2012) found seasonal patterns of odor perception were associated with seasonal variations in NH3 C in nonurban residential communities. In another study, Blanes-Vidal et al. (Citation2009) observed OC was most strongly related to the sulfur-containing compounds, including H2S, from agitated swine slurry. Fewer studies considered multiple factors for predicting livestock odor, such as various odorants, volatile organic compounds (Hobbs et al., Citation2000; Akdeniz et al., Citation2012b), or climatic parameters (Wang, Citation2007).
Hence, this study was conducted at a naturally ventilated free-stall dairy barn in a cold region climate (the Canadian Prairies), aiming to (1) reveal seasonal variations of odor, NH3, and H2S concentrations and emissions and their diurnal variations during the cold, mild, and warm seasons; (2) evaluate indoor air quality in different seasons; (3) investigate the correlations between odor and odorous gases (NH3 and H2S) and the impact of climatic parameters on odor and gases; and (4) develop a prediction model for odor emission (OE) and validate the model.
Material and methods
Description of the dairy barn
The dairy barn chosen for this study is a research dairy barn located in Saskatoon, Saskatchewan, Canada (106.6º W and 52.1º N). Most of the facility is a free-stall area where approximately 112 milking cows are housed. The dairy barn has a smaller average herd size compared to the provincial average (178 in Saskatchewan), but is a middle-scale barn across the whole country (Government of Canada, Citation2016). A photograph of the inside of the barn is provided in . The dairy breed is Holstein, and the cows are routinely fed a mixed ration of barley silage and alfalfa hay, as well as concentrates with barley grain, canola meal, soybean meal, distiller’s dried grains, and also a mineral–vitamin supplement. The milk production is 38 L per cow daily. The floor area is 3, 230 m2. On the south side, 4 pens of 12 cows each are housed and milked in the parlor, while on the north side there are 52 stalls where cows are milked in an automatic milking unit, or optionally in the parlor. The automatic manure scraper is set to clean the alleyways four times daily. The manure and all wash water are pumped to a covered slurry tank with a capacity of 2.52 million L outside the barn.
Figure 1. Inside view and brief schematic plan of the dairy barn.
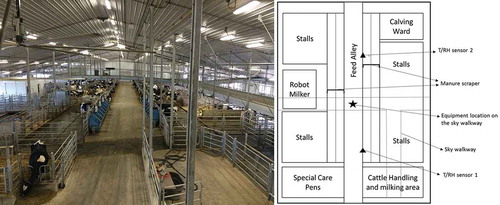
In the mild and warm seasons, ventilation of the free-stall area is controlled by sliding window panels on the side walls, while in winter all the windows are closed and six chimney fans provide ventilation. On hot summer days, the end-wall door is also opened to increase ventilation. Three large-volume recirculation fans are used to keep the air temperature uniform, and a few radiant natural gas heaters are used to keep the temperatures above freezing in winter.
Measurement schedule
Diurnal measurements were performed for two days, respectively, in February (February 9 and 12), July (July 21 and 23), and October (October 13 and 15) of 2015, which represent the cold, warm, and mild seasons in Saskatoon. The two days were not consecutive due to the difficulty in setting up the odor laboratory sessions. Only daytime was considered to do measurements, when outdoor activities mainly occurred and air quality was a concern to the neighboring residents. The on-site gas sampling station was continuously measuring NH3, H2S, and carbon dioxide (CO2) from 6:00 a.m. to 9:00 p.m. on each measurement day. Two air samples were collected simultaneously every 3 hr for odor concentration (OC) measurement (from 6:00 to 9:00 a.m., from 9:00 a.m. to 12:00 p.m., from 12:00 to 3:00 p.m., from 3:00 to 6:00 p.m., and from 6:00 to 9:00 p.m.).
The seasonal sampling and measurements were conducted on one picked day each month (when the weather was typical) from February 2015 to January 2016. On each measuring day, the concentrations of NH3 and H2S were continuously monitored for 2 hr in the early morning (6:00 to 8:00 a.m.), and for another 2 hr in the early evening (6:00 to 8:00 p.m.). During each morning or evening sampling period, two air samples were collected for OC measurement. When the diurnal measurements were performed on February 9, July 21, and October 13, gas concentrations during the same morning and evening periods and OC from 6:00 to 9:00 a.m. and from 6:00 to 9:00 p.m. were extracted to represent the monthly results.
Measurement methods
The room air was continuously drawn by an air pump from a fixed sampling point. A short piece of Teflon tubing was used to fix the sampling height at around 1.8 m above the center area (). The air was then sent to the gas analyzers for concentration measurements. The equipment included a CO2 sensor (K30 CO2 sensor, CO2 Meter, USA), an NH3 sensor (C21 NH3 transmitter, GFG Instrumentation, USA), and an H2S analyzer (JEROME 631-X, Arizona Instrument Corporation, Arizona Instrument LLC, USA), which were all located on the overhead walkway, as shown in . The measurement ranges and accuracies were 0–10,000 ppm and ±3% (±30 ppm) for the CO2 sensor, 0–100 ppm and ±5% for the NH3 sensor, and 0.003–50 ppm and ±0.003 ppm at 0.05 ppm and ±0.03 ppm at 0.50 ppm for the H2S analyzer. Every 5 min, one measurement for each of the three gas concentrations would be recorded by a data logger (CR10X, Campbell Scientific Corporation, Canada). Air samples were collected using 10-L Tedlar air bags and were analyzed for OC in the Olfactometry Laboratory at the University of Saskatchewan. There were usually eight or at least six trained panelists participating in each odor session. The screening of panelists and measurements of OC were conducted in compliance with the CEN (Citation2003) standard. Additionally, the barn’s indoor temperature (Tin) and relative humidity (RHin) were also monitored continuously by two wireless T/RH data loggers (OM-EL-USB-2, Omega, Canada) with –35°C to 80°C and 0 to 100% for T and RH measurement ranges and 0.5°C and 3.5% for T and RH accuracies, and were recorded every 5 min. The ambient hourly temperature (Tout) and relative humidity (RHout) were acquired from Environment Canada (the department of the government of Canada with responsibility for coordinating environmental policies and programs).
The maintenance and calibration of the olfactometer and gas analyzers were all performed according to their operational requirements.
Ventilation rate and emission rate calculation
Hourly ventilation rate (VR) was estimated using a CO2 mass balance method, which is a widely used method for estimating VR for naturally ventilated dairy barns (Ngwabie et al., Citation2011; Wu et al., Citation2012). The equation used to calculate VR is based on per heat production unit (HPU) (1000 W total heat produced by the livestock), which is as follows (CIGR [International Commission of Agricultural Engineering], Citation2002):
where VR is ventilation rate (m3 hr−1); (CO2)P is CO2 production per HPU based on a 24-hr period (0.185 m3 hr−1); (CO2)i is indoor CO2 concentration and (CO2)o is outdoor CO2 concentration in parts per million (ppm); a is a constant of 0.22 for dairy cows in free-stalls; h is the hours after midnight; hmin is hours after midnight with minimum cow activity, which is 2.9 (2:55 a.m.); Φtot is total heat production (W); m is body mass, which is 755 kg on average for the barn; Y1 is milk production (kg day−1); and P is days of pregnancy, the effect of which was neglected in this study. To modify Φtot per HPU outside the thermoneutral zone, the following equation was used for cattle (CIGR, Citation2002):
where Tin is indoor T (°C). The actual (CO2)o on the measurement days was measured in the mild and warm seasons. To reduce the possible pollution from the open windows, (CO2)o was measured 5 m away from the southeast side of the dairy barn for 30 min at the end of the day. In the cold season, (CO2)o was assumed to be 390 ppm (International Panel on Climate Change [IPCC], Citation2013) when the ambient measurement was not applicable.
Knowing the odor and gas concentrations and VR, the odor and gas emissions were calculated as follows:
where E is odor emission rate in odor units (OU) per second per animal unit (AU), odor units per second per square meter of the floor area (OU sec−1 m−2), or odor units per second per cow (OU sec−1 cow−1). Gas emission E is in units of mg sec−1 AU−1, mg sec−1 m−2, or mg sec−1 cow−1; VR is ventilation rate of the room (m3 sec−1); and ∆C is the difference of odor and gas concentrations between the room incoming air and exhaust air in units of OU m−3 or ppm. The concentrations of odor, NH3, and H2S of inlet air (ambient air) were negligible compared to the indoor concentrations and were treated as zero.
Gas emissions were calculated on an hourly basis for both diurnal and seasonal results. Therefore, each data point of gas concentrations and emissions in the figures that follow was the average of hourly results within the 3 hr, or the average of hourly results from the morning and evening periods. For odor emissions, 3-hr average of the diurnal results and 2-hr average from both morning and evening periods of the seasonal results were calculated for a basis.
Statistical data analysis
The statistical evaluation of data was performed by SPSS software 22. “Daily” effect combined the results of ambient weather, ventilation rate, animal management, and so on, while “diurnal” effect was a function of the time of day. There were two days chosen in each season with each having five diurnal levels: early morning (EM) from 6:00 to 9:00 a.m., late morning (LM) from 9:00 a.m. to 12:00 p.m., early afternoon (EA) from 12:00 to 3:00 p.m., late afternoon (LA) from 3:00 to 6:00 p.m., and early evening (EE) from 6:00 to 9:00 p.m. To examine the “diurnal” effect in each season, a General Linear Model (GLM) was performed where “daily” and “diurnal” were the two factors. The main effects of the two factors and the interaction between “daily” and “diurnal” were examined. If the interaction effect was significant, “diurnal” effect was then examined separately for each day. To do multiple comparisons, the Duncan test was selected in GLM, or a nonparametric test (Kruskal–Wallis one-way analysis of variance [ANOVA]) was selected when error variances of the data were unequal. For seasonal results, only the factor of “seasonal” was considered, and the same methods were used to examine the “seasonal” effect and perform multiple comparisons of the monthly results. The significance was indicated by p-value (0.05 level). A p-value less than or equal to 0.05 indicated a significant effect or variance. Multiple comparisons for seasonal OC and OE were not performed.
The relationships among odor, gases, and climatic parameters were indicated by Pearson correlation coefficients (r). The outcome of the results from SPSS showed two different significance levels (0.05 level and 0.01 level) for which p ≤ 0.05 indicated significant correlation and p ≤ 0.01 indicated very significant correlation. Using 70% of the data, randomly selected, the regression model for OE was derived as follows:
where Y is the dependent factor OE, A0 is constant, A1, A2, A3, …, Ap are coefficients, and X1, X2, X3, …, Xp are independent factors including VR, T, and RH. As there may exist significant correlations among climatic parameters (e.g., VR and Tout), multicollinearity among the independent variables probably would occur when input all the factors to regress the model. To solve the problem, a stepwise regression method was used to remove some of the highly correlated factors. The paired-samples t-test was performed to compare the difference between modeled results and observed results.
Results and discussion
Diurnal odor and gas profiles
Climatic parameters
The Tout varied greatly among the three seasons. The Tin of this dairy barn was controlled within a narrow range of 5.1–5.9°C during the cold season, and was more affected by outdoor weather in the warm and mild seasons with ranges of 19.3–28.0°C and 8.6–16.0°C, respectively. gives the diurnal profile of VR. No significant daily difference in VR between the two days was observed in any season (p > 0.05). Diurnal VR was significantly lower in the EM than in the other periods in the cold season and was significantly higher in the afternoon during the mild season (p < 0.05), but showed no significant difference in the warm season (p > 0.05). There was a noticeable amount of difference for VR in the afternoon between the mild season and warm season, which was explained by the significantly positive correlation between VR and wind speed (r = 0.63, p < 0.01) along with higher wind speeds during afternoons of October. Wind direction also affected where the fresh air was coming from the windows and how it mixed with the room air. The orientation of the dairy barn is northeast to southwest. Wind in October came from the northwest-west (299º), which was more favorable for ventilation than the wind direction in July (from the south-southwest, 200º).
Figure 2. 3-Hour average VR, OC, and OE in the cold (a), warm (b), and mild (c) seasons (error bar was plotted by standard deviation).
Odor concentrations and emissions
Diurnal 3-hour average OC and OE are presented in . The daily difference of OC or OE was not significant in any season (p > 0.05). The diurnal effect was significant for OC and OE in both cold and mild seasons (p < 0.05), which contradicts the conclusion of Zhu et al. (Citation2000), who found OC and OE were both constant for a naturally ventilated dairy barn in October. This could be due to the smaller variations of VR in their study. During the cold season, diurnal OC varied differently on the two days, while OE showed highly consistent patterns on both days with being obviously low in the EM and high in the evening. No significant diurnal variance (p > 0.05) was found for OC or OE during the warm season when analyzing the results from the two days together; however, great diurnal variations of OC and OE were observed on July 21 when OC and OE were as low as 153 OU m−3 and 32.5 OU sec−1 AU−1, respectively, in the EM, and as high as 549 OU m−3 and 109 OU sec−1 AU−1, respectively, in the LA. A higher impact of VR on OE was observed during the mild season than in the cold and warm seasons, with the maximum and minimum ratio of OE being up to 4.6. Because of consistent VR variations, the OC and OE of the two days both presented highly consistent diurnal patterns with lower OC, but apparently higher OE during the entirety of the afternoon.
Ammonia concentrations and emissions
Diurnal NH3 C and NH3 emissions (NH3 E) can be found in . Zhao et al. (Citation2007) observed a significant daily difference for NH3 C from a naturally ventilated dairy barn in summer, which was observed for both NH3 C and NH3 E in the cold and warm seasons in this study. The Tin, Tout, and VR were all slightly lower, while the RHin and RHout were slightly higher on February 9 than on February 12. This together may result in significantly higher levels of NH3 C and NH3 E (p < 0.05). Slightly higher VR and thus lower NH3 and NH3 E on July 21 than on July 23 were observed as well. Zhang et al. (Citation2005) and Saha et al. (Citation2014) indicated considerable diurnal variations of NH3 E for naturally ventilated dairy buildings, which was also found to be true in this study. In the cold season, there were significant differences in both diurnal NH3 C and NH3 E on February 9 (p < 0.05). Yang et al. (Citation2016) observed larger diurnal variations of NH3 E in the summer and fall at two dairy feedlots, and this pattern was confirmed in this study. In the warm season, NH3 C was significantly lower in the EM on July 21 (p < 0.05), but showed no significant diurnal effect on July 23 (p > 0.05). Significant diurnal variances (p < 0.05) were found in NH3 E for both days with lower values in the entire morning.
Figure 3. 3-Hour average NH3 C and NH3 E in the cold (a), warm (b), and mild (c) season.
In the mild season, very high similarities were observed from the two curves of both NH3 C and NH3 E, with the trend of diurnal NH3 C being opposite to that of NH3 E. Saha et al. (Citation2014) observed the highest NH3 E between 1:00 p.m. and 3:00 p.m. and the lowest between 4:00 a.m. and 6:00 a.m. Similarly, this study also found NH3 E tended to be highest from 12:00 to 3:00 p.m. and lowest in the EM.
Hydrogen sulfide concentrations and emissions
Diurnal H2S C and H2S emissions (H2S E) are plotted in . Due to the malfunction of the H2S analyzer, the data for H2S C for the whole day of February 12 and from 6:00 to 9:00 a.m. on February 9 are missing. In the cold season, a significant diurnal effect was indicated by the obvious difference between H2S C in the LM and in the EE (p < 0.05). In the warm season, significant variance (p < 0.05) was observed in diurnal H2S C on July 21 with lower H2S C in the EM and EE but this was not found on July 23. The diurnal variations of H2S E showed similar patterns to diurnal VR on both days, with the maximum in the EA being significantly higher than the minimum in the EE (p < 0.05). In the mild season, H2S C and H2S E were very low (less than 0.03 ppm and 0.01 mg sec−1 AU−1, respectively) and showed highly consistent diurnal patterns for the two days. Significant diurnal variance was concluded from both H2S C and H2S E (p < 0.05), which simultaneously showed a peak in the LM and a low in the LA.
Figure 4. 3-Hour average H2S C and H2S E in the cold (a), warm (b), and mild (c) seasons.
summarizes the minimum, maximum, and average of the diurnal results. It was found that the average OC in February (cold season) was obviously higher than in July (warm season) and October (mild season), while OE was the opposite. Due to the fluctuations of VR, seasonal variations of OE could be extremely large, with the average OE in October and July being 5.4 and 2.7 times that in February. Ammonia concentration was obviously high in winter and was low and similar in the warm and mild seasons. However, no such great difference was observed for NH3 E (p > 0.05). Similar to OC and NH3 C, H2S C also showed obvious seasonality. The highest H2S C occurred in the cold season and the lowest in the mild season. The seasonal variations of H2S E were even greater than that of OE, with a ratio of maximum (in July) to minimum (in October) being up to 13.8. The possible great seasonal variations of odor and gas emissions suggest it is necessary to obtain detailed seasonal (such as monthly) concentration and emission profiles of odor and gases from naturally ventilated dairy barns.
Table 1. Descriptive statistics of 3-hour average odor, NH3, and H2S concentrations and emissions in the cold, warm, and mild seasons.
Seasonal odor and gas profiles
Climatic parameters
From February 2015 to January 2016, the number of cows, Tin, RHin, and RHout changed from 102 to 116, from 6°C to 24°C, from 49% to 91%, and from 35% to 88%, respectively. The Tout and VR are plotted in . It shows that seasonal VR ranged from 5.0 to 69.2 m3 sec−1 with significant variances (p < 0.05). The overall VR in winter was obviously lower than during the mild and warm seasons, excluding March, when the windows were occasionally partially opened. In April, VR presented great diurnal variance, which was because the slightly higher wind speed (10 km hr−1) and more favorable wind direction (317º) in the early evening resulted in much higher VR than in the morning (7 km hr−1 and 290º). It was also found that VR in August and September was significantly lower than in the other warm months (p < 0.05), which may be attributed to the relatively lower wind speed in August and lower Tout and Tin in September.
Figure 5. Seasonal VR and concentrations and emissions of odor, NH3, and H2S.
Odor concentrations and emissions
also gives seasonal OC and OE variations. The average OC ranged from 203 to 639 OU m−3, which was within the ranges reported by Rzeźnik et al. (Citation2014) and Mosquera et al. (Citation2006), but higher than the 103–312 OU m−3 reported by Akdeniz et al. (Citation2012a) for dairy barns with mechanical ventilation. The average OC of March, June, and August was 374 OU m−3 and was higher than the 100 OU m−3 measured by Zhao et al. (Citation2007). This can be attributed to the fact that the dairy barns Zhao et al. (Citation2007) studied had additional wide-open ridge and cooling fans that were likely to provide more fresh air and further decrease odor and gas concentrations inside. Zhao et al. (Citation2007) found no significant seasonal variations for OC, while the overall OC in the cold season, including November to March, was 37% higher than that in the mild and warm seasons from April to October. No obvious difference was observed between the results of the mild and warm seasons, which is consistent with the previous discussion that no significant difference existed between OC in July and October (p > 0.05).
As shown in , OE tended to be low and stable in the cold season (excluding March), but fluctuated greatly in the mild and warm seasons. Greater variations were presented in the seasonal OE than for OC. The highest OE was estimated to be 84.4 OU sec−1 AU−1, which was almost 5 times the minimum OE at 17.2 OU sec−1 AU−1. When comparing OE on a per floor area basis, the average OE was 2.38 OU sec−1 m−2, which was close to 3.30 OU sec−1 m−2 reported by Maasikmets et al. (Citation2015) for a naturally ventilated dairy barn with loose housing system in Estonia, and was higher than the results of Zhu et al. (Citation2000) due to their high VR, and thus very low OC, but was within the range summarized by Gay et al. (Citation2003) for 13 dairy barns in Minnesota. The average OE on a per cow basis was 69.3 OU sec−1 cow−1, which was comparable to the results of Mosquera et al. (Citation2006). Seasonal odor and gas concentrations and emissions are summarized in .
Table 2. Descriptive statistics of seasonal odor, NH3, and H2S concentrations and emissions.
Ammonia concentrations and emissions
Significant variances (p < 0.05) existed in the seasonal NH3 C as plotted in . Similar to OC, NH3 C was significantly higher in the cold season excluding August, when NH3 C (11 ppm) was significantly higher than in the other warm and mild months. In addition to the relatively lower VR in August compared to the overall VR over the summer, it was found that both RHout and RHin were higher, and increasing RHin and RHout proved to be associated with increasing NH3 C by their positive correlations (p < 0.01). From November 2015 to January 2016 when the windows were closed, NH3 C increased to above 11 ppm, but was considerably lower than the previous winter (February 2015), which may be explained by a relatively warmer winter when the windows were partially opened at times. The average NH3 C was 9.1 ppm in this study, which was higher than the 2.1 ppm from Samer et al. (Citation2012) and 6.6 ppm from Ngwabie et al. (Citation2009); their studies had higher ventilation. On the contrary, Arcidiacono et al. (Citation2015) reported much higher NH3 C (averaged 16.6 ppm) for naturally ventilated free-stall dairy buildings in Italy, which may be explained by their lower manure-removing frequency (one or two times daily), as well as the low sampling height of 10 cm above the floor. Ngwabie et al. (Citation2009) found NH3 C presented little variation during the winter months, which was also observed in this study from November 2015 to January 2016. Additionally, it was reported NH3 C in May was 60% of the winter values (Ngwabie et al., Citation2009), while in this study the average NH3 C over the summer only amounted to 39% of the winter results. The greater difference of seasonal NH3 C in this study can probably be attributed to greater outdoor weather differences between Canadian Prairies summers and winters. The release of NH3 is also directly related to the conversion of feed nitrogen to animal product (Maasikmets et al., Citation2015); however, no discussion could be carried out since the feed composition for this dairy barn was not analyzed.
As reported by Amon et al. (Citation2001) and Yang et al. (Citation2016), NH3 E from dairy barns varied over the course of the year, which was also observed in this study when seasonal NH3 E changed from 0.27 to 0.92 mg sec−1 AU−1. This finding is different from the conclusion of diurnally measured results (the variations of NH3 E among February, July, and October were not obvious). Seasonal NH3 E averaged 0.53 mg sec−1 AU−1, which is higher than 0.21 mg sec−1 AU−1 from the study of Maasikmets et al. (Citation2015). Wu et al. (Citation2012) found that NH3 E varied from 32 to 77 g day−1 HPU−1 for a naturally ventilated free-stall dairy building in Jutland. Using the same unit, seasonal NH3 E was in the range of 20–69 g day−1 HPU−1, which is comparable to the result of Wu et al. (Citation2012). If one only compared the summer results, the average NH3 E would be 0.53 mg sec−1 AU−1, which is lower than the 2.33 mg sec−1 AU−1 reported by Samer et al. (Citation2012), but is close to the lower end of the range of 0.56 to 1.11 mg sec−1 AU−1 indicated by Fiedler and Müller (Citation2011) (for two naturally ventilated dairy barns in Germany with more openings) and in the range of 0.36–0.78 mg sec−1 AU−1 reported by Schrade et al. (Citation2012) (for a naturally ventilated dairy barn in Switzerland). In winter, NH3 E averaged 0.44 mg sec−1 AU−1 and is lower than the 1.50 and 0.99 mg sec−1 AU−1 found by Samer et al. (Citation2012) and Snell et al. (Citation2003). When calculated by floor area, NH3 E averaged 28 μg sec−1 m−2, which is lower than the 43 μg sec−1 m−2 that was discussed by Gay et al. (Citation2003). Besides the ventilation rate, other factors could also be the reasons for the different NH3 E found in previous studies, including floor type, feeding routine, management, and so on.
Hydrogen sulfide concentrations and emissions
As can be seen from , H2S C fluctuated drastically (p < 0.05) over the year (from 0.01 to 0.20 ppm), and is higher than the results found by Zhao et al. (Citation2007) (from 2 to 31 ppb). Different from OC and NH3 C, H2S C tended to be high in both cold and warm seasons (excluding September), but low in the mild season, which confirmed the conclusion from diurnal results. As for H2S E, it was significantly higher from April to July (p < 0.05), but remained below 20 μg sec−1 AU−1 during the other months. The range was from 3 to 105 μg sec−1 AU−1. The average H2S E was 1.42 μg sec−1 m−2, which is higher than 0.29 μg sec−1 m−2 found by Maasikmets et al. (Citation2015), but within the range of 1.04 to 2.89 μg sec−1 m−2 as reported by Gay et al. (Citation2003).
Indoor air quality evaluation
As most Canadian provinces’ occupational health and safety regulations use the indoor threshold limits of NH3 and H2S recommended by the U.S. Occupational Safety and Health Administration (OSHA), the indoor air quality in the study barn was evaluated against OSHA threshold limits. It regulates indoor threshold limit values (TLV) of NH3 C and H2S C: They can be no more than 25 ppm and 1 ppm, respectively, for an 8-hr time-weighted average (T-TLV), and 35 ppm and 5 ppm, respectively, for short-term exposure limits (S-TLV) of less than 15 min (American Conference of Government Industrial Hygienists [ACGIH], Citation2010). The U.S. OSHA also suggests the effect of the mixtures should be considered as additive where the health effect and target organ or system are the same when none of the components have a value exceeding the TLV (ACGIH, Citation2010). That is, if the sum of
exceeds unity, the threshold limit of the mixture should be considered exceeded (where C1 is the observed concentration and T1 is the corresponding threshold limit). Since NH3 and H2S both cause upper respiratory tract irritation, their combined effect was examined in addition to their individual impact and was described by an indicator as given in .
Table 3. Indicator (the ratio of 8-hr average concentration to T-TLV) of individual gas concentration levels and their combined indicator.
The concentrations of NH3 and H2S remained below the S-TLV in all seasons. From 9:00 a.m. to 5:00 p.m. in the warm and mild seasons with good ventilation, the T-TLV was not exceeded for NH3 or H2S, and the additive indicator was also below 1. However, the February results showed the T-TLV for NH3 C could be exceeded in the cold season. The NH3 C was below the T-TLV on February12, but exceeded the T-TLV on February 9, which suggests respiratory threat when an occupant is exposed to the room air for 8 hr or longer. The combined indicator rose from 0.68 to 0.84 on February 12 if using the average H2S C of 155 ppb during the winter (November to March) to fill in the missing data, and rose from 1.09 to 1.31 on February 9, which has a substantial impact on indoor air quality as opposed to only considering the individual components.
Overall, the indoor air quality reduced from November to February when VR was small, which suggests the indoor air quality was poor during the cold season and sometimes could exceed TWA and cause respiratory irritation. Although for this dairy barn, it’s not usual for workers to stay in the barn for a continuous 8 hr, the results of the potential health risk in the cold season could still provide reference for the building design and operation plan of the other dairy barns; for example, for dairy barns where long-time stay inside the barn is a possibility, it might be necessary to install an NH3 sensor to continuously monitor the indoor concentration during the cold season and increase ventilation when necessary. Besides, indoor air quality could differ greatly among the winter or summer months, which is explained by the great variations of NH3 C. The best indoor air quality was observed during the mild season, followed by the warm season; however, it should be noted that higher odor and H2S emissions occurred during the warm and mild seasons, which would have more outdoor impact.
Impact of climatic parameters
A significant effect was observed for all five climatic parameters on OC (p < 0.05), with a negative effect of Tin, Tout, and VR, and a positive effect of RHin and RHout. Excluding Tin, the other four climatic parameters all had significant impact on OE (p < 0.01), but with an effect opposite to that on OC, suggesting the change of climatic parameters would increase one, but decrease the other.
The most related climatic parameter to OC and OE was Tout (r = –0.55, p < 0.01) and VR (r = 0.92, p < 0.01), respectively. Using curve estimation in SPSS, the best single linear regression model for OE was developed in cubic function with VR being the independent factor: OE (OU sec−1 AU−1) = –0.10 + 3.25 VR – 0.03 VR2 + 1.10 × 10⁻⁴ × VR3 (R2 = 0.89), where VR is in m3 sec−1, or OE (OU sec−1 AU−1) = 1.51 + 519 VR – 813 VR2 + 493 VR3 (R2 = 0.88), where VR is in m3 sec−1 AU−1.
Climatic parameters proved to have significant impact on gases as well. Amon et al. (Citation2001), Zhang et al. (Citation2005), and Ngwabie et al. (Citation2011) suggested NH3 E correlated with Tin, and Li et al.
(2014) revealed NH3 E was strongly related to Tout and RHin. Similar to our findings for OC, Tin, Tout, and VR all had significantly negative effects on NH3 C, and RHin and RHout both had positive impacts on NH3 C (p < 0.01), whereas NH3 E was only positively correlated with VR (p < 0.01) and negatively related to RHout (p < 0.05). The only parameter that was correlated with H2S C was VR with a negative relationship (p < 0.05). For H2S E, a positive correlation between H2S E and T and a negative relationship between H2S E and RH were found, while no relationship between H2S E and VR was observed. Moreover, significant correlations were also revealed among those climatic parameters, (e.g., Tin versus Tout (r = 0.94, p < 0.01), RHin versus RHout (r = 0.79, p < 0.01)), which strongly suggested the indoor thermal environment of the dairy barn was highly dependent on the outdoor weather. Also, we tried to develop a prediction model for VR based on the independent factors of Tin, Tout, RHin, RHout, difference between Tin and Tout (Tin – Tout), and difference between RHin and RHout (RHin – RHout). The best prediction model for VR was an exponential function based on the difference between Tin and Tout: VR (m3 sec−1) = 36.43 × e −0.084 (Tin – Tout) (R2 = 0.65), or VR (m3 sec−1 AU−1) = 0.22 × e −0.087 (Tin – Tout) (R2 = 0.67), where Tin and Tout are in °C.
Relationship between odor and odorous gases
In line with previous studies (Blanes-Vidal et al., Citation2012; Akdeniz et al., Citation2012b), a significantly positive correlation was found between OC and NH3 C (OC, OU m−3 = 141.3 ln(NH3 C, ppm) + 179.5, R2 = 0.51). On the contrary, no significant relationship was revealed between OC and H2S C (p > 0.05). Gay et al. (Citation2003) reported a moderate correlation between OE and total reduced sulfur emissions (r = 0.51, p < 0.05) and between OE and NH3 E (r = 0.48, p < 0.05) for dairy housing facilities. In this study, it was found that OE was negatively related to NH3 E (r = 0.46, p < 0.01) but not to H2S E (p > 0.05). The results confirmed that NH3 C plays a vital role in predicting OC or OE; however, H2S cannot be an indicator in the absence of other factors.
Multilinear regression model for OE and validation
The multilinear model for OE was regressed as follows:
or
The modeled OE (OEm) from eq 8 and the corresponding observed OE (OEo) are plotted in . The remaining 30% of the data was used for validation. The comparison of predicted OE (OEp) from eq 8 and OEo is presented by . No significant difference in the average results was observed for either group of comparisons (p > 0.05).
Figure 6. Comparison of modeled results and observed results: (a) comparison of OEm and OEo using 70% of the data, and (b) validation using the remaining 30% of the data.
We also used fractional bias (FB) and Pearson correlation, which are two of the general performance measures for paired statistical comparison (ASTM, Citation2014). Significant correlations between the paired results were found for both groups of comparisons (r > 0.88, p < 0.01). The FB was 0.03 for the comparison of OEm and OEo, and –0.03 for the comparison of OEp and OEo, both of which fell into the range of –0.25 < FB < 0.25 (FB = 0 indicates an ideal model) suggested by ASTM (Citation2014). The preceding results indicate the source odor emission model performs satisfactorily.
Conclusion
Diurnal and seasonal variations of odor, NH3, and H2S concentrations were measured for a naturally ventilated free-stall dairy barn in a cold region climate (the Canadian Prairies). With this knowledge, we evaluated indoor air quality and acquired diurnal and seasonal variations of odor, NH3, and H2S emissions, which could be further employed to study the outdoor impact of odor and gases by dispersion modeling and provide relative references for policymakers. Our findings show:
Great diurnal variations of odor and gas concentrations and emissions were observed in all seasons, but especially in the mild season. Overall, higher OC and NH3 C were likely to occur in the early evening from 6:00 to 9:00 p.m., while higher OE and NH3 E were likely to occur in the afternoon when VR was high. Odor, NH3, and H2S concentrations and emissions also showed great seasonal variations, with relatively higher odor and NH3 concentrations in the winter, and higher emissions during the warm and mild seasons.
Considering the additive health effect of NH3 and H2S made a big difference for describing the indoor air quality than only considering individual gases. Based on the health effect of respiratory irritation, indoor air quality was poor and could exceed the exposure limit during the cold season.
Positive relationships were revealed between OC and NH3 C and between OE and NH3 E, which were in agreement with previous studies. Conversely, no relationship between odor and H2S was found. Climatic parameters presented significant, but opposite, effects on OC and OE. The climatic parameters most relevant to OC and OE were Tout with negative influence and VR with positive influence. The prediction model of OE was developed as a multilinear function of VR and RHin, which explained 87% of the data and was validated to be acceptable. Additionally, significant effects of climatic parameters on gas concentrations and emissions were also examined.
Acknowledgment
Special thanks are given to Zhu Gao, Jingjing Han, Shamim Ahamed, and Ali Motalebi for their assistance in field sampling. The authors also appreciate the great help from the workers of the dairy barn.
Funding
The authors thank the Natural Sciences and Engineering Research Council of Canada (NSERC) and the China Scholarship Council (CSC) for their financial support.
Additional information
Funding
Notes on contributors
Dandan Huang
Dandan Huang is a Ph.D. student in the Department of Biological Engineering, University of Saskatchewan, Saskatoon, Canada.
Huiqing Guo
Huiqing Guo is a professor in the Department of Mechanical Engineering, University of Saskatchewan, Saskatoon, Canada.
References
- Arcidiacono, C., S.M.C. Porto, and G. Cascone. 2015. On ammonia concentrations in naturally ventilated dairy houses located in Sicily. Agric. Eng. Int. CIGR J. Special Issue 2015:294–305.
- Akdeniz, N., L.D. Jacobson, B.P. Hetchler, S.D. Bereznicki, A.J. Heber, J.A. Koziel, L. Cai, S. Zhang, and D.B. Parker. 2012a. Odor and odorous chemical emissions from animal buildings: Part 2. Odor emissions. Trans. ASABE 55(6):2335–45. doi:10.13031/2013.42495.
- Akdeniz, N., L.D. Jacobson, B.P. Hetchler, S.D. Bereznicki, A.J. Heber, J.A. Koziel, L. Cai, S. Zhang, and D.B. Parker. 2012b. Odor and odorous chemical emissions from animal buildings: Part 4. Correlations between sensory and chemical measurements. Trans. ASABE 55(6):2347–56. doi:10.13031/2013.42496.
- American Conference of Government Industrial Hygienists. 2010. 2010 TLVs and BEIs: Based on the documentation of the threshold limit values for chemical substances and physical agents & biological exposure indices. Cincinnati, OH: ACGIH Signature Publications.
- Amon, B., T. Amon, J. Boxberger, and C. Alt. 2001. Emissions of NH3, N2O and CH4 from dairy cows housed in a farmyard manure typing stall (housing, manure storage, manure spreading). Nutr. Cycl. Agroecosystems 60(1):103–13. doi:10.1023/A:1012649028772.
- Amon, M., M. Dobeic, R.W. Sneath, V.R. Phillips, T.H. Misselbrook, and B.F. Pain. 1997. A farm-scale study on the use of clinoptilolite zeolite and de-odourase for reducing odour and ammonia emissions from broiler houses. Bioresource Technol. 61(3):229–37.doi:10.1016/S0960-8524(97)00005-9.
- ASTM. 2014. Standard guide for statistical evaluation of indoor air quality models. D5157-97 (reapproved 2014). West Conshohocken, PA: ASTM International. doi:10.1520/D515797R14.
- Blanes-Vidal, V., M.N. Hansen, A.P.S. Adamsen, A. Feilberg, S.O. Petersen, and B.B. Jensen. 2009. Characterization of odor released during handling of swine slurry: Part 1.Relationship between odorants and perceived odor concentrations. Atmos. Environ. 43(18):2997–3005. doi:10.1016/j.atmosenv.2008.10.016.
- Blanes-Vidal, V., H. Suh, E.S. Nadimi, P. Løfstrøm, T. Ellermann, H.V. Andersen, and J. Schwartz. 2012. Residential exposure to outdoor air pollution from livestock operations and perceived annoyance among citizens. Environ. Int. 40:44–50. doi:10.1016/j.envint.2011.11.010.
- Carew, R. 2010. Ammonia emissions from livestock industries in Canada: Feasibility of abatement strategies. Environ. Pollut. 158(8):2618–26. doi:10.1016/j.envpol.2010.05.004
- CEN. 2003. 13725: Air quality determination of odour concentration by dynamic olfactometry. Brussels, Belgium: European Committee for Standardization.
- CIGR [International Commission of Agricultural Engineering]. 2002. 4th Report of working group on climatization of animal houses-heat and moisture production at animal and house levels. International Commission of Agricultural Engineering, Section II. http://www.cigr.org/documents/CIGR_4TH_WORK_GR.pdf (accessed October 1, 2016)
- Copeland, C. 2014. Air quality issues and animal agriculture: A primer. CRS report for Congress, RL32948. Congressional Research Service. http://nationalaglawcenter.org/wp-content/uploads/assets/crs/RL32948.pdf (accessed November 10, 2016)
- Fiedler, M., and H.-J. Müller. 2011. Emissions of ammonia and methane from a livestock building natural cross ventilation. Meteorol. Z. 20(1):59–65. doi:10.1127/09412948/2011/0490.
- Gay, S.W., D.R. Schmidt, C.J. Clanton, K.A. Janni, L.D. Jacobson, and S. Weisberg. 2003. Odour, total reduced sulfur, and ammonia emissions from animal housing facilities and manure storage units in Minnesota. Appl. Eng. Agric. 19(3):347–60. doi:10.13031/2013.13663.
- Government of Canada. 2016. Average size of herds enrolled on milk recording programs. http://aimis-simia-cdic-ccil.agr.gc.ca/rp/index-eng.cfm?action=pR&r=216&pdctc (accessed November 15, 2016).
- Hayes, E.T., T.P. Curran, and V.A. Dodd. 2006. Odour and ammonia emissions from intensive poultry units in Ireland. Bioresource Technol. 97(7):933–9. doi:10.1016/j.biortech.2005.04.024.
- Hobbs, P.J., T.H. Misselbrook, M.S. Dhanoa, and K.C. Persaud. 2000. Development of a relationship between olfactory response and major odorants from organic wastes. J. Sci. Food. Agric. 81(2):188–93. doi:10.1002/1097-0010(20010115)81:2<188::AID-JSFA800>3.0.CO;2T.
- International Panel on Climate Change, 2013. Observations: Atmosphere and surface. In Climate change 2013: The physical science basis, 166–167. Contribution of Working Group I to the Fifth Assessment Report of the Intergovernmental Panel on Climate Change. New York, NY: Cambridge University Press.
- Li, R., D. Liu, E.F. Pedersen, and Q. Zhang. 2014. Effect of climate parameters on air exchange rate and ammonia and methane emissions from a hybrid ventilated dairy cow building.Energy. Build. 82:632–43. doi:10.1016/j.enbuild.2014.07.089.
- Maasikmets, M., E. Teinemaa, A. Kaasik, and V. Kimmel. 2015. Measurement and analysis of ammonia, hydrogen sulphide and odour emissions from the cattle farming in Estonia. Biosyst. Eng. 139:48–59. doi:10.1016/j.biosystemseng.2015.08.002.
- Mosquera, J., J.M.G. Hol, and G.J. Monteny. 2006. Gaseous emissions from a deep litter farming system for dairy cattle. Int. Congr. Ser. 1293: 291–4. doi:10.1016/j.ics.2006.02.041.
- Ngwabie, N.M., K.-H. Jeppsson, G. Gustafsson, and S. Nimmermark. 2011. Effects of animal activity and air temperature on methane and ammonia emissions from a naturally ventilated building for dairy cows. Atmos. Environ. 45(37):6760–8. doi:10.1016/j.atmosenv.2011.08.027.
- Ngwabie, N.M., K.-H. Jeppsson, S. Nimmermark, C. Swensson, and G. Gustafsson. 2009. Multi-location measurements of greenhouse gases and emissions rates of methane and ammonia from a naturally-ventilated barn for dairy cows. Biosyst. Eng. 103(1):68–77. doi:10.1016/j.biosystem-seng.2009.02.004.
- Ni, J.-Q., W.P. Robarge, C. Xiao, and A.J. Heber. 2012. Volatile organic compounds at swine facilities: a critical review. Chemosphere 89(7):769–88. doi:10.1016/j.chemosphere.2012.04.061.
- Rzeźnik, W., P. Mielcarek, and J.L. Jugowar. 2014. The emission of odor from livestock buildings for dairy cattle in Poland. Appl. Eng. Agric. 30(6):961–70. doi:10.13031/aea.30.10684.
- Saha, C.K., C. Ammon, W. Berg, M. Fiedler, C. Loebsin, P. Sanftleben, R. Brunsch, and T. Amon. 2014. Seasonal and diel variations of ammonia and methane emissions from a naturally ventilated dairy building and the associated factors influencing emissions. Sci. TotalEnviron. 468–69(15):53–62. doi:10.1016/j.scitotenv.2013.08.015.
- Samer, M., C. Ammon, C. Loebsin, M. Fiedler, W. Berg, P. Sanftleben, and R. Brunsch. 2012. Moisture balance and tracer gas technique for ventilation rates measurement and greenhouse gases and ammonia emissions quantification in naturally ventilated buildings. Build.Environ. 50:10–20. doi:10.1016/j.buildenv.2011.10.008.
- Schiffman, S.S. 1998. Livestock odours: implications for human health and well-being. J. Anim. Sci. 76(5):1343–55. doi:10.2527/1998.7651343x.
- Schrade, S., K. Zeyer, L. Gygax, L. Emmenegger, E. Hartung, and M. Keck. 2012. Ammonia emissions and emission factor of a naturally ventilated dairy housing with solid floor and an outdoor exercise area in Switzerland. Atmos. Environ. 47:183–94. doi:10.1016/j.atmosenv.20-11.11.015.
- Snell, H.G.J., F. Seipelt, and H.F.A. Van den Weghe. 2003. Ventilation rates and gaseous emissions from naturally ventilated dairy house. Biosyst. Eng. 86(1):67–73.doi:10.1016/S1537-5110(03)00113-2.
- Sun, G., H. Guo, and J. Peterson. 2010. Seasonal odor, ammonia, hydrogen sulfide, and carbon dioxide concentrations and emissions from swine grower-finisher rooms. J. Air. Waste Manage. Assoc. 60(4):471–80. doi:10.3155/1047-3289.60.4.471.
- U.S. Environmental Protection Agency. 2004. National emissions inventory—Ammonia emissions from animal husbandry operations. Draft report.https://www3.epa.gov/ttnchie1/ap42/ch09/related/nh3inventorydraft_jan2004.pdf (accessed October 1, 2016).
- Wang, Y. 2007. Monitoring and modeling of diurnal and seasonal odour and gas emissions from different types of swine rooms (Master’s thesis). University of Saskatchewan, Saskatchewan, Saskatoon, Canada.
- Webb, J., H. Menzi, B.F. Pain, T.H. Misselbrook, U. Dämmgen, H. Hendriks, and H.Döhler. 2005. Managing ammonia emissions from livestock production in Europe. Environ.Pollut. 135(3):339–406. doi:10.1016/j.envpol.2004.11.013.
- Wu, W., G. Zhang, and P. Kai. 2012. Ammonia and methane emissions from two naturally ventilated dairy cattle buildings and the influence of climatic factors on ammonia emissions. Atmos. Environ. 61:232–43. doi:10.1016/j.atmosenv.2012.07.050.
- Yang, Y., W. Liao, X. Wang, C. Liu, Q. Xie, and Z. Gao. 2016. Quantification of ammonia emissions from dairy and beef feedlots in the Jing-Jin-Ji district, China. Agric. Ecosyst.Environ. 232:29–37. doi:10.1016/j.agee.2016.07.016.
- Zhang, G., S.J. Strøm, B. Li, H.B. Rom, S. Morsing, P. Dahl, and C. Wang. 2005. Emission of ammonia and other contaminant gases from naturally ventilated dairy cattle buildings. Biosyst. Eng. 92(3):355–64. doi:10.1016/j.biosy-stemseng.2005.08.002.
- Zhao, L.Y., M.F. Brugger, R.B. Manuzon, G. Arnold, and E. Imerman. 2007.Variations in air quality of new Ohio dairy facilities with natural ventilation systems. Appl. Eng.Agric. 23(3): 339–46. doi:10.13031/2013.22684.
- Zhu, J., L. Jacobson, D. Schmidt, and R. Nicolai. 2000. Daily variations in odor and gas emissions from animal facilities. Appl. Eng. Agric. 16(2):153–8. doi:10.13031/2013.5067.