
ABSTRACT
The basic principle of odor sampling from surface sources is based primarily on the amount of air obtained from a specific area of the ground, which acts as a source of malodorous compounds. Wind tunnels and flux chambers are often the only available, direct method of evaluating the odor fluxes from small area sources. There are currently no widely accepted chamber-based methods; thus, there is still a need for standardization of these methods to ensure accuracy and comparability. Previous research has established that there is a significant difference between the odor concentration values obtained using the Lindvall chamber and those obtained by a dynamic flow chamber. Thus, the present study compares sampling methods using a streaming chamber modeled on the Lindvall cover (using different wind speeds), a static chamber, and a direct sampling method without any screens. The volumes of chambers in the current work were similar, ~0.08 m3. This study was conducted at the mechanical-biological treatment plant in Poland. Samples were taken from a pile covered by the membrane. Measured odor concentration values were between 2 and 150 ouE/m3. Results of the study demonstrated that both chambers can be used interchangeably in the following conditions: odor concentration is below 60 ouE/m3, wind speed inside the Lindvall chamber is below 0.2 m/sec, and a flow value is below 0.011 m3/sec. Increasing the wind speed above the aforementioned value results in significant differences in the results obtained between those methods. In all experiments, the results of the concentration of odor in the samples using the static chamber were consistently higher than those from the samples measured in the Lindvall chamber. Lastly, the results of experiments were employed to determine a model function of the relationship between wind speed and odor concentration values.
Implications: Several researchers wrote that there are no widely accepted chamber-based methods. Also, there is still a need for standardization to ensure full comparability of these methods. The present study compared the existing methods to improve the standardization of area source sampling. The practical usefulness of the results was proving that both examined chambers can be used interchangeably. Statistically similar results were achieved while odor concentration was below 60 ouE/m3 and wind speed inside the Lindvall chamber was below 0.2 m/sec. Increasing wind speed over these values results in differences between these methods. A model function of relationship between wind speed and odor concentration value was determined.
Introduction
The Polish Committee for Standardization PN-EN 13725 air quality standard (2007) does not clearly defined the method of sampling air from the surface diffusion sources for the determination of odor concentration by dynamic olfactometry. This part of that standard is limited to a general description of sampling and the transport materials, as well as methodology of filling containers. However, difficulties arise when sampling from different surface diffusion sources because of their size, shape, and required operating parameters, raising the need for specific guidelines for the design of sampling equipment, which the standard lacks. The authors only recommend that the materials used for equipment production must meet specific requirements (PCS, 2007). Due to the lack of specific guidelines for sampling, the results obtained by the dynamic olfactometry method may vary from the same diffusion source when different sampling devices are used (Navaratnasamy et al., Citation2004; Bokowa and Liu, Citation2008; Hudson and Ayoko, Citation2008; Hudson et al., Citation2009). In present work, various methods of sampling from diffusion sources were compared. In particular, examination of the waste heaps on the mechanical-biological treatment (MBT) plant in Poland, was carried out.
The surface sources of odorants can be divided into active and passive. Active sources are characterized by a minimum flow of 50 m3/m2-hr and include, above all, biofilters (Richter and Frechen, Citation2009). Hood devices, used for sampling from area sources, are typically made of polyethylene with a thickness of 0.10 or 0.15 mm. Inter alia, pyramid-shaped covers with a surface area of 1 m2 are used, which are equipped with outlet pipes with diameters of 0.14–0.2 m and a length of at least 10 times that of the diameter. A port for air sampling is placed in the middle of the exhaust pipe, at a height of at least 5 times that of the diameter (Richter and Frechen, Citation2009).
The passive sources are characterized by a laminar flow. These sources are either not ventilated or have poor ventilation with a minimum flow of less than 50 m3/m2-hr (Richter and Frechen, Citation2009). Passive sources include, inter alia, excessive settling tanks on sewage treatment plants, couloirs, compost heaps, and aerated and nonaerated sludge tanks. To determine the emission factors of odorants for passive area sources, two different approaches can be used (Hudson and Ayoko, Citation2008). The first method is based on making indirect measurements using micrometeorology methods, whereas the second approach is based on the method of dynamic hood sampling devices (Capelli et al., Citation2013). The basic principle is based primarily on knowing the amount of air drawn from the dome covering a specific area of the malodorous compounds source.
Devices used for sampling from passive sources include flow chambers modeled on the Lindvall cover, static flow chambers, and dynamic flow chambers. Representative samples are collected at the outlet of the cover. The static chambers are sealed domes with an open base, which are placed over the source of the odorants. To obtain representative data across the surface source, it is important to sample from different points that are equally spaced on the surface of the emitter. It is assumed that area from which a single sample is taken should represent about 1% of the total area of the emitter (Belgiorno et al., 2013). A drawback of these devices is that the pressure prevailing under the chamber is often different from the pressure outside, which may lead to errors, due to the fact that there is a relationship between the pressure source and the surface emission surface (Frechen et al., Citation2004). In the flow chambers, clean air (directly from the bottle, or purified through a carbon filter) is supplied with a fixed flow. Under the cover of the chamber, the clean air is mixed with the fragrant air. In addition, some of the dynamic flow chambers comprise components for mixing air inside the dome (Gostelow et al., Citation2003).
Streaming chambers modeled on the Lindvall cover—tunnels—are primarily used to collect samples from passive sources. The ratio of the longer chamber edges to shorter edges should be at least 2:1 (Frechen et al., Citation2004). The wind tunnel provides a controlled environment that can be replaced, so that small differences in emission can be measured with statistical significance (Sommer and Misselbrook, Citation2016). This system is based on the assumption that the innate character of the flow, which is encountered at the air/soil/water boundary, can be simulated under the cover. Smith and Watts (Citation1994) observed that the odor concentration obtained by longer and narrower chambers was about 20% lower than that obtained using the smaller chambers. This is likely due to the fact that increasing the volume of the chamber results in a reduced number of stagnant zones as well as turbulent zones. However, the increased volume also limits the sampling surface (Jiang et al., Citation1995).
Frechen et al. (Citation2004) and Capelli et al. (Citation2009) suggested that it is reasonable to make measurements at low wind speeds inside the tunnel (1–10 cm/sec). Hobson and Yang (Citation2001) found that to get the most reliable results, the speed of the air inside the Lindvall chamber should be kept at the level of 0.2–0.3 m/sec, since the flow rate and odor concentration measured at the chamber outlet are important parameters to determine the level of odor. Liu et al. (Citation2015, Citation2016), after examination of the emission rates of volatile organic compounds with sweeping velocity inside wind tunnel from 0.1 to 1.07 m/sec, suggested that 0.28 m/sec is the recommended practical operation wind speed value. The linear correlation was obtained between the sweeping velocity and emission rates when wind speed values were less than 0.5 m/sec. Di Petra et al. (Citation2016) compared wind tunnels with perforated plates inside chamber, guide vanes, wire gauses, and guide channels. Those researchers demonstrated that tunnels with guide channels represent the best solution among them, without using a main chamber longer than 1 m. Wind speed inside tunnel could be even up to 5 m/sec (di Petra et al., 2006).
The discrepancy between the results obtained from samples taken using the flow cells may be the effect of factors such as the small area of the chamber surface, change of flow turbulence as compared with natural conditions, and insufficient mixing of the clean and polluted air (Smith and Watts, Citation1994). It is advantageous that chambers without forced airflow shall not be applied to aerated tanks (Bockreis and Steinberg, Citation2005), due to the fact that in liquid sources with forced air as well as mixed sources, the turbulences of the liquid are large. Furthermore, the air under the dome can quickly saturate the odorants. These devices are primarily used to collect highly volatile compounds, such as hydrogen sulfide (H2S) and other sulfur compounds (Leyris et al., Citation2005). When the odor concentration is greater than 100–200 ouE/m3, tunnels are best suited for surface sources (Zarra et al., Citation2013).
Parker et al. (Citation2013) wrote that according to long-standing debate (Fowler et al., Citation2001; Blanes-Vidal et al., Citation2007; Cole et al., Citation2007; Acevedo at al., Citation2009; Hudson et al., Citation2009), and despite their shortcomings, wind tunnels and flux chambers often are the only available, direct methods of evaluating the fluxes from small area sources. Furthermore, there are still no widely accepted chamber-based methods, and there is still a need for standardization to ensure full comparability of these methods.
Materials and methods
Object of research
The object of the current research was the installation of the mechanical-biological treatment plant—the regional municipal waste processing facility in Poland. Its total capacity is 920 Mg/day (230,000 Mg of processed municipal solid waste per year). Regarding the biological component, on the open square, aerobic stabilization of organic fraction of the waste is performed on piles 44 m long, 6 m wide, and 2.5 m high. They are actively aerated and are covered with a semipermeable (vapor-permeable) membrane. Each of the piles is equipped with three aeration channels and a channel for the leachate collection. A computer unit controls the fan that aerates the piles to minimize the possibility of anaerobic zone formation. The process continues until reaching the 4-days respiration activity (AT4) ratio of less than 10 mg O2/g of dry mass, which lasts for 5–9 weeks.
Characteristics of the materials
Scentroid SM 100 (Ontario, Canada) is a field olfactometer, using compressed air from the cylinder under high pressure (31 MPa) to dilute the test sample. The apparatus consists of a dilution valve control. Its high accuracy is used to provide a constant flow of diluted air through the device, which allows the user to select one of the 15 positions, which correspond to ratios of clean air to the dilution of the test air sample. The range of the device is between 2 and 30,000 ouE/m3; the detection limit of the olfactometer is 3 ouE/m3.
The measurement of wind speed and direction was made using a hand anemometer Kestrel 4500 NV with a wing rotor, whereas the measurement of temperature and relative humidity was carried out using the psychrometer Rotronic HygroPalm sensor HygroClip2 HC2-S3.
The Scentroid wind tunnel is a device modeled after the Lindvall chamber, which is composed of a set consisting of a Lindvall chamber, air blower, and carbon filter to ensure an odorless air supply to the system. The air blower allows the force of wind speed under the cover in the range of 0.13–0.66 m/sec, for a continuous operation time of 1.5 hr. The Scentroid wind tunnel device allows for the measurement of emission from liquid or solid surface sources and meets the standards specified in the standards The Association of German Engineers VDI 3880, European Committee for Standarization EN 13725, and Standards Australia/Standards New Zealand Commitee AS/NZS 4323. Its dimensions are as follows: length: 167 cm, width: 33 cm, height: 23 cm without fixed floats, weight: 10 kg. The static chamber used for the static test was made of an odorless material and has the shape of a truncated cone with bases of 18 and 28 cm diameters. The height is 45 cm, topped with a 5-cm nozzle with a 5-cm diameter. The chambers have similar active volumes (volume of the air column over the tested surface): the volume of Lindvall chamber is 0.078 m3, whereas the volume of static chamber is 0.075 m3. Background odor of sampling is one of the main limiting factor for measuring odor concentration. The equipment used in this study is made of stainless steel, which produces zero background odor and is easily decontaminated. Only virgin polytetrafluoroethylene (PTFE) tubing was used for both sampling and clean air delivery. Also, pure, technical air was cleaned by a carbon filter to achieve “odorless” medium and avoid background odor. The instrument used in this study has a lower dilution of 2 and employs only PTFE and stainless steel surfaces, making it easy to decontaminate to nearly zero background odor. Also, background odor is intended as the odor of the sampling site itself. The examined methods are based on the principle of isolation of a portion of the polluted air and measurement of the odor concentration at the outlet. It should be noted that the sampling isolates the background odors, and, in fact, the detection threshold of this type of sampling could be less than the background odors already present in the environment. The wind tunnel was equipped with the carbon filter to ensure an odorless air supply to the system and elimination of the background (environmental) odor.
Methodology
Tests were performed on piles located on the MBT installation. The interval between the series was a maximum 7 days, and the complete cycle lasted 7 weeks, starting from the dump of the pile and covering the geomembrane until completing the biostabilization (removal of waste to a landfill). Samples were taken from five places on the plateau of the piles (corners and geometric center). Sampling of air emitted from the surface sources of odorants was carried out as follows:
Using a Lindvall chamber with the wind speed at the outlet of the Lindvall cover—from 0 to 5.00 m/sec (wind tunnel air speed between 0 and 0.66 m/sec) as well as such external wind speed
Using a static chamber
directly, without using chambers
For each test, from the time of setting the static chamber as well as initiating the flow of air inside the Lindvall chamber and the measurements, 10 min were needed to equalize, respectively, pressure and airflow. Samples were taken from a distance of approximately 10 cm above the membrane. In the case of the Lindvall cover, the sampling point was in the center of the outlet section of the chamber when the air speed measured in the outflow was between 1 and 5 m/sec, and in the center of the top basis of chamber when the value of wind speed was 0 m/sec. The total number of tested samples was 1175.
Calculation
Comparing the results, the analysis of variance was performed to assess the impact of an independent, qualitative factor—the sampling method—on the distribution of the dependent variable—the odor concentration.
To determine whether the data came from a normal distribution, the Shapiro-Wilk statistical test was selected. This test can be used for small samples. Furthermore, it was chosen because the χ2 test and the Kolmogorov test do not use the full range of information resulting from the sample. In addition, a modified Kolmogorov-Smirnov test (Anderson-Darling test) was considered, in which the critical values depend on the specific distribution (Dodge, Citation2010). Therefore, this test is more sensitive to the shape of the “tails” of the distribution. It was recognized that the Shapiro-Wilk test, because of its power, is the most appropriate for this study. One of the basic assumptions in the analysis of variance is the homogeneity of variance in groups. To verify the hypothesis of equal variance in all populations, Bartlett’s test was employed, the most commonly used test, which concerns the variance of k normal populations, N(µi, σi2). The Bartlett test is very sensitive to deviations from the normal distribution, so two additional tests were performed: the Flinger-Killeen test (more resistant to outliers) and the Levene test. Although the analysis of variance answers the questions of whether or not the group means differ, it does not indicate which of them are significantly different. Therefore, after rejecting the null hypothesis, a detailed post hoc test was performed. Among post hoc tests, the honestly significant difference (HSD) Tukey test was chosen.
Additionally, the method of the one-dimensional spline curves had been used, which is considered to be an additive model (Hastie et al., 2001):
where X is explanatory variable, Y is dependent variable, α is a direction of projection, and fk is the degree of polynomials. This method consists of dividing the domain of X into K disjointed intervals using a structured set of points, called nodes:
To observe the values belonging to each interval [ξk−1, ξk] (for k = 1, …, K), where ξ0 is the smallest of the variable X and ξK the highest, the function fk is adjusted, using the classical least squares method. In the splines method, it is assumed that the sought functions fk are constants:
where
Due to the potential discontinuity of f, the degree of polynomials fk was increased and conditions of continuity at the nodes and related functions were imposed. Hastie et al. (2001) has shown that such a modified-order spline function of order M can be represented as a linear combination of the basis functions h:
and
where l = 0, …, M; k = 1, …, K − 1; and
In the issue of spline functions, a commonly used parameter is the number of degrees of freedom, df, which equals the number of base functions. Most often, the spline functions of the third order (cubic splines) are used, so spline third-order function with K − 1 nodes, ξk, can be represented by the basic functions as follows:
The strength of the correlation relationship between variables was determined using the Spearman correlation coefficient. The choice of the applied factor was based on the type of features, the number of observations, and the shape of the relationship. The linear Pearson’s correlation coefficient was rejected a priori because it is sensitive to the sample variability, especially for small samples. Therefore, for the examined population, it was decided that the better test would be the Spearman correlation coefficient, which is used to describe the strength of correlation features when they are measurable, qualitative, and the tested community is small.
The correlation coefficient is in the range of −1 to 1. These results were visualized by the so-called “heatmaps.” This is a visualization of the matrix of numbers, in which the numerical value of the cell matrix is shown in a color (or shade of the color).
Results
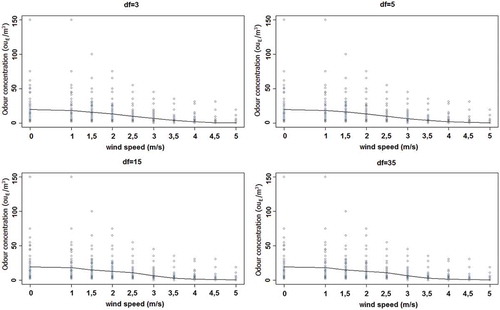
contains the means and standard deviations of odor concentration values achieved using different sampling methods. The results show that there is a difference between odor concentration values obtained in separate sampling methods, as well as during increases in the wind speed in the Lindvall chamber. In particular, the odor values decrease with increasing wind speed in the Lindvall chamber outlet. The difference between the mean of the odor concentration with wind speeds in the outlet of 1 and 5 m/sec is 18.2 ouE/m3. Results are visualized in , which contains box plots of the data, whereas contains a graph of spline functions for different values of degrees of freedom, df.
Table 1. Means and standard deviations of odor concentration values achieved using different sampling methods.
Figure 1. Box plots of odor concentration values achieved using different sampling methods.
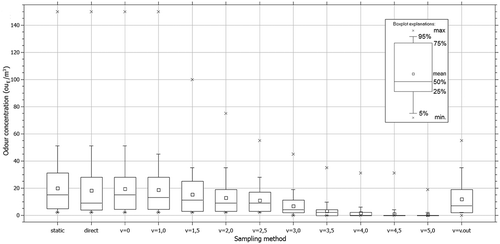
Figure 2. Graphs of spline functions of wind speed and odor concentration relations for different values of df.
contains the parameters of regression curves representing the relationship between odor concentration values measured using a static chamber and of the other sampling methods.
Table 2. Parameters of regression curves showing the relationship between odor concentration values obtained using the static chamber and the other sampling methods.
contains results of variance analysis of odor concentration values achieved using different sampling methods.
Table 3. Results of the variance analysis of odor concentration values achieved using different sampling methods.
Further, the value of F-test statistic is 75.454, so according to the probability test, the zero hypothesis is rejected in favor of the alternative hypothesis; thus, the odor concentration values are dependent on the sampling method.
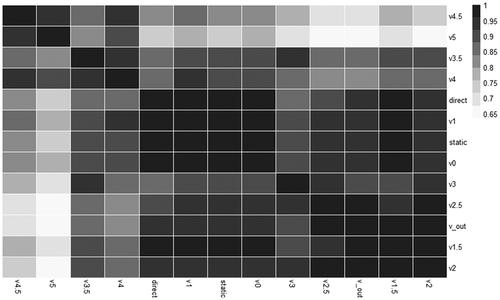
Importantly, to determine which of the above results differ significantly from each other, a post hoc Tukey test was performed. Additionally, Pearson’s correlation matrix heat map was performed ().
Figure 3. Pearson’s correlation matrix heat map.
Discussion
Many researchers have previously compared the odor concentration values obtained with the Lindvall chamber and those with a dynamic flow chamber (Hudson and Ayoko, Citation2008). In particular, they have studied the concentration of odor coming from the effluents from livestock farms and feed lot (wet and dry). Amongst these studies, Bokowa and Liu (Citation2008) compared the results of the odor concentration of samples taken from two locations, using the previously mentioned devices, whereas Navaratnasamy et al. (Citation2004) compared both devices while examining various concentrations of butanol.
With respect to chambers, Hudson et al. (Citation2009) compared a wind tunnel and U.S. Environmental Protection Agency (EPA) dome-type flux chamber (Kienbusch, 1986) to assess odor emissions and proved that wind tunnel emission rates were 60–240 times greater than those found in the flux chamber.
The results obtained by Hudson and Ayoko (Citation2008), who examined leachates from animal production and farm fattening units, were 4–8 times smaller when the sampling was performed using a Lindvall chamber (from 51 to 469 ouE/m3) than when the samples were obtained using the intake flow chamber (from 406 to 3360 ouE/m3). Those obtained by Bokowa and Liu (Citation2008) were 11 times smaller (Lindvall chamber: 709–845 ouE/m3, intake flow chamber: 14760–23840 ouE/m2), whereas those obtained by Navaratnasamy et al. (Citation2004) were 3–6 times lower (Lindvall chamber: 30–502 ouE/m3, intake flow chamber: 30–1644 ouE/m3). In addition, Leyris et al. (Citation2005) compared methyl sulfate concentrations in the samples obtained via the previously mentioned types of chambers with different airflows. In those cases, the results of concentrations of collected samples using a dynamic flow chamber were larger than those obtained using the Linvall chamber (differences between odor concentration values were from 2.7% to 106.7%), except for samples containing methyl sulfate concentrations of 100 mg/dm3 (flow rate 5 m/sec) and 550 mg/dm3 (flow rate 3 m/sec). The difference between odor concentrations in the samples obtained through both Lindvall and static chambers from the present studies are summarized in .
Table 4. Comparison of odor concentration values in the samples obtained through two types of chambers (Lindvall; static) with different airflow in the outflow of Lindvall chamber.
Lucernoni et al. (Citation2017) compared the odor emission rates achieved by wind tunnel and flux chamber and reported that measurements carried out with wind tunnel gave emission value of 248,050 ouE/sec, whereas with flux chamber it was 6150 ouE/sec. Parker et al. (Citation2013) compared the sampling methods of collecting the following five compounds from the surface source: phenol, 4-methylphenol, 4-ethylphenol, indole, and skatole. The results were corrected with the coefficients for either the Lindvall chamber or the dynamic flow chamber, respectively, 3.84 and 2.42. The evaporative flux ratio correction was calculated as Iout/Iin, where I represents the flux (µg m−2 min−1). The researchers conducting the study observed considerable variation in uncorrected fluxes between the dynamic flow chamber and the wind tunnel. In particular, there were differences of 61%, 57%, 56%, 53%, and 49% between the measurements for, respectively, phenol, 4-methylphenol, 4-ethylphenol, indole, and skatole. After the evaporative ratio correction factors were applied, the differences dropped to, respectively, 17%, 13%, 12%, 9%, and 4%. Thus, Parker et al. (Citation2013) proved that corrected flux values are more precise and more accurate than uncorrected flux values. In the present work, comparing the results of static and Lindvall chambers, the smallest difference is between odor concentration values in the static chamber and the wind speed in the outflow of Lindvall chambers, equivalent to 0, 1, and 1.5 m/sec. The R2 values are, respectively, 0.995, 0.987, and 0.965, whereas when the wind speed is 5.0 m/sec, the R2 value is 0.570. Although there is no significant difference between the odor concentration values obtained by direct sampling (without any chamber) and the condition when wind speed in the outlet of the Lindvall chamber equals 0, there is a difference between direct sampling and when the wind speed in the outlet of Lindvall chamber is the same as the wind speed of the outdoor air; here, the percentage difference in the results varies by 34.25%. Means and standard deviations of odor concentration values achieved using different sampling methods between static, direct, and Lindvall chamber method are comparable when the maximum value of wind speed in the wind tunnel outlet is 1 m/sec. There are statistically significant differences when that value is higher than 1 m/sec. Also, the values of the third quartile (75%) of the odor concentration are the same in case of direct sampling, wind tunnel speed 0 and 1 m/sec. There is also a perfect positive linear relationship (correlation coefficient value = 0.99) between odor concentration values achieved by a static method and those two values of wind speed. While wind speed value is 0.2 m/sec, that correlation coefficient value is 0.95, whereas in case of wind speed equals 5 m/sec, the correlation coefficient equals 0.75. According to the graphs of spline functions for different values of degrees of freedom, df, the highest coefficient of determinations were achieved for df = 5. In that case, the coefficient of determination R2 = 0.996, adjusted coefficient of determination R2adj. = 0.989, and single smoothing parameter = 0.19, which gives a cubic spline interpolation of the data. So, the fitted function formula was Y = 23.0 − 9.15 X + 14.09 X2 − 8.723 X3 + 1.91 X4 − 0.14 X5.
Conclusion
Several researchers have demonstrated that there is a significant difference between odor concentration values obtained by the Lindvall chamber and by a dynamic flow chamber when concentration values are between 30 and 23 8640 ouE/m3. The main objective of the present study was to compare sampling methods using a chamber modeled after the Lindvall chamber (using different wind speeds), a static chamber, and a direct sampling method in the MBT plant. Odor concentration values from the plant were between 2 and 150 ouE/m3. Also, the second objective was to examine the differences of the achieved odor concentration values while increasing of the wind speed inside the wind tunnel. Volumes of the chambers employed were similar at ~0.08 m3. The author showed that both chambers can be used interchangeably in these conditions: odor concentration is below 60 ouE/m3 and wind speed in the Lindvall chamber outlet is between 0 and 1.5 m/sec, and the speed inside the chamber is below 0.2 m/sec with a flow below 0.011 m3/sec. Also, a model function of the relationship between wind speed and odor concentration values was determined. By increasing the wind speed above those values, there were significantly different results between those methods. In each of the cases, the odor concentration values from the samples taken using the static chamber were higher than those obtained in samples taken by Lindvall chamber.
Supplementary data
Download MS Word (16.6 KB)Additional information
Notes on contributors
Mirosław Szyłak-Szydłowski
Mirosław Szyłak-Szydłowski, DSc. is a research scientist and academic teacher in the the Faculty of Building Services, Hydro and Environmental Engineering at Warsaw University of Technology, Warsaw, Poland.
References
- Acevedo, R., H. Li, H. Xin, and S. Roberts. 2009. Evaluation of a flux chamber for assessing gaseous emissions and treatment effects of poultry manure. In Proceedings Annual International Meeting of the American Society of Agricultural and Biological Engineers, Reno, NV, June 21–24, 2009, Paper No. 09-6362. St. Joseph, MI: American Society of Agricultural and Biological Engineers.
- Blanes-Vidal, V., P.A. Topper, and E.F. Wheeler. 2007. Validation of ammonia emissions from dairy cow manure estimated with a non-steady-state, recirculation flux chamber with whole-building emissions. Trans. ASABE 50:633e640.
- Bockreis, A., and I. Steinberg. 2005. Measurement of odour with focus on sampling techniques. Waste Manage. 25:859–63. doi:10.1016/j.wasman.2005.07.013
- Bokowa, A.H., and H. Liu. 2008. Techniques for odour sampling of area and fugitive sources. Chem. Eng. Trans. 15:57–62.
- Capelli, L., S. Sironi, R. Del Rosso, and P. Centola. 2009. Design and validation of a wind tunnel system for odour sampling on liquid area sources. Water Sci. Technol. 59:1611–20. doi:10.2166/wst.2009.123
- Capelli, L., S. Sironi, R. Del Rosso, and J.-M. Guillot. 2013. Measuring odours in the environment vs. dispersion modelling: A review. Atmos. Environ. 79:731–43. doi:10.1016/j.atmosenv.2013.07.029
- Cole, N., R. Todd, D. Parker, and M. Rhoades. 2007. Challenges in using flux chambers to measure ammonia emissions from simulated feedlot pen surfaces and retention ponds. In Proceedings International Symposium on Air Quality and Waste Management for Agriculture, Broomfield, CO, September 16–19. St. Joseph, MI: American Society of Agricultural and Biological Engineers.
- di Petra, E.S., M.A. Agizza, G. Sorrentino, L. Boccia, and S. Pindozzi. 2016. Study of aerodynamic performances of different wind tunnel configurations and air inlet velocities, using computational fluid dynamics (CFD). Comput. Electron. Agric. 125:137–48.
- Dodge, Y. 2010. The Concise Encyclopedia of Statistics. London: Springer.
- Fowler, D., M. Coyle, C. Flechard, K. Hargreaves, E. Nemitz, R. Storeton-West, M. Sutton, and J.-W. Erisman. 2001. Advances in micrometeorological methods for the measurement and interpretation of gas and particle nitrogen fluxes. Plant Soil 228:117–29. doi:10.1023/A:1004871511282
- Frechen, F., M. Frey, M. Wett, and C. Loser. 2004. Aerodynamic performance of a low-speed wind tunnel. Water Sci. Technol. 50:57–64.
- Gostelow, P., P. Longhurst, S.A. Parsons, and R.M. Stuetz. 2003. Sampling for Measurement of Odours. Scientific and Technical Report 17. London, UK: IWA Publishing.
- Hobson, J., and G. Yang. 2001. Odour Control in Wastewater Treatment. UK Water Industry Ltd. Report. London, UK: UK Water Industry Research.
- Hudson, N., and G.A. Ayoko. 2008. Odour sampling. 2. Comparison of physical and aerodynamic characteristics of sampling devices: A review. Bioresour. Technol. 10:3993–4007. doi:10.1016/j.biortech.2007.03.043
- Hudson, N., G.A. Ayoko, M. Dunlop, D. Duperouzel, D. Burrell, and K. Bell. 2009. Comparison of odour emission rates measured from various samples using two sampling devices. Bioresour. Technol. 1:118–24.
- Jiang, K., P.J. Bliss, and T.J. Schulz. 1995. The development of a sampling system for determining odor emission rates from areal surfaces: Part I. Aerodynamic performance. J. Air Waste Manage. Assoc. 45:919–22. doi:10.1080/10473289.1995.10467431
- Leyris, C., J. Guillot, J. Fanlo, and L. Pourtier. 2005. Comparison and development of dynamic flux chambers to determine odourous compound emission rates from area sources. Chemosphere 59:415–21.
- Liu, Y., W. Lu, H. Guo, Z. Ming, C. Wang, S. Xu, Y. Liu, and H. Wang. 2016. Aromatic compound emissions from municipal solid waste landfill: Emission factors and their impact on air pollution. Atmos. Environ. 139:205–13.
- Liu, Y., W. Lu, D. Li, H. Guo, L. Caicedo, C. Wang, S. Xu, and H. Wang. 2015. Estimation of volatile compounds emission rates from the working face of a large anaerobic landfill in China using a wind tunnel system. Atmos. Environ. 111:72–83. doi:10.1016/j.atmosenv.2015.04.017
- Lucernoni, F., L. Capelli, and S. Sironi. 2017. Comparison of different approaches for the estimation of odour emissions from landfill surfaces. Waste Manage. 63:345–53.
- Navaratnasamy, M., J.J.R. Feddes, and I.K. Edeogu. 2004. Comparison of wind tunnel and vented flux chamber in measuring odour emission rates. In Proceedings of ASAE/CSAE Annual International Meeting, Ottawa, Ontario, 2 August, 1–8. St. Joseph, MI: American Society of Agricultural Engineers.
- Parker, D., J. Ham, B. Woodbury, L. Cai, M. Spiehs, M. Rhoades, S. Trabue, C. Casey, R. Todd, and A. Cole. 2013. Standardization of flux chamber and wind tunnel flux measurements for quantifying volatile organic compound and ammonia emissions from area sources at animal feeding operations. Atmos. Environ. 66:72–83. 2007.
- Polish Committee for Standardization (PCS). 2007. PN-EN 13725. Determination of Odour Concentration by Dynamic Olfactometry. Air Quality Standard. Warsaw, Poland, PCS.
- Richter, C.J., and F.B. Frechen. 2009. Sampling for olfactometric measurement: The new VDI guideline 3880. In Odour and VOCs: Measurement, Regulation and Control, ed. F.B. Frechen, 129–38. Kassel, Germany: Wasser-Abwasser-Umwelt.
- Smith, R.J., and P.J. Watts. 1994. Determination of odour emission rates from cattle feedlots: Part 1. A review. J. Agric. Res. 57:145–55.
- Sommer, S.G., and T.H. Misselbrook. 2016. A review of ammonia emission measured using wind tunnels compared with micrometeorological techniques. Soil Use Manage. 32:101–8. doi: 10.1111/sum.2016.32.issue-S1
- Zarra, T., V. Naddeo, and V. Belgiorno. 2013. Estimation of emission rate. In Odour Impact Assessment Handbook, ed. V. Belgiorno, V. Naddeo, and T. Zarra, 50–8. Chichester, UK: Wiley.