
ABSTRACT
With utility-scale photovoltaic (PV) projects increasingly developed in dry and dust-prone geographies with high solar insolation, there is a critical need to analyze the impacts of PV installations on the resulting particulate matter (PM) concentrations, which have environmental and health impacts. This study is the first to quantify the impact of a utility-scale PV plant on PM concentrations downwind of the project site. Background, construction, and post-construction PM2.5 and PM10 (PM with aerodynamic diameters <2.5 and <10 μm, respectively) concentration data were collected from four beta attenuation monitor (BAM) stations over 3 yr. Based on these data, the authors evaluate the hypothesis that PM emissions from land occupied by a utility-scale PV installation are reduced after project construction through a wind-shielding effect. The results show that the (1) confidence intervals of the mean PM concentrations during construction overlap with or are lower than background concentrations for three of the four BAM stations; and (2) post-construction PM2.5 and PM10 concentrations downwind of the PV installation are significantly lower than the background concentrations at three of the four BAM stations. At the fourth BAM station, downwind post-construction PM2.5 and PM10 concentrations increased marginally by 5.7% and 2.6% of the 24-hr ambient air quality standards defined by the U.S. Environmental Protection Agency, respectively, when compared with background concentrations, with the PM2.5 increase being statistically insignificant. This increase may be due to vehicular emissions from an access road near the southwest corner of the site or a drainage berm near the south station. The findings demonstrate the overall environmental benefit of downwind PM emission abatement from a utility-scale PV installation in desert conditions due to wind shielding. With PM emission reductions observed within 10 months of completion of construction, post-construction monitoring of downwind PM levels may be reduced to a 1-yr period for other projects with similar soil and weather conditions.
Implications: This study is the first to analyze impact of a utility photovoltaic (PV) project on downwind particulate matter (PM) concentration in desert conditions. The PM data were collected at four beta attenuation monitor stations over a 3-yr period. The post-construction PM concentrations are lower than background concentrations at three of four stations, therefore supporting the hypothesis of post-construction wind shielding from PV installations. With PM emission reductions observed within 10 months of completion of construction, postconstruction monitoring of downwind PM levels may be reduced to a 1-yr period for other PV projects with similar soil and weather conditions.
Introduction
Photovoltaic (PV) deployments are increasing worldwide to meet climate goals, reduce the reliance on electricity derived from fossil fuels, and avoid the associated global warming impacts (Fthenakis and Kim, Citation2011; U.S. Department of Energy, Citation2012; Ravikumar, Citation2013, Citation2016; International Energy Agency, Citation2014; Ravikumar et al., Citation2014, Citation2017). Annual utility-scale PV installations (>1 MWp capacity) in the USA have grown from 310 to 3950 MWp from 2010 to 2014 (Solar Energy Industries Association, Citation2015), as they are economically favorable when compared with other models of PV deployments (Goodrich et al., Citation2012). Although outperforming conventional fossil-fuel electricity sources in multiple impact categories (Fthenakis et al., Citation2008; (Fthenakis and Kim, Citation2010; Desideri et al., Citation2012; National Renewable Energy Laboratory [NREL], Citation2012), the environmental performance of large-scale utility-scale PV plants requires environmentally responsible land management and installation practices to increase land use efficiencies (Hernandez et al., Citation2014), reduce potential wildlife impacts (Lovich and Ennen, Citation2011), minimize impacts on local flora (Pocewicz et al., Citation2011; Guerin, 2017), and decrease soil erosion by minimizing land modification in drylands (Belnap et al., Citation2011). The environmentally responsible practices in PV installation sites with hydrological and topographical constraints includes the disk-and-roll technique that does not change the existing drainage patterns and macro-level topography (First Solar, Citation2016). For installation sites without hydrological and topographical constraints, the mowing technique is preferable to traditional land grading, as this leaves the root structure of grasses and other species intact and thereby decreases soil erosion. Furthermore, for the utility-scale PV project analyzed in this work, water was used for dust control along with biodegradable palliatives when soil and wind conditions were favorable to saltation effects and water proved ineffective. The dust control measures are important, as the project is located in the Mojave Desert where the dominant soil type is aridisols (United States Department of Agriculture, Citation2016a) and this region is a significant dust source in North America (Prospero et al., Citation2002). The particulate emissions from soil disturbance during the PV installation phase, as in other construction projects (Muleski et al., Citation2005; Ketchman and Bilec, Citation2013), can result in negative environmental impacts (Gilchrist and Allouche, Citation2005; Russell and Brunekreef, Citation2009). Studies have linked PM exposure to cardiovascular, respiratory, and reproductive health issues, and PM emissions at the work environment and urban locations pose significant worker and public health and safety risks (Brunekreef and Forsberg, Citation2005; Duvall et al., Citation2008; U.S. Environmental Protection Agency [EPA], Citation2009; Wei et al., Citation2009). To prevent the negative environmental and health impacts, federal, state, and local environmental regulations mandate dust control measures at construction sites (San Joaquin Valley Air Pollution Control District, Citation2004); EPA, Citation2012; Maricopa County, Citation2013). To mitigate environmental and health impacts, project developers implement dust management practices in accordance with regulatory requirements (Guerin, 2017). For example, regulatory requirements for PV project construction in the state of California are managed by the particular air quality district (South Coast Air Quality Management District, Citation2005) in reference to ambient air quality standards (California Air Resources Board, Citation2015) .
Wind-driven dust and PM transportation at a utility-scale solar PV project site occurs in three ways: (i) saltation: movement of particles (~100 μm) by a series of short bounces, which further dislodges more particles along the ground; (ii) creep: rolling and sliding of larger particles (~500 μm) along the ground; and (iii) short- and long-term suspension for particles with a size range of less than ~20 and ~20–70 μm, respectively (Singh, Citation1994); Kok et al., Citation2012). The wind velocity at which the gravitational and interparticle cohesive forces are overcome and saltation or wind erosion is initiated is called the threshold friction velocity (u*) (Shao and Lu, Citation2000). For particles with size greater than 100 μm, u* is directly proportional to the square root of the particle size (Bagnold, Citation1941). The complexity in calculating u* increases for particle sizes smaller than 100 μm, and this is discussed in Greeley and James (Citation1985) and Shao and Lu (Citation2000). For wind velocity greater than this threshold, the rate at which soil particles are dislodged is directly proportional to the cube of the wind speed (Chepil, Citation1945; Morgan, Citation2009). Therefore, a reduction in wind velocities due to shielding effects of built structures will significantly reduce the dust emissions. Rooftop- and ground-mounted PV deployments have demonstrated wind-shielding effects in field conditions and in simulations where wind velocity at back row of panels is lower than that measured at the first row (Chepil, Citation1945; Morgan, Citation2009).
Existing research based on simulations and laboratory-scale wind tunnel studies have analyzed the impacts of dust and wind loads on the performance of PV systems, and wind shielding by PV installations (Chevalier and Norton, Citation1979; Shademan and Hangan, Citation2009); Pavan et al., Citation2011; Ketjoy and Konyu, Citation2014). Although these studies have advanced understanding of the underlying physical processes that can impact the PV electricity generation profile, there has been no comprehensive assessment of the dust mitigating potential of large-scale utility-scale PV installations. Pui et al. (Pui et al., Citation2014) discussed the use of solar PV panels on wind break walls to reduce emissions entering China without presenting any data or preliminary results and proposed further research to evaluate the impact of dust, local weather conditions, electricity storage, and transport requirements for successful deployment of PV panels as wind shields. With no scientific clarity to inform PV industry stakeholders on the dust impacts of PV installation, the current industry practice for post-construction dust monitoring can range from no monitoring requirement to a 3-yr requirement (U.S. Department of the Interior Bureau of Land Management, Citation2010) to an upper bound of 25 yr (full lifetime of the PV installation). This time-based monitoring fails to disaggregate background from project-related dust emissions and differences in dust emissions observed during and after construction. Dust emissions typically increase during the construction phase and decrease with the completion of construction when disturbances to the land stop and due to wind-shielding impacts of PV panels. Therefore, dust emissions can reduce significantly even before the stipulated dust monitoring time frame ends, and extended monitoring requirements can add to the economic cost of PV electricity generation without a measurable health or environmental benefit.
With PV installations being installed across diverse geographical, soil, and wind conditions, there is a critical need to investigate if the wind-shielding properties of PV installations reduces dust and particulate matter (PM) emissions during and after construction. A quantification of a reduction in PM emissions from large utility-scale PV installations can inform environmental regulators and PV project management practices, reduce the monitoring time frame requirements and the associated monitoring costs, and improve the environmental health and safety aspects of future PV deployments in geographies with a high incidence of dust and PM emissions.
To address the above knowledge gaps, this study contains novel research that (1) presents 3-yr PM concentration data from field observations at a 550-MWAC utility PV project; (2) disaggregates construction from post-construction PM data based on the PV project construction timelines; (3) evaluates the hypothesis that utility-scale PV installations in a desert environment can decrease the downwind PM concentration over time through a wind-shielding effect; and (4) demonstrates a reduction in PM concentration levels post installation when compared with background concentration levels.
Materials and methods
Utility photovoltaic project and particulate matter monitoring setup
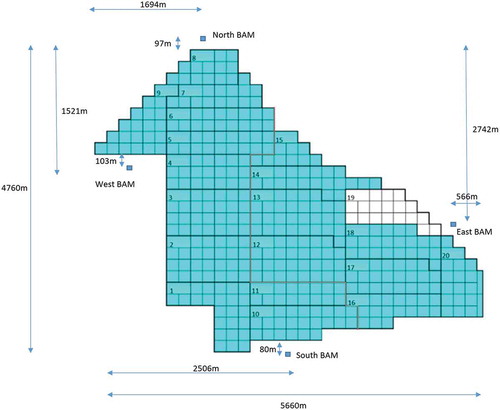
The Desert Sunlight solar project installed a total capacity of 550 MWAC of thin-film cadmium telluride (CdTe) PV systems from September 2011 to November 2014 in Riverside County, California. The project was developed by First Solar and is co-owned by NextEra Energy Resources, GE Energy Financial Services, and Sumitomo Corporation of America and is estimated to displace 300,000 tons of carbon dioxide (CO2) annually (First Solar, Citation2015). The PM data were collected using a beta attenuation monitor (BAM) during and after construction of the PV plant from February 2012 to September 2015. Four BAMs were installed in the north, south, east, and west locations at the edge of the site boundary to record PM concentrations. BAMs were chosen because previous studies have shown them to accurately monitor PM on a real-time basis and meet regulatory requirements (Chung et al., Citation2001; Solomon and Sioutas, Citation2008). The site plan for the project with the locations of the four BAMs is presented in .The PM inlet height for the BAM stations is 1.2 m. The solar panels have dimensions of 1.2 m in length by 0.6 m in width, mounted in a landscape orientation and tilted at 22.5° angle, with four rows of panels in each array. The lower and upper edges of the array are 0.45 and 1.42 m from the ground level. The row-to-row spacing (distance between two consecutive posts on which arrays are mounted) is 4.1 m. The construction proceeded in the south–north direction, with the first block energized on 19 December 2013 and the entire plant operational by 1 December 2014. BAM monitors (Met One Instruments, Citation2015) collected the PM2.5 and PM10 data and co-located weather stations measured wind direction, date, and time (NextEra Energy Resources, Citation2015). The wind direction and PM data were recorded on a minute and an hourly basis, respectively. The wind direction readings in the four BAMs were mapped to sixteen standard directions corresponding to sixteen 22.5° portions in a 360° wind compass. By convention, in this study, the BAM readings represent the direction to which the wind is blowing. For example, the “E” reading in the BAM represents a wind blowing to the east at an angle between 78.25° and 101.25°. This convention, which is opposite that of the standard practice (United States Department of Agriculture, Citation2016b), was chosen to be consistent with the convention used to report the wind direction data recorded by the BAM (NextEra Energy Resources, Citation2015).
Figure 1. Site map showing the PV block numbers and the locations of the four beta attenuation monitors (BAMs) that recorded the PM2.5 and PM10 readings.
The wind direction data were available on a minute-level resolution, and to match them with the hourly PM data, we calculated the average of all the angle values recorded in 1 hr (Section S1 in Supplemental Materials). In cases when wind direction is highly variable, the use of hourly arithmetic mean may mask some of the variability in the underlying wind direction data.
PM data disaggregation
To analyze if PV installations decrease downwind PM concentrations through a wind-shielding impact, the PM readings from the four BAMs ()were separated into three groups: (1) Background: This group includes PM readings when the BAM is upwind of the PV installation. For example, at the north BAM station, the PM readings for the SSE, S, and SSW blowing winds are categorized as background, as these winds blow away from the north BAM station in a north–south direction and are not affected by the PV installation. This group includes the readings for all the days for which PM readings are recorded by the BAM. (2) Construction: This group includes PM readings when the BAM is downwind of the PV installation. For example, at the north station, the PM readings for the NNE, N, and NNW blowing winds are categorized as construction, as these winds blow towards the north BAM station in a south–north direction and are affected by the PV installation (see ). The construction group includes only those PM readings through the last day of construction, 30 November 2014. (3) Post-construction: PM readings were included in this group based on the same conventions used in the construction group (BAM downwind of PV installation). PM readings were included from 1 December 2014, as this corresponds to the start of full operation after completion of construction.
Table 1. Sample sizes, means, and standard deviations for the three groups of PM2.5 and PM10 concentration readings at the four BAM stations.
The conventions used for the wind directions and the corresponding categorization of background, construction, and post-construction of PM readings at each of the four BAM stations are summarized in Section S2 in Supplemental Materials).
Statistical analysis of particulate matter concentration
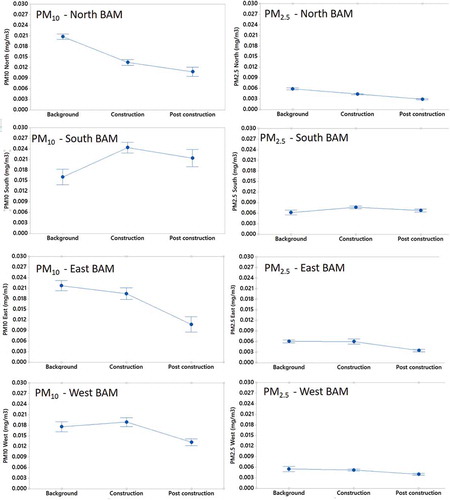
To investigate if the PM concentrations decreased after PV system installations, this study initially considers a time-series analysis of the construction and post-construction readings from February 2012 to September 2015. A linear trend line was generated for the construction and post-construction PM2.5 and PM10 data (). The objective of the temporal analysis is to evaluate the expectation that as the PV installation progresses, wind velocities can be reduced due to shielding effects of the built structures, resulting in lower downwind PM concentrations. To more quantitatively evaluate this hypothesis, a statistical comparison of grouped data has been conducted using confidence interval plots (at 95% confidence) of the mean background, construction, and post-construction PM2.5 and PM10 concentration readings at the four BAM stations ().
Figure 2. Time series and the corresponding linear trend equations for PM2.5 and PM10 concentrations at the four BAM stations for the construction and post-construction groups. The zeroth day, by convention, represents the first day of recording PM10 concentrations after the start of construction.
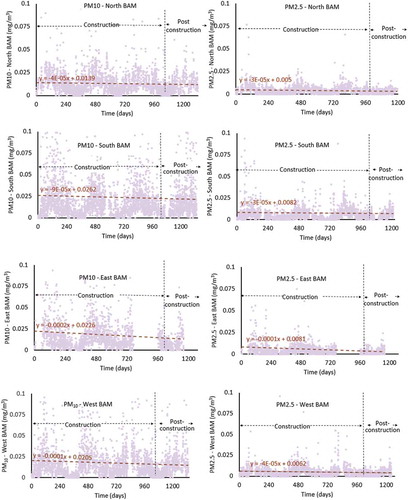
Figure 3. Confidence interval (at 95%) plots depicting the mean PM2.5 concentration levels for the background, construction, and post-construction groups recorded at the four BAM stations.
The choice of tests to investigate the statistical significance in the difference between the groups depends on whether the data are parametric or nonparametric. We chose the Anderson-Darling (AD) test for normality (Anderson and Darling, Citation1954; Razali and Yap, Citation2011). This test calculates a probability value (P value) from the data to accept (P > 0.05) or reject (P ≤ 0.05) a null hypothesis that states that the data are normally distributed. The results showed that the underlying distribution for PM2.5 and PM10 readings of the three groups for all the four BAM stations was not normal (Section S3 in Supplemental Materials). Furthermore, to verify if the PM data can be transformed (from a lognormal distribution) into a normal distribution, the Box-Cox transformation (Box and Cox, Citation1964) was applied, and a subsequent AD test showed that the transformed data were not normally distributed (Section S4 in Supplemental Materials). After demonstrating that the data were nonparametric, we chose the Kruskal-Wallis (KW) (Shao and Lu, Citation2000; Singh, Citation1994) test to evaluate the statistical significance in the difference between two or more groups of nonparametric data. The KW test calculates a P value from the data to accept (P > 0.05) or reject (P ≤ 0.05) a null hypothesis that states that the difference between the groups is not statistically significant.
The hypotheses to evaluate if the PM2.5 and PM10 concentrations in the background, construction, and post-construction groups are significantly different are as follows:
Hnull:
No statistically significant difference between the three groups (background, construction, and post-construction) for PM2.5 or PM10
Halternate:
Statistically significant difference between the three groups (background, construction, and post-construction) for PM2.5 or PM10
The KW test only verifies if the differences in the medians of the three PM groups are statistically significant and does not rank the groups based on their median values (Elliott and Hynan, Citation2011). The nonparametric Dunn’s multiple comparison post hoc test with the Bonferroni correction(Dunn, Citation1964) was chosen to identify groups with significantly different median PM concentrations and rank the three groups based on the median values. If the corrected P value returned by the Dunn’s multiple comparison test for the PM concentrations of two groups is less than 0.05, then there is a significance difference between the two groups. In this case, if the difference between the rank scores of the PM concentrations of the two groups is negative, then the second group’s PM concentration is statistically higher than the first group. Similarly, if the difference is positive, then the first group’s PM concentration is statistically higher than that of the second group.
The KW and the Dunn’s multiple comparison tests were executed using the JMP software (SAS, Citation2016), and the Anderson-Darling test and the Box-Cox transformation were performed using the Minitab package (Minitab, Citation2016).
Results and discussion
The linear trend equations () are calculated from the values recorded by the BAM stations, which have a range of 0–0.9 and 0–0.5 mg/m3 for PM10 and PM2.5, respectively. The graphs are restricted to the 0–0.1 and 0–0.05 mg/m3 ranges for PM10 and PM2.5, respectively, to clearly depict the downward slope of the linear trend lines. The negative slope of the linear trend lines in the time series () indicates that the PM10 and PM2.5 concentrations decrease with time as the project progresses toward the completion of construction and enters the post-construction phase, consistent with increased wind-shielding effects of the built structures. As this trend could also be related to the decrease in ground-disturbing activities as construction approaches completion, a statistical comparison of post-construction downwind PM data with background data has also been conducted, to evaluate whether post-construction PM levels are lower than both construction and background levels.
The confidence interval plots of the three groups () show that mean PM10 and PM2.5 concentration levels in the post-construction group are lower than those in the construction group and the post-construction concentrations are lower than the background concentrations for the east, west, and north BAM stations. Furthermore, the intervals of the mean concentrations during the construction phase overlap with or are lower than the background concentrations for the east, west, and north BAM stations. The wind-shielding effect is only partially in place during the construction time frame, as part of the site has been constructed whereas other parts have not. Use of water and palliatives limits on-site dust generation during construction, but the construction PM concentration has the potential to be higher than background level because of the construction activities, as is the case for the south BAM station. For the same land management practices during project construction, the differing results between BAM stations may be related to the relatively higher background PM10 concentrations in the north and east BAM stations. Differences in background PM concentrations between the BAM stations are likely influenced by the topography surrounding the project site and associated surface features such as nonerodible surface material, vegetation cover, mineralized soil crusts, and biological soil crusts (U.S. Department of the Interior Bureau of Land Management, Citation2011).
In , for each of the BAM stations, the KW test returns a P value of <0.001; therefore, the null hypothesis (Hnull) is rejected (P < 0.05), demonstrating statistically significant differences between the three groups (background, construction, and post-construction) for PM2.5 and PM10 concentration levels at the four BAM stations.
Table 2. Kruskal-Wallis test results demonstrating statistically significant differences between the median background, construction, and post-construction PM2.5 and PM10 concentrations in each BAM station at a 95% confidence interval.
The post hoc analysis results () confirm the trends in the time-series analysis and the confidence interval plots that show that the PM10 and PM2.5 concentration levels in the post-construction group are lower than in the construction group and the post-construction concentrations are lower than the background concentrations for the east, west, and north BAM stations (). The conclusion column in shows that the PM10 concentrations peak during construction in the west and south BAMs and similarly the PM2.5 concentrations peak during the construction in the west, east, north, and south BAMs. There is a subsequent decrease in the post-construction group in all these cases. For the south BAM, the median post-construction PM10 and PM2.5 concentrations are greater than the background concentrations by 0.004 and 0.002 mg/m3, respectively, which represent marginal increases of 2.6% and 5.7% when compared with EPA’s 24-hr ambient air quality standards of 0.15 and 0.035 mg/m3 for PM10 and PM2.5, respectively (EPA, Citation2015). In the case of PM2.5 measurements for the south BAM, the marginal increase in post-construction concentrations compared with background concentrations is not statistically significant (). For the south BAM, PM measurements may have been affected by emissions from traffic on an access road that originates near the southwest corner of the site or a drainage berm near the south station.
Table 3. Results of the nonparametric post hoc analysis to rank the background, construction, and post-construction PM2.5 and PM10 concentrations from the four BAM stations.
These results indicate statistically significant reductions in the downwind post-construction PM concentrations in six out the eight cases (PM2.5 and PM10 concentrations in north, east, and west stations) when compared with the background concentrations. These observations are consistent with the wind-shielding impact of PV systems after the completion of construction. Other factors that can potentially impact PM emissions are humidity, rainfall, local vegetation, and the turbulence due to the wind flow interaction with the PV panel (Chepil, Citation1945; Singh, Citation1994; Kok and Renno, Citation2009; Morgan, Citation2009; Kok et al., Citation2012; Etyemezian et al., Citation2017). The PV panels interact with moisture or water due to humidity and rainfall, and this changes the water deposition patterns on the ground (Cook and McCuen, Citation2013; Luo et al., Citation2017) and the resulting PM emissions when compared with a scenario with no PV installations. The increase in PM emissions from the loss of ground vegetation will gradually recede as the ground vegetation recovers when land disturbance ceases after the completion of the PV construction phase. Future research investigating the impact of these factors on PM emissions before and after a PV installation can further strengthen and complement this study.
The post-construction PM concentrations are reduced to below the background levels () for six out of the eight cases within a 10-month post-construction observation period (refer to post-construction start and last dates in Table S2, Section S2 in Supplemental Materials), and with construction activity having ceased and no further ground-disturbing activities, the PM emissions are expected to remain stable. Therefore, the need for post-construction monitoring of downwind PM levels may be reduced when PV systems are deployed under similar topographical and weather conditions. The findings demonstrate that by restricting monitoring time frames to 1 yr from the completion of construction (under similar soil and weather conditions) rather than the current requirement of 3 yr (U.S. Department of the Interior Bureau of Land Management, Citation2010), the monitoring costs and thereby the economic costs of PV electricity generation can be further reduced. Furthermore, based on the findings of this study, future research can investigate the health impacts from PM emission reductions (Brunekreef and Forsberg, Citation2005; Duvall et al., Citation2008; EPA, Citation2009; Wei et al., Citation2009) for PV projects located in desert conditions and in the vicinity of populated areas. The results of this study are based on the desert conditions that are typical to utility-scale PV installations that are increasingly located in the southwest United States (Hernandez et al., Citation2014). Additional PM monitoring in other locations can assess the wind-shielding effect under different soil, topographical, and weather conditions.
Conclusion
This research evaluates the impact of a utility-scale PV installation on downwind PM2.5 and PM10 concentrations based on readings collected from four BAMs over 3 yr at a 550-MWAC plant in Riverside Country, California. The post-construction downwind PM2.5 and PM10 concentrations are lower than the background concentrations for readings collected from three of the four BAMs. The reduction in PM concentrations can be attributed to the wind-shielding effect of the PV installation. The fourth BAM recorded 0.004 and 0.002 mg/m3 marginal increases in post-construction PM2.5 and PM10 concentrations when compared with background concentrations, respectively, and these increases correspond to 2.6% and 5.7% of the 24-hr ambient air quality standards defined by the EPA. The reductions in the PM concentrations in the three BAM stations were observed within 10 months of completion of construction; therefore, the need for post-construction monitoring of downwind PM levels may be reduced from 3 to 1 yr for deployments in locations with topographical and weather conditions similar to Riverside County, California.
Supplemental Document
Download MS Word (97.8 KB)Acknowledgment
The authors thank NextEra Energy and Yorke Engineering for assistance with accessing BAM data. They thank Ryan Nielsen and John Sakers of First Solar for their feedback on this study. They thank the reviewers for the feedback that has improved the quality of the manuscript.
Funding
This study is primarily supported by the National Science Foundation (NSF) and the Department of Energy (DOE) under NSF CA grants EEC-1041895 and -1140190. Any opinions, findings, and conclusions or recommendations expressed in this material are those of the authors and do not necessarily reflect those of NSF or DOE.
Supplemental data
Supplemental data for this article can be accessed on the publisher’s website.
Additional information
Funding
Notes on contributors
Dwarakanath Ravikumar
Dwarakanath Ravikumar is a Post-doctoral Researcher in the Department of Civil, Environmental and Sustainable Engineering at Arizona State University, Tempe, Arizona, USA.
Parikhit Sinha
Parikhit Sinha is a Senior Scientist for Global Sustainability at First Solar, Tempe, Arizona, USA.
Related Research Data
References
- Anderson, T.W., and D.A. Darling. 1954. A test of goodness of fit. J. Am. Stat. Assoc. 49:765–9. doi: 10.1080/01621459.1954.10501232.
- Bagnold, R.A. 1941. The Physics of Blown Sand and Desert Dunes. London: Methuen.
- Belnap, J., S.M. Munson, and J.P. Field. 2011. Aeolian and fluvial processes in dryland regions: The need for integrated studies. Ecohydrology 4:615–22. doi: 10.1002/eco.
- Box, G.E., and D.R. Cox. 1964. An analysis of transformations. J. R. Stat. Soc. Ser. B. Stat. Methodol. 26:211–52. doi: 10.2307/2287791.
- Brunekreef, B., and B. Forsberg. 2005. Epidemiological evidence of effects of coarse airborne particles on health. Eur. Respir. J. 26:309–18. doi: 10.1183/09031936.05.00001805.
- California Air Resources Board. 2015. Ambient air quality standards (AAQS) for particulate matter. https://www.arb.ca.gov/research/aaqs/pm/pm.htm ( accessed January 20, 2017).
- Chepil, W.S. 1945. Dynamics of wind erosion: III. The transport capacaity of wind. Soil Sci. 60:475–80. doi: 10.1097/00010694-194512000-00006.
- Chevalier, H.L., and D.J. Norton. 1979. Wind Loads on Solar Collector Panels and Support Structure. College Station, TX: Texas A&M University.
- Chung, A., D.P. Chang, M.J. Kleeman, K.D. Perry, T.A. Cahill, D. Dutcher, E.M. McDougall, and K. Stroud. 2001. Comparison of real-time instruments used to monitor airborne particulate matter. J. Air Waste Manage. Assoc. 51:109–20. doi: 10.1080/10473289.2001.10464254.
- Cook, L.M., and R.H. McCuen. 2013. Hydrologic response of solar farms. J. Hydrol. Eng. 18:536–41. doi: 10.1061/(ASCE)HE.1943-5584.0000530.
- Desideri, U., S. Proietti, F. Zepparelli, P. Sdringola, and S. Bini. 2012. Life cycle assessment of a ground-mounted 1778kWp photovoltaic plant and comparison with traditional energy production systems. Appl. Energy 97:930–43. doi: 10.1016/j.apenergy.2012.01.055.
- Dunn, O.J. 1964. Multiple comparisons using rank sums. Technometrics 6:241–52. doi: 10.1080/00401706.1964.10490181.
- Duvall, R.M., G.A. Norris, L.A. Dailey, J.M. Burke, J.K. McGee, M.I. Gilmour, T. Gordon, and R.B. Devlin. 2008. Source apportionment of particulate matter in the U.S. and associations with lung inflammatory markers. Inhal. Toxicol. 20:671–83. doi: 10.1080/08958370801935117.
- Elliott, A.C., and L.S. Hynan. 2011. A SAS macro implementation of a multiple comparison post hoc test for a Kruskal-Wallis analysis. Comput. Methods Programs Biomed. 102:75–80. doi: 10.1016/j.cmpb.2010.11.002.
- Etyemezian, V., G. Nikolich, and J.A. Gillies. 2017. Mean flow through utility scale solar facilities and preliminary insights on dust impacts. J. Wind Eng. Ind. Aerodyn. 162:45–56. doi: 10.1016/j.jweia.2017.01.001.
- First Solar. 2015. Desert sunlight solar farm. http://www.firstsolar.com/en/About-Us/Projects/Desert-Sunlight-Solar-Farm.aspx ( accessed January 20, 2017).
- First Solar. 2016. Sustainability report. http://www.firstsolar.com/-/media/First-Solar/Sustainability-Documents/03801_FirstSolar_SustainabilityReport_08MAR16_Web.ashx ( accessed January 20, 2017).
- Fthenakis, V.M., and H.C. Kim. 2010. Life-cycle uses of water in U.S. electricity generation. Renew. Sustain. Energy Rev. 14:2039–48. doi: 10.1016/j.rser.2010.03.008.
- Fthenakis, V., H.C. Kim, and E. Alsema. 2008. Emissions from photovoltaic life cycles. Environ. Sci. Technol. 42:2168–74. doi: 10.1021/es071763q.
- Fthenakis, V.M., and H.C. Kim. 2011. Photovoltaics: Life-cycle analyses. Sol. Energy 85:1609–28. doi: 10.1016/j.solener.2009.10.002.
- Gilchrist, A., and E.N. Allouche. 2005. Quantification of social costs associated with construction projects: State-of-the-art review. Tunnel. Underground Space Technol. 20:89–104. doi: 10.1016/j.tust.2004.04.003.
- Goodrich, A., T. James, and M. Woodhouse. 2012. Residential, Commercial, and Utility-Scale Photovoltaic (PV) System Prices in the United States: Current Drivers and Cost-Reduction Opportunities. Golden, CO: National Renewable Energy Laboratory. http://www.nrel.gov/docs/fy12osti/53347.pdf ( accessed January 20, 2017).
- Greeley, R., and D.I. James. 1985. Wind as a Geological Process: On Earth, Mars, Venus and Titan. Cambridge, UK: Cambridge University Press.
- Guerin, T. 2017a. A case study identifying and mitigating the environmental and community impacts from construction of a utility-scale solar photovoltaic power plant in Eastern Australia. Sol. Energy 146:94–104. doi: 10.1016/j.solener.2017.02.020.
- Guerin, T.F. 2017b. Evaluating expected and comparing with observed risks on a large-scale solar photovoltaic construction project: A case for reducing the regulatory burden. Renew. Sustain. Energy Rev. 74:333–48. doi: 10.1016/j.rser.2017.02.040.
- Hernandez, R.R., M.K. Hoffacker, and C.B. Field. 2014. Land-use efficiency of big solar. Environ. Sci. Technol. 48:1315–23. doi: 10.1021/es4043726.
- International Energy Agency. 2014. Technology Roadmap: Solar Photovoltaic Energy. https://www.iea.org/publications/freepublications/publication/TechnologyRoadmapSolarPhotovoltaicEnergy_2014edition.pdf ( accessed January 20, 2017).
- Ketchman, K., and M. Bilec. 2013. Quantification of particulate matter from commercial building excavation activities using life-cycle approach. J. Constr. Eng. Manage. 139:A4013007. doi: 10.1061/(ASCE)CO.1943-7862.0000776.
- Ketjoy, N., and M. Konyu. 2014. Study of dust effect on photovoltaic module for photovoltaic power plant. Energy Procedia 52:431–7. doi: 10.1016/j.egypro.2014.07.095.
- Kok, J.F., and O.N. Nilton. 2009. A comprehensive numerical model of steady state saltation (COMSALT). J. Geophys. Res. Atmos. 114(D17): D17204. doi: 10.1029/2009JD011702.
- Kok, J.F., E.J.R. Parteli, T.I. Michaels, and D. B. Karam. 2012. The physics of wind-blown sand and dust. Rep. Prog. Phys. 75:106901. doi: 10.1088/0034-4885/75/10/106901.
- Lovich, J.E., and J.R. Ennen. 2011. Wildlife conservation and solar energy development in the Desert Southwest, United States. BioScience 61:982–92. doi: 10.1525/bio.2011.61.12.8.
- Luo, Y., J.E. Koonce, R.M. Shillito, T. A. Ghezzehei, M.B. Hausner, Z. Yu, and M. Berli. 2017. Impacts of Solar Arrays on Rainwater Infiltration—Some Simulations. W-3188 Las Vegas, NV: Multi-state Soil Physics Research Group.
- Maricopa County. 2013. Dust Abatement Handbook—Section 8. https://www.pubdef.maricopa.gov/aq/divisions/compliance/dust/docs/pdf/Rule%20310-Dust%20Handbook.pdf ( accessed January 20, 2017).
- Met One Instruments. 2015. BAM-1020 Continuous Particulate Monitor. http://www.metone.com/docs/bam1020_datasheet.pdf ( accessed January 20, 2017).
- Minitab. 2016. Minitab 18. https://www.minitab.com/en-us/products/minitab/ ( accessed January 20, 2017).
- Morgan, R.P.C. 2009. Soil Erosion and Conservation. New York: John Wiley & Sons.
- Muleski, G.E., C. Cowherd Jr., and J.S. Kinsey. 2005. Particulate emissions from construction activities. J. Air Waste Manage. Assoc. 55:772–83. doi: 10.1080/10473289.2005.10464669.
- National Renewable Energy Laboratory. 2012. Life Cycle Greenhouse Gas Emissions from Electricity Generation. http://www.nrel.gov/docs/fy13osti/57187.pdf ( accessed January 20, 2017).
- NextEra Energy Resources. 2015. Desert sunlight at work in California. http://webtest.nexteraenergyresources.com/what/desert-sunlight.shtml#tab_one-tab ( accessed January 20, 2017).
- Pavan, A.M., A. Mellit, and D. De Pieri. 2011. The effect of soiling on energy production for large-scale photovoltaic plants. Sol. Energy 85:1128–36. doi: 10.1016/j.solener.2011.03.006.
- Pocewicz, A., H. Copeland, and J. Kiesecker. 2011. Potential impacts of energy development on shrublands in western North America. Nat. Resour. Environ. Issues 17:1–5.
- Prospero, J.M., P. Ginoux, O. Torres, S.E. Nicholson, and T.E. Gill. 2002. Environmental characterization of global sources of atmospheric soil dust identified with the NIMBUS 7 Total Ozone Mapping Spectrometer (TOMS) absorbing aerosol product. Rev. Geophys. 40:1002. doi: 10.1029/2000RG000095.
- Pui, D.Y.H., J. Cao, Z. An, and J. Wang. 2014. Great wall of solar panels to mitigate yellow dust storm. Particuology 13:146–50. doi: 10.1016/j.partic.2014.03.002.
- Ravikumar, D. 2013. Photovoltaic capacity additions: The optimal rate of deployment with sensitivity to time-based GHG emissions. Master’s thesis, Arizona State University, Tempe, Arizona. https://repository.asu.edu/items/20837 (accessed January 20, 2017).
- Ravikumar, D. 2016. An anticipatory-lifecycle approach towards increasing the environmental gains from photovoltaic systems through improved manufacturing and recycling. Ph.D. dissertation, Arizona State University, Tempe, Arizona. https://repository.asu.edu/items/40743 (accessed January 20, 2017).
- Ravikumar, D., T.P. Seager, M.V. Chester, and M.P. Fraser. 2014. Intertemporal cumulative radiative forcing effects of photovoltaic deployments. Environ. Sci. Technol. 48:10010–8. doi: 10.1021/es502542a.
- Ravikumar, D., B. Wender, T.P. Seager, M.P. Fraser, and M. Tao. 2017. A climate rationale for research and development on photovoltaics manufacture. Appl. Energy 189:245–56. doi: 10.1016/j.apenergy.2016.12.050.
- Razali, N.M., and B.W. Yap. 2011. Power comparisons of Shapiro-Wilk, Kolmogorov-Smirnov, Lilliefors and Anderson-Darling tests. J. Stat. Model. Anal. 2:21–33.
- Russell, A.G., and B. Brunekreef. 2009. A focus on particulate matter and health. Environ. Sci. Technol. 43:4620–5. doi: 10.1021/es9005459.
- San Joaquin Valley Air Pollution Control District. 2004. Rule 8021—Construction, Demolition Excavation, Extraction and Other Earthmoving Activities (Fugitive PM10 Prohibitions). https://www.valleyair.org/rules/1ruleslist.htm. (accessed January 20, 2017)
- SAS. 2016. JMP. http://www.jmp.com/en_us/home.html ( accessed January 20, 2017).
- Shademan, M., and H. Hangan. 2009. Wind loading on solar panels at different inclination angles. Presented at the 11th Americas Conference on Wind Engineering. June 22, San Juan, Puerto Rico.
- Shao, Y., and H. Lu. 2000. A simple expression for wind erosion threshold friction velocity. J. Geophys. Res. Atmos. 105(D17):22437–43. doi: 10.1029/2000JD900304.
- Singh, U.B. 1994. Wind erosion: Mechanics of saltation and dust generation. PhD dissertation, Texas Tech University, Lubbock, Texas. https://ttu-ir.tdl.org/ttu-ir/handle/2346/8632 (accessed January 20, 2017).
- Solar Energy Industries Association. 2015. Solar Energy Facts: Q2 2015. http://www.seia.org/sites/default/files/Q22015SMIFactSheetpdf ( accessed January 20, 2017).
- Solomon, P.A., and C. Sioutas. 2008. Continuous and semicontinuous monitoring techniques for particulate matter mass and chemical components: A synthesis of findings from EPA’s particulate matter supersites program and related studies. J. Air Waste Manage. Assoc. 58:164–95. doi: 10.3155/1047-3289.58.2.164.
- South Coast Air Quality Management District. 2005. Rule 403—Fugitive Dust Control. http://www.aqmd.gov/docs/default-source/rule-book/rule-iv/rule-403.pdf ( accessed January 20, 2017).
- United States Department of Agriculture. 2016a. Aridisols map. https://www.nrcs.usda.gov/wps/portal/nrcs/detail/soils/survey/class/maps/?cid=nrcs142p2_053595 ( accessed April 20, 2017).
- United States Department of Agriculture. 2016b. Wind rose resources. https://www.wcc.nrcs.usda.gov/climate/windrose.html ( accessed April 20, 2017).
- U.S. Department of Energy. 2012. SunShot Vision Study. http://energy.gov/eere/sunshot/sunshot-vision-study ( accessed January 20, 2017).
- U.S. Department of the Interior Bureau of Land Management. 2010. Desert Sunlight Solar Farm Project—CACA 48649 (Appendix 1). http://www.blm.gov/style/medialib/blm/ca/pdf/palmsprings/desert_sunlight.Par.39828.File.dat/ROD appendix 1 protest resolution.pdf ( accessed January 20, 2017).
- U.S. Department of the Interior Bureau of Land Management. 2011. Desert Sunlight Solar Farm Project California Desert Conservation Area Plan Amendment and Final Environmental Impact Statement. DOI Control No. FES 10-39. Washington, DC: U.S. Department of Interior.
- U.S. Environmental Protection Agency. 2009. Integrated Science Assessment (ISA) for Particulate Matter (Final Report, Dec 2009). https://cfpub.epa.gov/ncea/risk/recordisplay.cfm?deid=216546 ( accessed January 20, 2017).
- U.S. Environmental Protection Agency. 2012. Construction General Permit—Section 2.1. https://www.epa.gov/sites/production/files/2016-09/documents/cgp2012_finalpermitpart1-9-updatedurl.pdf ( accessed January 20, 2017).
- U.S. Environmental Protection Agency. 2015. National Ambient Air Quality Standards (NAAQS). https://www.epa.gov/criteria-air-pollutants/naaqs-table ( accessed January 20, 2017).
- Wei, Y., I. Han, M. Shao, M. Hu, J. Zhang, and X. Tang. 2009. PM2.5 constituents and oxidative DNA damage in humans. Environ. Sci. Technol. 43:4757–62. doi: 10.1021/es803337c.