
ABSTRACT
This study provides the first comprehensive analysis of the seasonal variations and weekday/weekend differences in fine (aerodynamic diameter <2.5 μm; PM2.5) and coarse (aerodynamic diameter 2.5–10 μm; PM2.5–10) particulate matter mass concentrations, elemental constituents, and potential source origins in Jeddah, Saudi Arabia. Air quality samples were collected over 1 yr, from June 2011 to May 2012 at a frequency of three times per week, and analyzed. The average mass concentrations of PM2.5 (21.9 μg/m3) and PM10 (107.8 μg/m3) during the sampling period exceeded the recommended annual average levels by the World Health Organization (WHO) for PM2.5 (10 μg/m3) and PM10 (20 μg/m3), respectively. Similar to other Middle Eastern locales, PM2.5–10 is the prevailing mass component of atmospheric particulate matter at Jeddah, accounting for approximately 80% of the PM10 mass. Considerations of enrichment factors, absolute principal component analysis (APCA), concentration roses, and backward trajectories identified the following source categories for both PM2.5 and PM2.5–10: (1) soil/road dust, (2) incineration, and (3) traffic; and for PM2.5 only, (4) residual oil burning. Soil/road dust accounted for a major portion of both the PM2.5 (27%) and PM2.5–10 (77%) mass, and the largest source contributor for PM2.5 was from residual oil burning (63%). Temporal variations of PM2.5–10 and PM2.5 were observed, with the elevated concentration levels observed for mass during the spring (due to increased dust storm frequency) and on weekdays (due to increased traffic). The predominant role of windblown soil and road dust in both the PM2.5 and PM2.5–10 masses in this city may have implications regarding the toxicity of these particles versus those in the Western world where most PM health assessments have been made in the past. These results support the need for region-specific epidemiological investigations to be conducted and considered in future PM standard setting.
Implications: Temporal variations of fine and coarse PM mass, elemental constituents, and sources were examined in Jeddah, Saudi Arabia, for the first time. The main source of PM2.5–10 is natural windblown soil and road dust, whereas the predominant source of PM2.5 is residual oil burning, generated from the port and oil refinery located west of the air sampler, suggesting that targeted emission controls could significantly improve the air quality in the city. The compositional differences point to a need for health effect studies to be conducted in this region, so as to directly assess the applicability of the existing guidelines to the Middle East air pollution.
Introduction
To date, numerous studies have demonstrated that exposure to particulate matter (PM) air pollution is associated with elevated risks for mortality (e.g., Krewski et al., 2009) and morbidity (e.g., Brook et al., Citation2010). Airborne PM is itself a mixture of multiple compounds (e.g., elemental and organic carbon, transition metals, nitrates, sulfates) in particles ranging in size from several nanometers to >10 μm in aerodynamic diameter; it can be directly released from both natural and anthropogenic sources or is formed from gases (such as sulfur dioxide) into secondary aerosols via chemical reactions in the atmosphere. As a result, the chemical and physical characteristics of PM air pollution, as well as their associated health effects, likely vary depending on the source(s) (National Research Council [NRC], Citation2004). Natural emissions (e.g., crustal minerals, forest fires, and ocean salt), traffic emissions (e.g., from gasoline or diesel fuel combustion, road construction materials, resuspended road dust, and wear products from tires, brake linings, and bearings), and industrial emissions (e.g., combustion of fossil fuel and industrial metallurgical processes) are often the principal sources of transition and heavy metals in the ambient air (Kothai et al., Citation2008; Xue et al., Citation2010; Cheung et al., Citation2011). Naturally derived trace metals (such as the crustal elements aluminum [Al] and silicon [Si]) are predominantly found in coarse particles (Stone et al., Citation2011), whereas trace components of anthropogenic origin (e.g., elemental carbon and sulfur) are mainly distributed among fine particles (Fang et al., Citation2006; Zhao et al., Citation2011).
Jeddah, the second largest city in the Kingdom of Saudi Arabia, with a population of more than 3.9 million, has experienced rapid population growth, urbanization, and industrialization during the past four decades (Aljoufie et al., Citation2013). The city serves as a vital commercial center for the country and the Middle Eastern region and acts as a primary transportation conduit for the Muslim pilgrims visiting nearby Mecca. Despite the economic and cultural significance of the city, there remains a critical lack of knowledge and uncertainty concerning the composition of PM air pollution, especially in regards to temporal patterns of the elemental constituents and potential sources. Predominance of windblown soil and dust in the general Middle Eastern region culminates in composition and temporal variations for PM that differ markedly from other locales in the world. Monitoring of long-term averages and PM mass alone may be insufficient for identification of specific sources of air pollution and their respective impacts on air quality and public health; hence, providing such further information is crucial in guiding future emission control policies and implementation of reduction measures.
The primary aims of the present study were to (1) investigate the seasonal and weekday/weekend variations of PM2.5, PM2.5–10, and PM10 and their elemental constituents; (2) evaluate the relative contribution of anthropogenic sources on the levels of these elements using enrichment factor (EF) analysis; and (3) identify and understand the temporal trends of the various PM source categories and evaluate their respective contributions to overall PM mass via applications of absolute principle component analysis (APCA), concentration wind rose (CWR) plots, and backward trajectories (BTs).
Methods
Study location
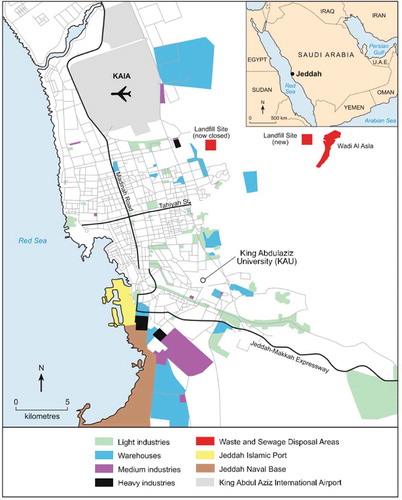
The city of Jeddah is located on the Red Sea coast, surrounded by mountains to the northeast, east, and southeast, which can inhibit the natural dilution of local air pollution. The climate is generally dry and warm, and the meteorology is characterized by frequent dust storms, with limited rainfalls during spring and summer. The primary mobile source of air pollution in Jeddah is traffic, with more than 1.4 million vehicles fueled mainly by unleaded gasoline and diesel (Khoder et al., Citation2012), and the main stationary sources include an oil refinery, a major seaport, a desalinization plant, a power generation plant, and manufacturing industries, the locations of which are depicted in .
Figure 1. Locations of notable stationary sources in Jeddah. King Abdulaziz University is the location of the air quality sampler.
Sample collection
The sampling site was located in the southeast region of Jeddah, in the Al-Jamea District, at a height of 9 m above the ground level on the roof of the Faculty of Meteorology, Environment and Arid Land Agriculture building at the King Abdulaziz University campus. PM samples were collected onto Teflon filters (Gelman Teflo, 37 mm, 0.2 μm pore size; Pall Corporation, Port Washington, NY) using PM2.5 and PM10 Harvard impactors (Turner et al., Citation2000) connected to calibrated vacuum pumps (Gast, Benton Harbor, MI), at a rate of 10.0 L/min, from midnight to midnight. The flow rates of the vacuum pump were checked before and after each sampling session. Samples were collected from June 2011 to May 2012 at a rate of three times per week: once on a weekend day (Thursday or Friday during sampling) and twice on weekdays (Saturday through Wednesday). Estimates of daily PM2.5–10 mass and elemental concentrations were derived by subtracting PM2.5 from PM10 concentrations.
Gravimetric and elemental analyses
The detailed descriptions for gravimetric and elemental analyses of the collected samples via energy-dispersive X-ray fluorescence (ED-XRF) have been provided in Maciejczyk et al. (Citation2005); in short, filter masses were measured on a microbalance (model MT5; Mettler-Toledo Inc., Highstown, NJ) and were subsequently analyzed for 24 elements by nondestructive XRF (model EX-6600-AF; Jordan Valley, Austin, TX) using five secondary fluorescers (Si, Ti, Fe, Ge, and Mo), and spectral software XRF2000 3.1 (U.S. Environmental Protection Agency [EPA] and ManTech Environmental Technology, Inc., Herndon, VA). The XRF instrument was calibrated with thin elemental layers deposited on Nuclepore film (Costar Corp., Cambridge, NY) substrates for the elements with deposited masses gravimetrically determined to within 5%, and with dual-element polymer films. The gain and baseline of the instruments were checked before each batch of samples using copper and tin foils. Additional check standards were run in the middle and at the end of each batch. Concentrations of elements above detection limit were defined as 3 times of the uncertainty of the measurements (3σ). Elements with high percentage of missing data (greater than 20% of days missing) were excluded from subsequent analyses (As, Cd, Cl, Co, Ga, Rb, and Se).
Enrichment factor
To obtain preliminary information about the origins of elements in the PM of the study area, the enrichment factors (EFs) for each element were calculated. EFs can provide insight into differentiation of an anthropogenic source from a natural origin of an element (Han et al., 2016). The enrichment factor for a generic element X with respect to a reference crustal element Y is defined as EFX = (X/Y)air/(X/Y)crust, where the ratio X/Y is the concentration ratio of X to Y in either aerosol sample versus earth crust, where the greater the ratio is above 1.0, the greater the anthropogenic enrichment. In the present study, Al was used as the crustal reference element Y, and the earth crust chemical composition was taken from Taylor and McLennan (Citation1985).
Source apportionment
The APCA approach developed by Thurston and Spengler (Citation1985) was employed to identify potential sources of PM emissions and estimate apportionment of mass. This method utilizes the scoring coefficients from the factor analysis to score a “zero” pollution day, which is then subtracted from observed factor scores to derive estimates of the absolute principal component scores (APCS). This in turn provides positive indices of daily source impacts, upon which daily PM mass concentrations can be regressed to achieve a source apportionment of mass. The number of factors was determined by applying a varimax rotation and evaluating the resulting factor eigenvalues and the factor-source interpretabilities vis-à-vis known source characteristics (e.g., Ni and V for residual oil combustion). In order to obtain mass estimates for each source, daily total PM mass were then regressed onto the absolute principal component scores, along with indicator terms for seasons and for weekday/weekend, to adjust for temporal patterns, such that the product of the βk and absolute scores provide the mass contributions associated with each source factor, using the equation below:
The scores were subsequently stratified by season or weekday/weekend to calculate corresponding mass estimates for the appropriate time periods of interest.
Concentration roses
Daily wind speed and direction data were obtained from the air monitoring station (Lufft WS600-UMB Compact Weather Station; Carpintera, CA, USA) located at King Abdulazis University. Concentration roses of daily average wind speed, indicating each wind direction and estimated source mass, were plotted using 16 sectors of wind direction (each 22.5°) and evaluated to investigate whether the source factors were significantly associated with a specific wind direction(s).
Backward trajectory (BT)
BT analysis was performed to determine the general location of the identified sources, on days on which estimated source mass estimates were among the highest 10% of estimated values. The BT profiles were produced using the Hybrid Single Particle Lagrangian Integrated Trajectory (HYSPLIT; Stein et al., Citation2015) model developed by the National Oceanic and Atmospheric Administration (NOAA). The back trajectories were computed from the location of the sampling site (21.4939°N, 39.2458°E). The HYSPLIT model was run using the Reanalysis database option; 48-hr backward periods; vertical motion calculation method; 500 m elevation above ground level; and a new run of trajectory calculation every 8 hr for 24 hr on each sampling day of interest.
Results and discussion
Temporal trends of PM and elemental constituent concentrations
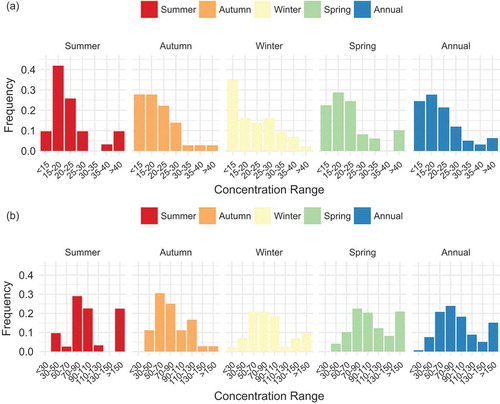
The annual average concentrations of PM2.5 (21.9 ± 11.6 μg/m3) and PM10 (107.8 ± 72.6 μg/m3) during the present study significantly exceeded the recommended levels by the World Health Organization (WHO) for PM2.5 (10 μg/m3) and PM10 (20 μg/m3) (WHO, 2006), respectively. 22.6%, 22.2%, 34.9%, 26.5%, and 27.0% of the sampled days’ mean 24-hr concentrations of PM2.5 exceeded the WHO air quality standards of 25 μg/m3 maximum 24-hr concentration () during summer, autumn, winter, spring, and annually, respectively. For PM10, 90.3%, 88.9%, 90.7%, 95.9%, and 91.8% of the mean 24-hr concentrations of PM10 exceeded the WHO air quality standard of 50 μg/m3 maximum 24-hr concentration () during summer, autumn, winter, spring, and the whole year, respectively. Coarse particles were predominant in Jeddah, with a smaller PM2.5/PM10 mass ratio (0.20) observed than in other cities (); the size distribution of PM also exhibited seasonal differences, shifting to higher percentage of PM2.5–10 during spring, likely reflecting the influence of coarse particles carried by dust storm events frequent during the season in Jeddah (Alghamdi et al., Citation2015).
Table 1. PM levels and PM2.5/PM10 and PM2.5/PM2.5–10 concentration ratios in select cities.
Figure 2. Distributions of daily mean concentrations of (a) PM2.5 and (b) PM10, by season.
For PM2.5–10 and PM10, the maximum monthly average concentrations were observed in February (168.5 and 191.3 µg/m3, respectively) and the minimum concentrations were observed in September (48.7 and 65.0 µg/m3, respectively) (), whereas for PM2.5 the highest concentration was observed in December (26.4 µg/m3) and the lowest in January (12.9 µg/m3). The highest concentrations for seasonal averages were found in spring (23.4, 110.6, and 114.0 µg/m3, for PM2.5, PM2.5–10, and PM10, respectively) and the lowest values in autumn (20.3, 62.8, and 83.1 µg/m3, for PM2.5, PM2.5–10, and PM10, respectively) (). The average concentrations of PM2.5, PM2.5–10, and PM10 were consistently higher during weekdays than weekends (Thursday and Friday in Saudi Arabia during the period of study); the weekday versus weekend averages were 22.7 and 19.4 µg/m3 for PM2.5, 92.8 and 67.2 µg/m3 for PM2.5–10, and 115.51 and 86.58 µg/m3 for PM10, respectively. The associated weekdays/weekends mean concentration ratios were 1.2 for PM2.5, 1.4 for PM2.5–10, and 1.3 for PM10, indicating that the concentrations on the weekends compared with weekdays were reduced by 15% for fine PM2.5, 28% for PM2.5–10, and 25% for PM10.
Figure 3. Monthly variations of PM2.5, PM2.5–10, and PM10 concentrations during the period of study, with error bars.
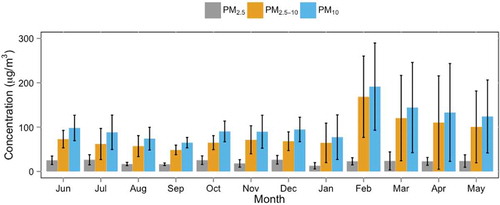
Table 2. Summary statistics for particulate matter (μg/m3) and elemental constituents (ng/m3).
Table 3. Seasonal averages ± SD for fine and coarse particulate matter (μg/m3) and elemental constituents (ng/m3).
Summary statistics and seasonal trends of measured elemental constituents in PM2.5, PM2.5–10, and PM10 during the study are presented in . Based on the mean concentrations, S was the dominant element in fine particulate matter, representing 45.3% of the sum of PM2.5 elemental masses, whereas Si was the dominant element in coarse particulate matter, representing 28.0% of the sum of PM2.5–10 elemental mass. Other elements significantly contributing to PM2.5 elemental mass include Si (13.7%), Pb (9.9%), Ca (7.0%), Fe (5.5%), and Al (5.1%), and those contributing to PM2.5–10 include Ca (18.4%), Fe (11.2%), S (10.2%), Al (8.7%), and Cl (6.9%). The mean concentrations of total elemental mass for PM2.5–10 were highest during spring, followed by winter, summer, and autumn, whereas for PM2.5 the highest levels were found during summer, followed by autumn, spring, and winter. The concentrations of all of the elemental species in both fine and coarse PM during weekdays were elevated compared with weekends. For PM2.5, the weekdays/weekends concentration ratios ranged from 1.15 for Rb to 1.31 for Fe (with a ratio of 1.24 for total element concentration); for PM2.5–10, ratios were generally higher than fine PM, with ratios ranging from 1.21 for S to 1.66 for Fe (with a ratio of 1.53 for total element concentration; ).
Table 4. Weekday versus weekend averages ± SD for fine and coarse particulate matter (μg/m3) and elemental constituents (ng/m3).
Source identification
Enrichment factor
The seasonal EF values of the elements measured in fine and coarse fractions of PM are summarized in . In general, values of EF near unity suggest that crustal erosion is the primary source of that element, and its geochemical content has not been enriched by emissions from anthropogenic sources. Elements with EFs in the range of 2–5 are considered as moderately enriched, 5–40 as significantly enriched, and those with more than 40 are considered as extremely enriched (Han et al., Citation2006). In the present study, EF values lower than 2 were found for Fe, K, Mg, Si, and Ti in both fine and coarse fractions, consistent with the evidence that the main sources of these elements are generally soil and resuspended road dust. Cr, Mn, Sr, and V in fine fraction and Ca, Cr, Mn, Ni, Sr, and V in coarse fraction were moderately enriched, whereas Ca and Ni in fine fraction and Cu and Zn in coarse fraction were significantly enriched (5 < EF < 40), indication of influence by anthropogenic sources. The PM2.5 in the study area was found to be extremely enriched by Cu, Pb, S, and Zn, whereas PM2.5–10 was found to be extremely enriched by Pb and S, suggesting that these elements are present in concentrations too high to be explained in terms of normal crustal weathering processes; consequently, these highly enriched elements are assumed to originate mainly from anthropogenic sources (Loyola et al., Citation2006; Xu et al., Citation2012).
Table 5. Enrichment factors (EFs) for fine and coarse particulate matter by season.
Absolute principal component analysis
For PM2.5, four source categories were identified via APCA, based on the factor eigenvalues and the interpretability of the identified factors: soil/road dust, residual oil, solid waste incineration, and traffic (). The first factor was identified as windblown soil/road dust, due to its high loadings on crustal elements: Al, Ca, Cr, Fe, K, Mg, Mn, Ni, Si, Sr, and Ti (Lough et al., Citation2005). The second factor was deemed to be from residual oil burning, with loadings on Ni, S, and V (Peltier et al., 2008). The third factor was identified as associated with PM from solid waste incineration, which can have high emissions of Cu and Zn (Thurston and Spengler, Citation1985; Morawska and Zhang, Citation2002). The predominant contribution of mass from coarse particles for this factor is also suggestive of potential loadings in part from emissions from brake linings wearing. The fourth factor was indicated to be due to traffic, based on its factor loading on Pb, which is mainly derived from its use in automobile fuel (Sun et al., 2004). Although the legal usage of leaded gasoline was phased out in Saudi Arabia in 2001 (Aburas et al., Citation2011), elevated Pb levels in the soil has been found to be present among different traffic locales in Jeddah recently (Kadi, Citation2009), as Pb can persist in the atmosphere as part of traffic-generated road dust with its long half-life. For PM2.5–10, three factors were identified: soil/road dust, with loadings on crustal elements Al, Ca, Cr, Fe, K, Mg, Mn, Ni, Si, Sr, Ti, and V; traffic, with loadings on Pb and S; and solid waste incineration, with loadings on Cu and Zn. These identified source categories are consistent with the results from EF analysis, as the highly enriched elements (Cu, Ni, Pb, S, Zn) were correlated with factors associated with anthropogenic emission sources. Estimated mass for the various source categories revealed that the residual oil burning factor (11.6 ± 6.4 µg/m3) is responsible for the largest mass contribution to the fine particulate matter mass in Jeddah, contributing 63.0% of the total predicted fine particulate matter mass; soil/road dust factor contributed 26.9% (5.0 ± 7.4 µg/m3), traffic factor contributed 5.6% (1.0 ± 1.5 µg/m3), and solid waste incineration contributed 4.6% (0.9 ± 2.0 µg/m3). For coarse particulate matter, soil/road dust had the highest predicted mass (76.8 ± 63.4 µg/m3), contributing the majority (77.3%) of the predicted mass; solid waste incineration factor had the next highest predicted mass (13.8 ± 12.0 µg/m3), contributing 13.9%; and traffic factor accounted for the rest (8.7 ± 13.9 µg/m3) of the predicted mass, at 8.8%. The cumulative variances were 0.87 and 0.85 for the sources identified by APCA for the fine and coarse PM, respectively, indicating robustness of the factor solutions ().
Figure 4. Sources of elements in PM2.5 and PM2.5–10 samples identified by APCA in Jeddah.
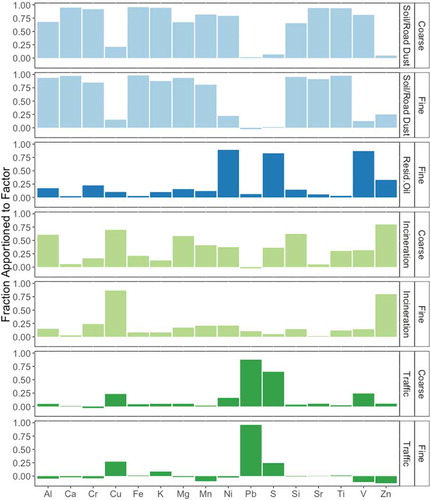
Table 6. Predicted mass means and SDs for identified factors for fine and coarse particulate matter.
Temporal trends of identified sources
High standard deviations for observed PM mass were observed during the study, reflecting the high temporal variability for PM concentrations in Jeddah, as well as the influence of extreme pollution events resulting from occurrence of dust storms, which were common in the area during the sampling period. Source categories identified via APCA exhibited observable temporal trends; for the soil/road dust factor (and associated elements), the highest concentration levels were found during spring. The influence of dust storm events on the seasonal trends of mass and elemental characteristics of PM in this study, with elevated overall PM mass and crustal elements’ concentration levels during spring contributing to high annual averages, has been similarly observed in Saudi Arabia and other Middle Eastern locations. Alharbi et al. (2015), in their investigation of temporal trends of PM10 characteristics in Riyadh, Saudi Arabia, noted substantial increases of mass of crustal elements during spring and summer, and the role of dust storm events on inducing temporal variations in mass concentrations of PM2.5 and PM10 was similarly observed by Lihavainen et al. (Citation2016) in a sampling campaign conducted in Hada Al Sham, a rural area in Saudi Arabia. Draxler et al. (Citation2001) similarly found the highest PM10 levels between late spring and early summer in Kuwait, Iraq, and Saudi Arabia, whereas in Ahvaz, Iran, Shahsavani et al. (2011) also observed high annual average levels of PM10 and PM2.5, with frequent dust events during early summer contributing to the elevated annual averages. For the residual oil burning source, elevated concentration levels were observed during summer, potentially due to increased port traffic during the season (e.g., from burning “bunker fuel”). For the solid waste incineration source, the highest levels were observed during winter and lowest in the autumn, likely reflecting variable operations or local dispersion variations (e.g., in wind direction). For the traffic factor, the highest levels were observed during spring and the lowest levels were observed in summer, possibly due to decreased travel during hotter temperatures and/or to poorer dispersions; the results are consistent with past findings observing decreased volatile organic compound (VOC; Alghamdi et al., Citation2014a) and nitrogen oxide (NOx; Alghamdi et al., Citation2014b) concentration levels, which are indicative of traffic volume, during summers in Jeddah. The decreased mass estimates for the anthropogenic source categories during summer may also reflect reduced human activity during Ramadan (July 31 to August 30 in 2011), occurrence of which is associated with regional decreases in traffic, industrial activity, and commercial output (Campante and Yanagzawa-Drott, Citation2015). This potential hypothesis is additionally supported by substantially lower EFs () observed during the summer for the highly enriched PM elements.
Considerable weekday/weekend differences in concentration levels for soil/road dust and traffic sources could also be observed, with higher levels on weekdays, whereas for the residual oil and incineration sources the weekday/weekend differences were minimal, suggesting that commercial/industrial activity and output do not fluctuate noticeably during weekends within the city. The lower weekend PM mass and elemental constituents, as well as the estimated masses for source-related factors, suggest that traffic emissions are the primary drivers of the weekday/weekend differences observed in Jeddah, in line with previous investigations of air pollution trends in Jeddah (Alghamdi et al., Citation2014b; Porter Citation2015) that similarly observed decreased NOx levels during weekends. These findings are also consistent with the observations by other investigators elsewhere who have attributed the decrease in air pollution concentrations on weekends to the decrease in traffic density (Latha and Highwood, Citation2006; Lonati et al., Citation2006; Hassan et al., Citation2013). The lower reductions in PM2.5 concentration than PM2.5–10 and PM10 in weekends compared with weekdays additionally suggest that in spite of anthropogenic sources, PM2.5 has longer residence time in air than PM2.5–10 and PM10. Changes in PM concentration ratios of fine/coarse PM for weekends (0.29) versus weekdays (0.25) may be due to differences in road activities and traffic volume and may suggest that reduced traffic circulation on weekends affects the presence of particles in the coarse size range as a consequence of reduced associated emissions and resuspension of soil dust induced by traffic.
Concentration rose plots and backward trajectories
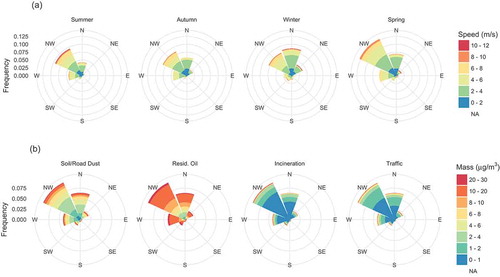
Concentration roses were plotted using the estimated mass for the identified source categories (). The predominant wind direction during the course of the study was from the northwest (38.9% of time), followed by north (23.6%) and west (17.9%), with greater frequency of occurrences of winds from the northwest during spring. The plots revealed that the source categories overall mainly originate from similar directions, although the daily wind direction was only significantly correlated with the factor loadings for PM2.5 residual oil burning (P < 0.05), indicating that local emissions from a point source is likely responsible. As the majority of the mass was indicated to be emanating from the west and northwest directions, the results here suggest that the oil refinery and shipyard located west of the sampling location, and the associated ship traffic in the northwest (), are the main sources for residual oil burning, likely from combustion of especially polluting bunker fuel.
Figure 5. Wind speed roses by season (a) and concentration roses for PM2.5 (b) identified source factors in Jeddah.
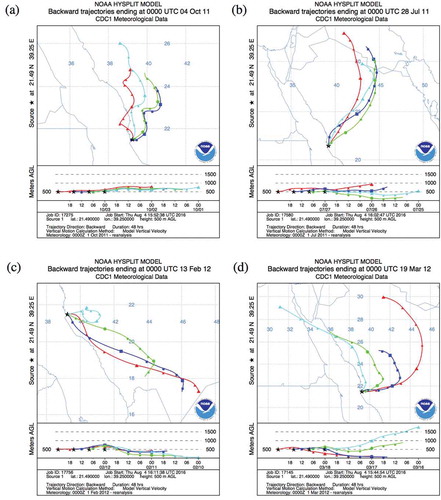
The interpretations from BT analyses are consistent with, and supplement, the findings from source apportionment. BT profiles were evaluated on sampling days on which estimated source mass estimates were among the highest 10% of values. depicts representative BTs, on days with the highest mass estimates for the four identified sources. For incineration, residual oil burning, and traffic factors, source origins were revealed to be largely local, not associated with any specific long-range wind directions, and with slow-moving air parcels. Figure 6a, which represents BTs on the day with the highest residual oil combustion concentration, depicts slow-moving air masses with low trajectories, indicating that the source is predominantly local. Figure 6b and c for the incineration and traffic factors, respectively, show largely local emissions but also some transport from distant regions. Figure 6d demonstrates that the soil/road dust factor on this day originated from the north and northeast as part of a dust storm event, with fast-moving wind parcels with high trajectories crossing over clay and loamy areas.
Figure 6. Representative backward trajectories at sampling location, on days with the highest concentration levels for respective estimated PM sources: (a) oil combustion; (b) incineration; (c) traffic; (d) soil/road dust.
Study implications
The results from this analysis augment findings from recent studies that have also characterized the composition of PM in the region. In Taif, Saudi Arabia, Shaltout et al. (2013) analyzed the elemental composition of summertime PM2.5 and observed significant contributions from soil and crustal sources to overall mass, whereas Nayebare et al. (2016), in Rabigh, Saudi Arabia, similarly found soil, followed by fossil fuel combustion, to be the primary contributors to overall PM2.5 mass. In nearby Kuwait City, Kuwait, Alolayan et al. (2013) identified major sources of PM2.5, finding significant sources to overall mass to be sand and soil (54%), oil combustion (18%), industry (12%), and traffic (11%). Sowlat et al. (Citation2013), in apportionment of PM10 in Ahvaz, Iran, found crustal dust (41%), industries and fossil fuel combustion (13%), motor vehicles (11%), and secondary aerosols (9.5%) to be the major sources. Taken together, the results from these studies are relatively consistent in regards to relative mass contribution of PM mass from different potential sources, pointing to soil and road dust, especially from dust storm events, as the primary source of PM in the country and the Middle East region, and with fossil fuel combustion and related industrial activities as also serving as significant contributors.
The profiles of the coarse and fine PM compositions that were delineated in this analysis hold implications regarding potential health effects attributable to air pollution in Jeddah. Due to the city’s topography and frequency of dust storm events during the pre-monsoon season, particles originating from windblown soil and road dust contribute significantly to both fine and coarse PM concentration levels. Studies in the past have shown generally positive associations between dust storm events and adverse health outcomes among locations worldwide, including in Asia (Lee et al., Citation2014), the United States (Crooks et al., Citation2016), and Europe (Stafoggia et al., Citation2016). Notably, dust storm occurrences and long-range transport of particles from the Sahara to the Mediterranean have demonstrated adverse health effects: Perez et al. (2008) found that during Saharan dust days, coarse PM increased mortality in Barcelona, Spain; similarly, Middleton et al. (Citation2008) found dust storm days to increase risk of hospitalization in Cyprus. The cumulative evidence from such studies suggests that the health risks and burdens attributable to crustal elements and related dust storm events are likely to be considerable in Jeddah and other Saudi locales.
In this study, the mass of PM2.5 attributable to residual oil burning (Ni, S, and V) in Jeddah nearly exceeded the annual U.S. PM2.5 standards (12 μg/m3), which suggests that policies aimed at controlling emissions from the identified potential point sources—the port and oil refinery west of the sampling site—has the potential to substantially reduce both the overall PM2.5 concentration levels in the city, as well as the associated adverse health effects. Several prior studies have demonstrated that PM2.5 originating from fossil fuel combustion is considerably more toxic than PM from natural sources. Ni and V significantly modified city-to-city variations in PM2.5 risk for both cardiovascular and respiratory hospitalizations among elderly persons in the United States, suggesting that PM2.5 effects are enhanced in locations with higher residual oil burning–related pollution (Bell et al., Citation2009). Residual oil combustion–related PM2.5 components also have been found to be related with cardiovascular disease (CVD) mortality in New York City (Ito et al., Citation2011), whereas PM2.5 from coal combustion, enriched in sulfate, had the strongest effect on long-term ischemic heart disease mortality risk within a large nationwide U.S. cohort (Thurston et al., Citation2016). Sulfates, a secondary aerosol component, have been found to play a role in inflammation and oxidative stress (Duvall et al., 2007) and elevated mortality risk (Laden et al., Citation2000) as well.
It must be noted that several of the elements that were not included in source apportionment analyses also had highly elevated concentration levels well above international standards, particularly arsenic, cadmium, and selenium, which are transition metals that have been linked to adverse health outcomes (Thurston et al., Citation2016). Overall, the mass and composition of particulate matter in Jeddah is likely to instigate occurrences of adverse health outcomes among city residents, highlighting the necessity for initiation of additional risk assessments and epidemiological studies within the city to determine whether implementation of emission controls for the identified point sources can improve public health in a cost-effective manner.
Study limitations
There are several limitations of this study that warrant further discussion. Exclusion of elements (As, Cd, Cl, Co, Ga, Na, Se, Rb) from the APCA due to missing values (higher than >20%) raises the potential possibility that potential sources may have been missed in the source apportionment, but their inclusion would have significantly reduced the numbers of complete samples, thereby limiting the statistical power of the analysis. Another concern is that elements and chemical constituents (e.g., elemental carbon and secondary components, such as organic compounds) that were not measured in this study similarly may have resulted in an inability to identify other potential sources (e.g., diesel vs. gasoline traffic emissions). Samples considered here were also collected from a single location, and as such we could not examine the spatiotemporal variability of PM mass and sources among the different districts within Jeddah, raising potential concerns regarding whether source profiles from a single location reflects the composition and trends of particulate matter within the entire city. However, the findings from this study are consistent with another recent source apportionment study that was conducted in Jeddah (Khodeir et al., Citation2012) at multiple locations but over a shorter time period (approximately 3 months), which identified similar sources for particulate matter, albeit with slightly different relative mass contributions between sources.
Conclusion
In this study, for the first time temporal variations of fine and coarse PM mass, elemental constituents, and potential sources in Jeddah were extensively analyzed, with results elucidating that seasonal trends are mainly influenced by natural sources and occurrences of dust storm events common in the region, whereas weekday/weekend differences are dominated by local anthropogenic activities, mainly traffic. The results here support and supplement findings from previous studies that have characterized the air quality in Jeddah, including source apportionment of PM2.5 and PM10 (Khodeir et al., Citation2012), as well as analyses of temporal trends of ozone and PM10 mass (Porter et al., Citation2015), benzene, toluene, ethylbenzene, and xylenes (BTEX; Alghamdi et al., Citation2014a), and NOx (Alghamdi et al., Citation2014b). The annual PM2.5 and PM10 concentration levels during the study period were found to substantially exceed the WHO air quality standards, reflecting the severity of pollution levels in Jeddah. However, as windblown sand and soil are higher contributors to PM mass in Jeddah than found in the other regions of the world (e.g., only 6% of PM2.5 in a recent U.S. source apportionment; Thurston et al., Citation2011), the makeup of the PM differed greatly from European and North American locations where the studies that the WHO ambient PM standards were based upon were conducted, raising concerns about applying those standards to the Middle East without local epidemiological evidence to support that policy. The main source of PM2.5–10 came from windblown soil and road dust, whereas the main source of PM2.5 was identified as residual oil burning likely generated from the port and oil refinery located west of the air sampler, suggesting that targeted emission control measures and policies have the potential to substantially reduce PM2.5 levels and the associated adverse health effects in Jeddah.
Funding
This study was funded by King Abdulaziz University (KAU), Jeddah, Saudi Arabia, under grant 4/00/00/252 and by the National Institute of Environmental Health Sciences (NIEHS) grant P30ES000260. The sponsors did not have any role in the study design.
Additional information
Funding
Notes on contributors
Chris C. Lim
Chris C. Lim and Jason Brocato are doctoral students in the Department of Environmental Medicine, New York University School of Medicine, New York, NY, USA.
George D. Thurston
George D. Thurston, Lung Chi Chen, and Max Costa are professors of environmental medicine, New York University School of Medicine.
Magdy Shamy
Magdy Shamy, Mamdouh Khoder, and Mansour Alghamdi are professors of environmental sciences, Faculty of Meteorology, Environment and Arid Land Agriculture, King Abdulaziz University, Jeddah, Saudi Arabia.
Abdullah M. Mohorjy
Abdullah M. Mohorjy is a professor of civil engineering, Faculty of Engineering, King Abdulaziz University.
Abdulrahman K. Alkhalaf
Abdulrahman K. Alkhalaf is a professor of meteorology, Faculty of Meteorology, Environment and Arid Land Agriculture, King Abdulaziz University.
References
- Abu-Allaban, M., A.W. Gertler, and D.H. Lowenthal. 2002. A preliminary apportionment of the sources of ambient PM10, PM2.5, and VOCs in Cairo. Atmos. Environ. 36:5549–57. doi:10.1016/S1352-2310(02)00662-3
- Aburas, H.M., M.A. Zytoon, and M.I. Abdulsalam. 2011. Atmospheric lead in PM2.5 after leaded gasoline phase-out in Jeddah City, Saudi Arabia. CLEAN Soil Air Water 39:711–9. doi:10.1002/clen.v39.8
- Alghamdi, M.A., M. Almazroui, M. Shamy, M.A. Redal, A.K. Alkhalaf, N.A. Hussein, and M.I. Khoder. 2015. Characterization and elemental composition of atmospheric aerosol loads during springtime dust storm in western Saudi Arabia. Aerosol Air Qual. Res. 15:440–53.
- Alghamdi, M.A., M. Khoder, A.S. Abdelmaksoud, R.M. Harrison, T. Hussein, H. Lihavainen, H. Al-Jeelani, M.H. Goknil, I.I. Shabbaj, F.M. Almehmadi, A.-P. Hyvarinen, and K. Hameri. 2014a. Seasonal and diurnal variations of BTEX and their potential for ozone formation in the urban background atmosphere of the coastal city Jeddah, Saudi Arabia. Air Qual. Atmos. Health 7:467–80.
- Aljoufie, M., M. Zuidgeest, M. Brussel, and M. van Maarseveen 2013. Spatial-temporal analysis of urban growth and transportation in Jeddah City, Saudi Arabia. Cities 31:57–68. doi:10.1016/j.cities.2012.04.008
- Alghamdi, M.A., M. Khoder, R.M. Harrison, A.P. Hyvarinen, T. Hussein, H. Al-Jeelani, A.S. Abdelmaksoud, M.H. Goknil, I.I. Shabbaj, F.M. Almehmadi, H. Lihavainen, M. Kulmala, and K. Hameri. 2014b. Temporal variations of O3 and NOx in the urban background atmosphere of the coastal city Jeddah, Saudi Arabia. Atmos. Environ. 94:205–14.
- Bell, M.L., K. Ebisu, R.D. Peng, J.M. Samet, and F. Dominici. 2009. Hospital admissions and chemical composition of fine particle air pollution. Am. J. Respir. Crit. Care Med. 179:1115–20. doi:10.1164/rccm.200808-1240OC
- Brook, R.D., S. Rajagopalan, C.A. Pope, J.R. Brook, A. Bhatnagar, A.V. Diez Roux, F. Holguin, Y. Hong, R.V. Luepker, M.A. Mittleman, A. Peters, D. Siscovick, S.C. Smith, L. Whitsel, and J.D. Kaufman. 2010. Particulate matter air pollution and cardiovascular disease: An update to the scientific statement from the American Heart Association. Circulation 121:2331–78. doi:10.1161/CIR.0b013e3181dbece1
- Campante, F., and D. Yanagizawa-Drott. 2015. Does religion affect economic growth and happiness? Evidence from Ramadan. Q. J. Econ. 130:615–58. doi:10.1093/qje/qjv002
- Chaloulakou, A., P. Kassomenos, N. Spyrellis, P. Demokritou, and P. Koutrakis. 2003. Measurements of PM10 and PM2.5 particle concentrations in Athens, Greece. Atmos. Environ. 37:649–60. doi:10.1016/S1352-2310(02)00898-1
- Cheung, K., N. Daher, W. Kam, M.M. Shafer, Z. Ning, J.J. Schauer, and C. Sioutas. 2011. Spatial and temporal variation of chemical composition and mass closureof ambient coarse particulate matter (PM10–2.5) in the Los Angeles area. Atmos. Environ. 45:2651–62. doi:10.1016/j.atmosenv.2011.02.066
- Crooks, J.L., W. Cascio, M. Percy, J. Reyes, L. Neas, and E. Hilborn. 2016. The association between dust storms and daily non-accidental mortality in the United States, 1993–2005. Environ. Health Perspect. 124:1735–43.
- Daher, N., A. Ruprecht, G. Invernizzi, C. De Marco, J. Miller-Schulze, J.B. Heo, M.M. Shafer, B.R. Shelton, J.J. Schauer, and C. Sioutas. 2012. Characterization, sources and redox activity of fine and coarse particulate matter in Milan, Italy. Atmos. Environ. 49:130–41. doi:10.1016/j.atmosenv.2011.12.011
- Draxler, R.R., D.A. Gillette, J.S. Kirkpatrick, and J. Heller. 2001. Estimating PM10 air concentrations from dust storms in Iraq, Kuwait and Saudi Arabia. Atmos. Environ. 35:4315–30. doi:10.1016/S1352-2310(01)00159-5
- Duvall, R.M., G.A. Norris, L.A. Dailey, J.M. Burke, J.K. McGee, M.I. Gilmour, T. Gordon, and R.B. Devlin. 2008. Source apportionment of particulate matter in the US and associations with lung inflammatory markers. Inhal. Toxicol. 20:671–83. doi:10.1080/08958370801935117
- Fang, G.C., Y.S. Wu, S.Y. Chang, S.H. Huang, and J.Y. Rau. 2006. Size distributions of ambient air particles and enrichment factor analyses of metallic elements at Taichung Harbor near the Taiwan Strait. Atmos. Res. 81:320–33. doi:10.1016/j.atmosres.2006.01.007
- Gerasopoulos, E., G. Kouvarakis, P. Babasakalis, M. Vrekoussis, J.-P. Putaud, and N. Mihalopoulos. 2006. Origin and variability of particulate matter (PM10) mass concentrations over the Eastern Mediterranean. Atmos. Environ. 40:4679–90. doi:10.1016/j.atmosenv.2006.04.020
- Han, Y., P. Du, J. Cao, and E.S. Postmentier. 2006. Multivariate analysis of heavy metal contamination in urban dusts of Xi’an, Central China. Sci. Total Environ. 355:176–186.
- Hassan, S.K., A.A. El-Abssawy, A.S. Abdel-Maksoud, M.H. Abdou, and M.I. Khoder. 2013. Seasonal behaviours and weekdays/weekends differences in elemental composition of atmospheric aerosols in Cairo. Aerosol and Air Quality Research. 5: 1552–62.
- Engelbrecht, J.P., et al. 2009. Characterizing mineral dusts and other aerosols from the Middle East—Part 2: Grab samples and re-suspensions. Inhal. Toxicol. 21:327–36.doi: 10.1080/08958370802464299
- Ito, K., R. Mathes, Z. Ross, A. Nadas, G.D. Thurston, and T. Matte. 2011. Fine particulate matter constituents associated with cardiovascular hospitalizations and mortality in New York City. Environ. Health Perspect. 119:467–73.
- Kadi, M.W. 2009. Soil pollution hazardous to environment: A case study on the chemical composition and correlation to automobile traffic of the roadside soil of Jeddah city, Saudi Arabia. J. Hazard. Mater. 168:1280–3. doi:10.1016/j.jhazmat.2009.03.015
- Khodeir, M., M. Shamy, M. Alghamdi, M. Zhong, H. Sun, M. Costa, L.-C. Chen, and M. Maciejczyk. 2012. Source apportionment and elemental composition of PM2.5 and PM10 in Jeddah City, Saudi Arabia. Atmos. Pollut. Res. 3:331–40. doi:10.5094/APR.2012.037
- Koçak, M., N. Mihalopoulos, and N. Kubilay. 2007. Contributions of natural sources to high PM10 and PM2.5 events in the eastern Mediterranean. Atmos. Environ. 41:3806–18. doi:10.1016/j.atmosenv.2007.01.009
- Kothai, P., I.V. Saradhi, P. Prathibha, P.K. Hopke, G.G. Pandit, and V.D. Puranik. 2008. Source apportionment of coarse and fine particulate matter at Navi Mumbai, India. Aerosol Air Qual. Res. 8:423–36.
- Krewski, D., M. Jerrett, R.T. Burnett, R. Ma, E. Hughes, Y. Shi, M.C. Turner, C. A. Pope III, G. Thurston, E.E. Calle, M. J. Thun, et al. 2009. Extended follow-up and spatial analysis of the American Cancer Society study linking particulate air pollution and mortality. Res. Rep. Health Eff. Inst. 140:5–114.
- Kulshrestha, A., P.G. Satsangi, J. Masih, and A. Taneja. “Metal concentration of PM 2.5 and PM 10 particles and seasonal variations in urban and rural environment of Agra, India.” Science of the Total Environment. 407:6196–204.
- Laden, F, LM. Neas, DW. Dockery, and J. Schwartz. 2000. Association of fine particulate matter from different sources with daily mortality in six U.S. cities. Environ. Health. Perspect. 108:941–7. doi:10.1289/ehp.00108941
- Latha, K.M., and E.J. Highwood. 2006. Studies on particulate matter (PM10) and its precursors over urban environment of Reading, UK. J. Quant. Spectrosc. Radiat. Transfer 101:367–79.
- Lee, H., Y. Honda, Y.H. Lim, Y.L. Guo, M. Hashizume, and H. Kim. 2014. Effect of Asian dust storms on mortality in three Asian cities. Atmos. Environ. 89:309–17. doi:10.1016/j.atmosenv.2014.02.048
- Lihavainen, H., M.A. Alghamdi, A.-P. Hyvärinen, T. Hussein, V. Aaltonen, A.S. Abdelmaksoud, H. Al-Jeelani, M. Almazroui, F.M. Almehmadi, F.M. Al Zawad, J. Hakala, M. Khoder, K. Neitola, T. Petaja, I.I. Shabbaj, and K. Hameri. K. Hämeri. 2016. Aerosols physical properties at Hada Al Sham, western Saudi Arabia. Atmos. Environ. 135:109–17. doi:10.1016/j.atmosenv.2016.04.001
- Lonati, G., M. Giugliano, and S. Cernuschi. 2006. The role of traffic emissions from weekends’ and weekdays’ fine PM data in Milan. Atmos. Environ. 40:5998–6011. doi:10.1016/j.atmosenv.2005.12.033
- López, M.L., S. Ceppi, G.G. Palancar, L.E. Olcese, G. Tirao, and B.M. Toselli. 2011. Elemental concentration and source identification of PM10 and PM2.5 by SR-XRF in Córdoba City, Argentina. Atmos. Environ. 45:5450–7. doi:10.1016/j.atmosenv.2011.07.003
- Loyola, J., P.B. de Almeida Jr., S.L. Quiterio, C.R. Sousa, G. Arbilla, V. Escaleira, M.I. de Carvalho, and A.S.A.G. da Silva. 2006. Concentration and emission sources of airborne metals in particulate matter in the industrial district of Medio Paraiba, State of Rio de Janeiro, Brazil. Arch. Environ. Contam. Toxicol. 51:485–93. doi:10.1007/s00244-005-0313-3
- Lough, G.C., J.J. Schauer, J-S. Park, M.M. Shafer, J.T. DeMinter, and J.P. Weinstein. 2005. Emissions of metals associated with motor vehicle roadways. Environ. Sci. Technol. 2005;39:826–36. doi:10.1021/es048715f
- Maciejczyk, P., M. Zhong, Q. Li, J. Xiong, C. Nadziejko, and L.C. Chen. 2005. Effects of subchronic exposures to concentrated ambient particles (CAPs) in mice: II. The design of a CAPs exposure system for biometric telemetry monitoring. Inhal. Toxicol. 17:189–97.doi:10.1080/08958370590912743
- Middleton, N., P. Yiallouros, S. Kleanthous, O. Kolokotroni, J.D. Schwartz, D.W. Dockery, P. Demokritou, and P. Koutrakis. 2008. A 10-year time-series analysis of respiratory and cardiovascular morbidity in Nicosia, Cyprus: The effect of short-term changes in air pollution and dust storms. Environ. Health 7:39. doi:10.1186/1476-069X-7-39
- Morawska, L., and J. Zhang. 2002. Combustion sources of particles. 1. Health relevance and source signatures. Chemosphere 49:1045–58. doi:10.1016/S0045-6535(02)00241-2
- Moreno, T., X. Querol, A. Alastuey, M. Viana, P. Salvador, A.S. de la Campa, B. Atinano, J. de la Rosa, and W. Gibbons. 2006. Variations in atmospheric PM trace metal content in Spanish towns: Illustrating the chemical complexity of the inorganic urban aerosol cocktail. Atmos. Environ. 40:6791–803. doi:10.1016/j.atmosenv.2006.05.074
- National Research Council. 2004. Research Priorities for Airborne Particulate Matter: IV. Continuing Research Progress. Washington, DC: National Academies Press.
- Peled, R., M. Friger, A. Bolotin, H. Bibi, L. Epstein, D. Pilpel, and S. Scharf. 2005. Fine particles and meteorological conditions are associated with lung function in children with asthma living near two power plants. Public Health 119:418–25. doi:10.1016/j.puhe.2004.05.023
- Pey, J., S. Rodríguez, X. Querol, A. Alastuey, T. Moreno, J.P. Putaud, and R. van Dingenen, 2008. Variations of urban aerosols in the western Mediterranean. Atmos. Environ. 42: 9052–62.
- Pope, C.A., M.C. Turner, R.T. Burnett, et al. 2014. Relationships between fine particulate air pollution, cardiometabolic disorders, and cardiovascular mortality. Circ Res. 116:108–15. doi:10.1161/CIRCRESAHA.116.305060
- Porter, W.C., M.A. K. Khalil, C.L. Butenhoff, M. Almazroui, A.K. Al-Khalaf, and M.S. Al-Sahafi. 2015. Annual and weekly patterns of ozone and particulate matter in Jeddah, Saudi Arabia. J. Air Waste Manage. Assoc. 64:817–26. doi:10.1080/10962247.2014.89393
- Saliba, N.A., F. El Jam, G. El Tayar, W. Obeid, and M. Roumie. 2010. Origin and variability of particulate matter (PM10 and PM2.5) mass concentrations over an Eastern Mediterranean city. Atmos. Res. 97:106–14.doi:10.1016/j.atmosres.2010.03.011
- Shahsavani, A., K. Naddafi, N. Jafarzade Haghighifard, A. Mesdaghinia, M. Yunesian, R. Nabizadeh, M. Arahami, M.H. Sowlat, M. Yarahmadi, H. Saki, M. Alimohamadi, and S. Nazmara. 2012. The evaluation of PM10, PM2.5, and PM1 concentrations during the Middle Eastern Dust (MED) events in Ahvaz, Iran, from April through September 2010. J. Arid Environ. 2012;77:72–83. doi:10.1016/j.jaridenv.2011.09.007
- Shaltout, A.A., J. Boman, Z.F. Shehadeh, D Al-Malawi. O.M allah R., Hemeda., and M.M Morsy. 2015. Spectroscopic investigation of PM2.5 collected at industrial, residential and traffic sites in Taif, Saudi Arabia. J. Aerosol Sci. 79:97–108. doi:10.1016/j.jaerosci.2014.09.004
- Spengler, J.D., and G.D. Thurston. 1983. Mass and elemental composition of fine and coarse particles in six US cities. J. Air Pollut. Control Assoc. 33:1162–71. doi:10.1080/00022470.1983.10465707
- Stafoggia, M., S. Zauli-Sajani, J. Pey, E. Samoli, E. Alessandrini, X. Basagaña, A. Cernigliaro, M. Chiusolo, M. Demaria, J. Diaz, A. Faustini, K. Katsoutanni, A.G. Kelessis, C. Linares, S. Marchesi, S. Medina, P. Pandolfi, N. Perez, X. Querol, G. Randi, A. Ranzi, A. Tobias, and F. Forastiere. 2016. Desert dust outbreaks in Southern Europe: Contribution to daily PM10 concentrations and short-term associations with mortality and hospital admissions. Environ. Health Perspect. 124:413–9.
- Stein, A.F., R.R Draxler, G.D. Rolph, B.J.B. Stunder, M.D. Cohen, and F. Ngan. 2015. NOAA’s HYSPLIT atmospheric transport and dispersion modeling system. Bull. Am. Meteorol. Soc. 96:2059–77. doi:10.1175/BAMS-D-14-00110.1
- Stone, E.A., S.C. Yoon, and J.J. Schauer. 2011. Chemical characterization of fine and coarse particles in Gosan, Korea during springtime dust events. Aerosol Air Qual. Res. 11:31–43. doi:10.4209/aaqr.2010.08.0069
- Sowlat, M.H., K. Naddafi, M. Yunesian, P.L. Jackson, S. Lotfi, and A. Shahsavani. 2013. PM10 source apportionment in Ahvaz, Iran, using positive matrix factorization. Clean Soil Air Water 41:1143–51. doi:10.4209/aaqr.2010.08.0069
- Taylor, S.R., and S.M. McLennan. 1985. The Continental Crust: Its Composition and Evolution. Oxford, UK: Blackwell Scientific Publications.Tecer, L.H., et al. 2012. Metallic composition and source apportionment of fine and coarse particles using positive matrix factorization in the southern Black Sea atmosphere. Atmos. Res. 118:153–69.
- Thurston, G.D., and J.D. Spengler. 1985. A quantitative assessment of source contributions to inhalable particulate matter in metropolitan Boston, Massachusetts. Atmos. Environ. 19:9–25. doi:10.1016/0004-6981(85)90132-5
- Thurston, G.D., R.T. Burnett, M.C. Turner, Y. Shi, D. Krewski, R. Lall, K. Ito, M. Jerrett, S.M. Gapstur, W.R. Diver, and C.A. Pope. 2016. Ischemic heart disease mortality and long-term exposure to source-related components of US fine particle air pollution. Environ. Health Perspect. 124:785–94.
- Thurston, G.D., K. Ito, and R. Lall. 2011. “A source apportionment of US fine particulate matter air pollution.” Atmospheric Environment. 45:3924–36.
- Turner, W, B. Olson, and G. Allen. 2000. Calibration of sharp cut impactors for indoor and outdoor particle sampling. J Air Waste Manage Assoc. 50:484–7. doi:10.1080/10473289.2000.10464043
- Wang, J., Z. Hu, Y. Chen, Z. Chen, and S. Xu. 2013. Contamination characteristics and possible sources of PM10 and PM2.5 in different functional areas of Shanghai, China. Atmos. Environ. 68:221–9. doi:10.1016/j.atmosenv.2012.10.070
- Yatkin, S., and A. Bayram. 2008. Source apportionment of PM10 and PM2.5 using positive matrix factorization and chemical mass balance in Izmir, Turkey. Sci. Total Environ. 390:109–23. doi:10.1016/j.scitotenv.2007.08.059
- Xu, L., X. Chen, J. Chen, F. Zhang, C. He, J. Zhao, and L. Yin. 2012. Seasonal variations and chemical compositions of PM2.5 aerosol in the urban area of Fuzhou, China. Atmos. Res. 104–105:264–72. doi:10.1016/j.atmosres.2011.10.017
- Xue, Y.H., J.H. Wu, Y.C. Feng, L. Dai, X.H. Bi, X. Li, T. Zhu, S.B. Tang, and M.F. Chen. 2010. Source characterization and apportionment of PM10 in Panzhihua, China. Aerosol Air Qual. Res. 10:367–77. doi:10.4209/aaqr.2010.01.0002
- Zhao, J., F. Zhang, Y. Xu, J. Chen, L. Yin, X. and Shang L. Xu. 2011. Chemical characteristics of particulate matter during a heavy dust episode in a coastal city, Xiamen, 2010. Aerosol Air Qual. Res. 11:299–308. doi:10.4209/aaqr.2010.09.0073