
ABSTRACT
This study sought to fill the gap in information about the type and the concentration of bioaerosols present in the air of biomethanization facilities (BF). Evaluation of bioaerosol composition and concentration was achieved in two biomethanization facilities located in Eastern Canada, during summer and winter. In order to have a thorough understanding of the studied environment, the methodology combined culture of bacteria and molds, qualitiative polymerase chain reaction (qPCR) for specific microorganisms, endotoxin quantification, and next-generation sequencing (NGS) for bacterial diversity. Results revealed that workers in biomethanization facilities are exposed to bioaerosols and pathogenic microorganisms similar to those found in composting plants. However, human exposure levels to bioaerosols are lower in BF than in composting plants. Despite these differences, use of personal protective equipment is recommended to lower the risks of health problems.
Implications: Biomethanization is a new technology used in eastern Canada for waste management. In the next few years, it is expected that there will be an expansion of facilities in response of tight governmental regulations. Workers in biomethanization facilities are exposed to various amounts of bioaerosols composed of some harmful microorganisms. Therefore, monitoring this occupational exposure could be an interesting tool for improving worker’s health.
Introduction
In the last few years, authorities have tightened regulations for the management of putrescible organic matter (POM) with a requirement to valorize with alternative technologies. Composting and biomethanization are processes used worldwide (Connaissances Des Énergies Citation2015; Wery Citation2014). Based on recent data, there were 17,240 biogas plants in Europe, with 10,786 in Germany alone (European Biogas Association Citation2015). Although biomethanization facilities (BF) are under development in Eastern Canada, biogas production in Canada is an emerging technology compared to European countries (Canadian Biogas Association Citation2016).
Since poor management of burial and decomposition of POM can lead to air, water, and soil contamination by microorganisms and chemical pollutants, effective confinement measures must be considered (Vieitez and Ghosh Citation1999).
Composting is a decomposition process involving microbial activity in aerobic and thermophilic conditions (Wery Citation2014). Biomethanization is an organic waste biodegradation process undergone by anaerobic microbes that produces mainly carbon dioxide and methane gas (Amarante Citation2010; ADEME Citation2015; Pain and Hepherd Citation1985). One of the main advantages of this process is that almost all types of organic waste can be digested, including cow manure, sewage sludge, municipal waste, and green waste (Holm-Nielsen, Al Seadi, and Oleskowicz-Popiel Citation2009; Macias-Corral et al. Citation2008; Ward et al. Citation2008). Produced biogas can be used for transportation or injected in the domestic biogas network, thus limiting the need for fossil fuel (Macias-Corral et al. Citation2008). As a result, less greenhouse gases are released into the atmosphere, making this technology cleaner and more lucrative than composting.
The delivery of organic matter is similar at composting sites and BF. In the reception area, trucks dump the POM into large bins. Delivery, handling, and shredding of degrading organic matter release bioaerosols and increase the microbial load in the air (Albrecht et al. Citation2007; Epstein et al. Citation2001; Le Goff et al. Citation2010; Sanchez-Monedero, Stentiford, and Urpilainen Citation2005; Schlosser et al. Citation2009; Vinneras, Schonning, and Nordin Citation2006; Wouters et al. Citation2006). These bioaerosols contain bacteria and molds that can potentially be hazardous to the health workers in these facilities (Searl Citation2008; Swan et al. Citation2003; Sykes et al. Citation2011; Wery Citation2014). Other examples of potentially dangerous compounds found in bioaerosols produced in facilities treating POM are endotoxins, microbial volatile organic compounds (MVOC), and β-D-glucans (Douwes et al. Citation2003; Schlosser et al. Citation2009; Sykes et al. Citation2011). Adverse reactions such as organic dust toxic syndrome (ODTS), respiratory and skin infections, and sensitization like bronchial asthma and extrinsic allergic alveolitis (farmer’s lung disease) are the main health problems that can be caused by bioaerosol exposure in composting and biomethanization plants (Bunger et al. Citation2000; Citation2007; Domingo and Nadal Citation2009; Heldal, Madso, and Eduard Citation2015; Poole and Wong Citation2013).
Few recommendations have been proposed for occupational exposure limits to bioaerosols. In Eastern Canada, the Institut de recherche Robert-Sauvé en santé et en sécurité du travail (IRSST) suggested a threshold value of 10,000 colony-forming units per cubic meter of air (CFU/m3) for total bacteria during 8 hr of exposure (Marchand, Lavoie, and Lazure Citation1995). In Poland, Dutkiewicz proposed higher limits: 105 CFU/m3 for total bacteria and 2 × 10⁴ CFU/m3 for gram-negative bacteria as well as thermophilic actinomycetes. This publication also suggested 5 × 10⁴ CFU/m3 for molds (Dutkiewicz Citation1997). In addition, a threshold of 90 endotoxin units per cubic meter of air (EU/m3) during 8 hr of exposure was proposed by the Dutch Expert Committee on Occupational Safety (DECOS) in 2010 (DECOS 2010).
Presence of specific microorganisms in compost and in the air of composting facilities, including Saccharopolyspora rectivirgula (SR), Legionella spp., and Legionella pneumophila, was mentioned in the literature (Casati et al. Citation2010; Conza, Pagani, and Gaia Citation2013; Schafer et al. Citation2013). SR is known to be one of the major agents responsible for farmer’s lung disease (Pepys et al. Citation1990; Reboux et al. Citation2001; Schafer et al. Citation2013; Wery Citation2014). When inhaled, L. pneumophila can cause a serious illness, called Legionnaire’s disease (Casati et al. Citation2010; Conza, Pagani, and Gaia Citation2013). Mycobacterium spp. were also detected in the air of three composting facilities (Bonifait et al. in press) and can cause bone, lung, skin, lymph, and joint infections (Prendki et al. Citation2008). Since these four microorganisms are potentially harmful for workers’ health, there is a need to investigate their presence in BF.
Despite these recommendations there is a paucity of information about bioaerosols found in biomethanization and occupational exposure. It is important to note that workers in the Eastern Canadian BF are exposed to bioaerosols from POM before their entry into the digesters. Therefore, they are not in contact with microorganisms enriched during the anaerobic biomethanization process. This anaerobic flora was not retrieved during air sampling because it did not represent workers’ exposure.
The aim of this study is to describe the bioaerosols concentrations in BF in terms of quantity and composition.
Materials and methods
Sampling sites
Two BFs located in Eastern Canada were selected to be part of this study. The first biomethanization facility (BF 1) processes, under mesophilic conditions, primary and secondary sludge from wastewater treatment plants, as well as domestic and agrifood industry POM. The second one (BF 2) handles municipal residual POM from domestic sources under thermophilic conditions. During the sampling period, the annual treatment capacity of BF 1 was 40,000 tons of POM, not including wastewater sludge. At BF 2, 27,000 tons of POM per year were treated. Because the technologies used were different as well as the annual treatment capacities, five sites were selected for sampling at BF 1 and two were selected at BF 2. They are listed in .
Table 1. Description of the selected biomethanization facilities sites.
Both facilities were visited one time during summer (BF 1 in July and BF 2 in August) and once during winter (BF 1 in January and BF 2 in February), in order to determine whether there is a seasonal effect.
Air sampling
Ambient air samples were collected at each site during activities where workers were present. For each site, six samples were taken with the six-stage Andersen microbial sampler, one sample was collected with the SASS 3100, and three with the 37-mm cassettes. An external control sample was also collected upwind of the facilities during the summer season only. Outdoor control air samples were not collected during winter because temperatures were too low, between −20 and −10°C, which would have resulted in damaging the air samplers.
Two samplers were used, the six-stage Andersen microbial sampler (AMS) (Andersen Instruments Inc., Atlanta, GA) for the culture of bioaerosols, and the SASS 3100 (Research International, Inc., Monroe, WA) high-efficiency sampler, for molecular assays. The AMS was used with a calibrated high-volume pump (Gast Manufacturing Inc., Benton Harbor, MI) at a flow rate of 28.3 L/min for 10 min. Each stage was loaded with a plastic petri dish containing tryptic soy agar (TSA) with amphotericin B (5 µg/mL) for bacteria growth and malt extract agar (MEA) with chloramphenicol (50 µg/mL) for fungal growth. Three samples were taken at each site at 30-min intervals, except for the “reception” and “treatment” sites, where two samples were taken. No samples were taken at the “storage and maturation” site in BF 1 during winter due to low temperatures, as already mentioned. All samples were kept at 4°C during transportation, which ranged between 4 and 10 hr, depending on the time the sample was taken (morning or afternoon) and the distance between the BF and the lab. The incubation period was 48 hr for bacteria and 7 days for mesophilic molds, both at 25°C. Enumeration of colonies was performed according to the positive-hole method (Andersen Citation1958). One sample consists of the sum of each AMS stage count, since this sampler divides the particles with regard to their aerodynamic diameter. Therefore, six values were pooled together to obtain a concentration. Number of colony-forming units per cubic meter of air (CFU/m3) was used to express the concentrations of culturable microorganisms.
A total of 30 m3 of air was sampled with the SASS 3100 (300 L/min for 100 min). Filters were kept at 4°C for 24 hr before the extraction and were eluted in 5 mL of the SASS extraction buffer. Three aliquots of 1.5 mL were taken and centrifuged (10 min at 14,000 × g). The pellets were stored at −20°C until DNA extraction.
DNA extraction
The PowerLyzer PowerSoil DNA Isolation Kit (MO BIO Laboratories, Carlsbad, CA) was used according to the manufacturer’s instructions for the extraction of total genomic DNA. Elution of air samples was performed in 100 µL of the supplied elution buffer. Samples were then stored at −20°C until quantitative polymerase chain reaction (qPCR) analysis.
Quantification of microorganisms by quantitative PCR
A Bio-Rad CFX384 thermocycler (Bio-Rad Laboratories, Mississauga, Canada) was used for DNA amplification. Primers and DNA probes used in this study are listed in and were purchased from Integrated DNA Technologies (Coralville, IA). qPCR mixtures and cycling protocols are presented in and , respectively. All standard curves were prepared with 10-fold dilutions of genomic DNA. Escherichia coli was used for total bacteria, L. pneumophila for both Legionella and L. pneumophila, Mycobacterium avium for Mycobacteria spp., and SR for S. rectivirgula. The results were analyzed using Bio-Rad CFX Manager software version 3.0.1224.1015 (Bio-Rad Laboratories, Mississauga, Canada).
Table 2. Primers and probes used for qPCR quantification of selected microorganisms.
Table 3. qPCR mixtures for each microorganism.
Table 4. qPCR cycling protocols for each microorganism.
Endotoxin quantification
Endotoxins were sampled with 37-mm cassettes containing binder-free glass fiber filters with a porosity of 1 µm (SKC, Inc., Eighty Four, PA), as described by Gilbert et al. (Citation2010). Calibrated pumps were used for a 3- to 4-hr sampling period depending on the workers’ activity and at a flow rate of 2 L/min (SKC, Inc., Eighty Four, PA). Three samples were taken at each site. Cassettes were kept at 4°C until their arrival at the lab, which was 4 hr later, and then were stored at −20°C for a period between 9 and 16 months. Filters were placed in 50 mL pyrogen-free conical tubes containing 20 mL of sterile pyrogen-free saline solution (0.85% NaCl) + 0.025% Tween 20. Agitation was performed with the Multi-Pulse Vortexer (Glas-Col, Terre Haute, IN) for 1 hr. Tubes were centrifuged (5 min, 453 × g) and supernatant was collected. Three aliquots of 1 mL were placed in sterile polypropylene tubes for long-term storage (−20°C). Remaining supernatant was used for the assay and kept in sterile pyrogen-free borosilicate tubes. The kinetic chromogenic Limulus amoebocyte lysate assay (Lonza, Walkersville, MD) without the β-G-blocker was used for endotoxin quantification according to the manufacturer’s instructions. An inhibition/enhancement test was performed prior to the actual quantification to determine the appropriate dilution of the samples.
Next generation sequencing (NGS)
MiSeq sequencing
Samples were submitted to the Plateforme d’analyses génomiques de l’Institut de Biologie Intégrative et des Systèmes (IBIS, Université Laval). After DNA fragmentation, sequencing libraries were prepared using primers that included a linker sequence, the barcodes, and an Illumina adaptor. Amplification of the 16S V6–V8 region was performed using the sequence specific regions described in Comeau et al. (Citation2011) using a two-step dual-indexed PCR approach specifically designed for Illumina instruments by the IBIS team. This process is referred to as “two-step PCR.” During the first step, the gene specific sequence was fused to the Illumina TruSeq sequencing primers and PCR was carried out in a total volume of 25 µL that contains 1× Q5 buffer (New England Biolabs, NEB), 0.25 µM of each primer, 200 µM of each deoxynucleotide (dNTP), 1 U of Q5 high-fidelity DNA polymerase (NEB), and 1 µL of template cDNA. The PCR began with an initial denaturation at 98°C for 30 sec, followed by 35 cycles of denaturation at 98°C for 10 sec, annealing at 55°C for 10 sec, extension at 72°C for 30 sec and a final extension at 72°C for 2 min. The PCR reaction was purified using the Axygen PCR cleanup kit. Quality of the purified PCR product was checked using a 1% agarose gel. Dual-indexed barcodes were added to purified product that had been diluted 50- to 100-fold. The cycling sequence for the second PCR was identical to the first PCR but with 12 cycles instead of 35. PCR reactions were purified as already described, checked for quality on a DNA7500 Bioanlayzer chip (Agilent), and then quantified spectrophotometrically with the Nanodrop 1000 (Thermo Fisher Scientific). Barcoded amplicons were pooled in equimolar concentration for sequencing on the illumina Miseq.
The first step amplified the target gene specifically, using the primers PCR1 forward, 5'ACACTCTTTCCCTACACGACGCTCTTCCGATCTACGCGHNRAACCTTACC3', and PCR1 reverse, 5'GTGACTGGAGTTCAGACGTGTGCTCTTCCGATCTACGGGCRGTGWGTRCA3'. The second amplification used the barcoding reaction(s) PCR2 forward, 5'AATGATACGGCGACCACCGAGATCTACAC[index1]ACACTCTTTCCCTACACGAC3', and PCR2 reverse, 5'AAGCAGAAGACGGCATACGAGAT[index2]GTGACTGGAGTTCAGACGT GT3'. Samples were multiplexed and paired-end sequenced (two times 300 bp) on an Illumina MiSeq platform using dual indexing (Illumina, Inc.). Note that primers used in this work contain Illumina-specific sequences protected as intellectual property (Oligonucleotide sequences © 2007–2013, Illumina, Inc., all rights reserved). Derivative works created by Illumina customers are authorized for use with Illumina instruments and products only. All other uses are strictly prohibited.
Bioinformatics work flow for processing and analyzing sequencing data
The first step of the bioinformatics work flow consisted of demultiplexing the raw FASTQ files in order to group every sequence with the sample it belongs to. The reads generated from the paired-end sequencing were combined using mothur v1.35.1 (Schloss et al. Citation2009). The latter mothur command is implemented with a quality filtering option that was used to discard reads with ambiguous sequences and abnormal lengths. Similar sequences were merged for computational efficiency using the mothur’s unique.seqs command. Afterward, the sequences were aligned using the bacterial reference database SILVA with the align.seqs command. The UCHIME algorithm, which is implemented in mothur, was used to identify and remove chimeric sequences. Subsequently, all sequences with 97% similarity were clustered together using UPARSE (version 7.1). This clustering generated a fasta file containing unique operational taxonomic units (OTUs). Quantitative Insights Into Microbial Ecology (QIIME) version 1.9.0 (Caporaso, et al. Citation2010) was used to assign taxonomy to OTUs based on the SILVA reference database set for taxonomic assignment and to generate an OTU table containing information about the identity of each OTU and their occurrence in each sample. All of the visualization analyses, including richness/diversity indices, and taxonomic analyses, were performed using QIIME scripts (version 1.9.0).
Because of the great difference between seasons in Eastern Canada (more than 40ºC) and the type of technology used, as well as the POM origins in both facilities, comparisons of seasons (summer or winter) and facilities (BF 1 or BF 2) were performed. Difference between sites was not assessed for the NGS analysis because some samples were not concentrated enough for the MiSeq sequencing. The 20 most abundant genera for each condition were selected for analysis.
Statistical analysis
A linear polynomial regression was performed to explain the relationship between culture and qPCR values.
Results
Since for the outdoor controls, which were taken at each visit for culture, qPCR, endotoxin, and NGS showed low bioaerosols concentrations and since the nature of the observed microorganisms was different from what was observed at the sampling sites, the control data were used as a reference to make sure that the source was indoor. For the endotoxin cassettes, blanks were subtracted from the samples prior to analysis to remove possible background.
Comparison of bacterial culture and qPCR
The correlation between qPCR and culture for total bacteria at each sampling site during summer and winter is presented in . The qPCR results are shown as 16S copies per cubic meter of air (16S copies/m3). Culture results are presented as CFU per cubic meter of air. The correlation was used to show whether the molecular biology methods could replace the culture approach.
Figure 1. Correlation of total bacteria for qPCR and culture at both facilities during summer and winter.
For total bacteria, there is a stronger correlation during summer (R2 = 0.4383; p = 0.04) than during winter (R2 = 0.6620; p = 0.07). qPCR led to a higher estimation of concentration than culture methods by up to 3 orders of magnitude. The dotted line represents the recommended value of 10,000 CFU/m3 for total bacteria/m3 established by IRSST (Marchand, Lavoie, and Lazure Citation1995). Three sites exceed this recommended concentration, the “reception” site and the “mixer and buffer tanks” in BF 2 during summer, as well as the “treatment” site in BF 1 during winter. However, the suggested concentration of 105 CFU/m3 by Dutkiewicz was never exceeded (Dutkiewicz Citation1997).
Culture of mesophilic molds
The concentrations of mesophilic molds obtained with culture are presented in . For each facility, the amounts are higher during summer with medians between 2.0 × 10³ to 2.3 × 10⁴ CFU/m3. These values are lower during winter, ranging from 3.0 × 101 to 2.0 × 10³ CFU/m3. All concentrations are below the proposed threshold of 5 × 10⁴ CFU/m3 by Dutkiewicz (Citation1997).
Figure 2. Concentrations of mesophilic molds (CFU/m3) in both facilities during summer and winter.
Quantification of microorganisms with qPCR
qPCR analysis was performed for four microorganisms shown to be potentially hazardous to human health. These are Saccharopolyspora rectivirgula, Legionella spp., L. pneumophila, and Mycobacterium spp. The results are compiled in for summer and for winter.
Table 5. qPCR detection of specific airborne microorganisms found in biomethanization facilities during summer (16S copies/m3).
Table 6. qPCR detection of specific airborne microorganisms found in biomethanization facilities during winter(16S copies /m3).
The detection limits for each microorganism are shown below the two tables, ranging from 5 to 5 × 101 16S copies/m3. The symbol <DL (in and ) indicates that the concentrations were below these detection limits.
SR was found only during summer at the second facility, between 5.4 × 101 and 1.3 × 10³ 16S copies/m3. A concentration of 3.6 X 101 16S copies/m3 of Legionella spp. was found at one site in BF 1 during summer. However, L. pneumophila was not detected. Mycobacteria results were well above the detection limits in both facilities and ranged from 5.2 × 10² to 4.6 × 10⁵ 16S copies/m3 during summer and 7.3 × 10² and 4.1 × 10⁵ 16S copies/m3 during winter.
Endotoxin quantification
shows the endotoxin concentrations found for both facilities during summer and winter. The detection limit of the assay is <0.004 endotoxin units per milliliter (EU/mL). Due to varying sampling times, the detection limit, when transformed into EU/m3, has a value between <1.20 and <1.45 EU/m3. All external controls were below the detection limit and are not presented in . Endotoxin concentrations above the recommendation of 90 EU/m3 were not detected. Concentrations were below the detection limit during summer at the BF 1 “reception,” “treatment,” and “press filters” sites. The “storage,” “press filters,” and “output of finished product” at BF 1 during winter were also below the detection limit. Endotoxin concentrations were lower at BF 1 than BF 2 during summer, with 4.7 ± 0.2 EU/m3 for the “storage and maturation” site and 5.5 ± 5.1 EU/m3 for the “output of finished product” compared to 53.2 ± 33.1 EU/m3 for the “reception” site and 68.2 ± 17.8 for the “mixer and buffer tank” site. During winter, higher concentrations were detected at BF 1 with 29.4 ± 13.2 EU/m3 for the “reception” site and 3.9 ± 4.0 EU/m3 for the “treatment” site compared to those found at BF 2, which were 2.0 ± 0.5 EU/m3 for the “reception” site and 1.7 ± 0 EU/m3 for the “mixer and buffer tank” site.
Table 7. Endotoxin concentrations (EU/m3) at each sampling site during summer and winter.
Next-generation sequencing (NGS)
In total, 313,344 sequences were recovered with the SASS 3100 and grouped in 4859 OTUs. A maximum rarefaction depth of 8,000 sequences was used prior to the calculation of α diversity indices, which are Chao1, Simpson, and Shannon. These indices are widely used to describe the diversity/richness of samples in microbial ecology studies. The results are presented as boxplots in . Median and standard deviation are 827.86 ± 1 403.72, 0.98 ± 0.05, and 6.94 ± 1.87, respectively.
Figure 3. Comparison of α diversity indices from 12 air samples from two Eastern Canada BF: (a) Chao1, (b) Simpson, and (c) Shannon.
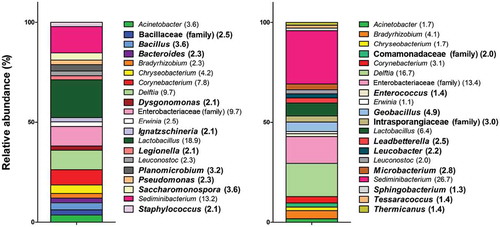
shows the differences between the genera detected during summer and winter. Ten genera are specific to a season (bold). Bacillaceae (family), Bacillus, Bacteroides, Dysgonomonas, Ignatzschineria, Legionella, Planobacterium, Pseudomonas, Saccharomonospora, and Staphylococcus are the 10 genera specific for the summer season. For winter, the specific genera are Comamonadaceae (family), Enterococcus, Geobacillus, Intrasporangiaceae (family), Leadbetterella, Leucobacter, Microbacterium, Sphigobacterium, Tessaracoccus, and Thermicanus. The common genera for both seasons are Acinetobacter, Bradyrhizobium, Chryseobacterium, Corynebacterium, Delftia, Enterobacteriaceae (family), Erwinia, Lactobacillus, Leuconostoc, and Sediminibacterium. The relative abundance of all bacteria is shown in parenthesis after each name. For the majority of bacteria, the proportions vary, sometimes greatly. For example, the relative abundance of Lactobacillus is 18.9% during summer, but 6.4% during winter.
Figure 4. Bacterial diversity found in bioaerosols from two BF during summer (left) and winter (right) presented as the relative abundance (%) of the 20 most abundant genera for each season. Specific genera to a BF are shown in bold characters.
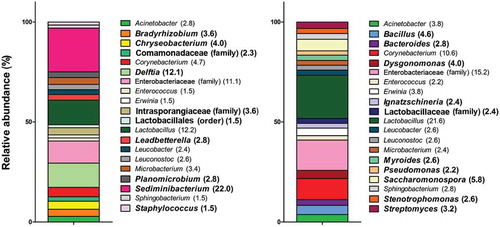
Differences in diversity in samples from both facilities are presented in . Ten genera are common in both types of facilities but the proportions differ. Ten genera are present only in one facility. In BF 1, these genera are Bradyrhizobium, Chryseobacterium, Comamonadaceae (family), Delftia, Intrasporangiaceae (family), Lactobacillales (order), Leadbetterella, Planobacterium, Sediminibacterium, and Staphylococcus. In BF 2, they are Bacillus, Bacteriodes, Dysgonomonas, Ignatzschineria, Lactobacillaceae (family), Myroides, Pseudomonas, Saccharomonospora, Stenotrophomonas, and Streptomyces. The 10 common genera for both facilities are Acinetobacter, Corynebacterium, Enterobacteriaceae (family), Enterococcus, Lactobacillus, Leucobacter, Leuconostoc, Microbacterium, and Sphingobacterium. Again, the proportions of the genera vary between the facilities, but Entorobacteriaceae (family) and Lactobacillus are the two main genera present in BF 1 and BF 2.
Figure 5. Bacterial diversity found in bioaerosols from BF 1 (left) and BF 2 (right) presented as the relative abundance (%) of the 20 most abundant genera for each facility. Specific genera to a BF are shown in bold characters.
The four targeted microorganisms in qPCR were also found with the NGS analysis. Mycobacterium, Legionella, and Saccharopolyspora genera were all present in the NGS results. The L. pneumophila species was found with the NGS, but the S. rectivirgula species was not. S. hirsuta was detected instead.
Discussion
Total bacterial quantification comparison using culture and qPCR
A correlation between the results from the two approaches was observed. Higher concentrations of bacteria are normally observed with qPCR than with culture. This is because qPCR can detect nonviable and nonculturable microorganisms and also because bacterial cells can contain up to 15 16S gene copies (Klappenbach et al. Citation2001). It is well known that less than 1% of all microorganisms can be cultivated in lab settings (Amann, Ludwig, and Schleifer Citation1995). Thus, the culture method often underestimates the microbial load from environmental samples. A previous study by Nehme et al. found that qPCR detection in swine confinement buildings was 100 to 1000 times higher than what was found using culture (Nehme et al. Citation2009). In BF, it varied between one and three orders of magnitude depending on the site.
Since the recommended threshold exposure value of 10,000 CFU/m3 for total bacteria is exceeded at three sites, workers in these areas could be exposed to high bioaerosol concentrations that may lead to health problems. Characterization of bioaerosols in BF is new and therefore there is a dearth of scientific information on this topic. Concentrations of total bacteria can reach 108 CFU/m3 in composting plants (Bru-Adan et al. Citation2009), compared to 104 CFU/m3 in BF. However, Nadal et al. recovered a median bacterial concentration of 2.0 × 10³ CFU/m3 in a composting reception site (Nadal et al. Citation2009). Because the reception step for POM is similar in composting and biomethanization facilities, comparing the median concentrations of bacteria obtained in BF with the latter value could be more accurate. Median concentrations of 3.7 × 10³ CFU/m3 during summer and 3.2 × 10² CFU/m3 during winter were found in BF, which are comparable to the concentrations observed at the composting reception sites. Because the two facilities were still in a running-in period, lower quantities of POM were treated compared to the targeted ones during normal operations. Therefore, the observed concentrations could underestimate the full-scale activity workers’ exposure.
Using culture and molecular approaches helps to get a more representative picture of the environment being examined. As described by Shade et al., the combination of culture-independent and culture-based methods leads to the retrieval of a wider number of taxa. Indeed, the Venn diagram shows that some of them were found with both approaches, but others were detected solely with culture or culture-independent approaches. The other observation they made is that taxa found with culture were most of the time not detected with the culture-independent method, which shows the complementarity of both approaches for the description of an environment (Shade et al. Citation2012).
Culture of mesophilic molds
Zucker and Müller have shown that microbial concentrations found in composting facilities are affected by seasons (Zucker and Muller Citation2004). This supports the variation between the median fungal concentrations obtained in BF during summer and winter. In a composting reception area, Nadal et al. found a median fungal concentration of 6.0 × 10² CFU/m3 (Nadal et al. Citation2009), which is similar to the winter values we observed. On the contrary, summer concentrations were up to 2 orders of magnitude higher. Because the suggested threshold of 5 × 10⁴ CFU/m3 molds is not exceeded, health risks for workers in BF seem to be limited. These concentrations could also be lower than expected due to the run-in period for both facilities.
Specific quantification of microorganisms of interest using qPCR
Workers in BF are only exposed to bioaerosols generated during POM preprocessing before the anaerobic treatment step that occurs inside the digesters. The POM treated in the two BF were usually fresh (raw vegetables and table waste), different from POM in composting plants. Therefore, it was suspected that thermophilic microorganisms would not be present in high concentrations in BF since the material likely did not undergo a heating process.
It is well documented that the thermophilic actinomycete SR is a contaminant found in compost and in the air of composting facilities (Duchaine et al. Citation1999; Schafer et al. Citation2013). It has been recently established that SR is one of the major agents responsible for causing extrinsic allergic alveolitis, or farmer’s lung disease (Douwes et al. Citation2003; Duchaine et al. Citation1999). Great concentrations of airborne SR, ranging from 1.2 × 10² to 1.5 × 10⁷ cells/m3, were found with qPCR in composting facilities (Schafer et al. Citation2013). Because POM in BF does not undergo a thermophilic phase before entering the biomethanization process in the digesters, it is not surprising that concentrations of SR in BF 1 are below the qPCR detection limit. During the summer season at BF 2, it was observed that POM had spent 4 days in the container inside the facility. Hence, the POM were in aerobic conditions, allowing early stages of the composting process and the growth of thermophilic microorganisms. A mechanical shovel was also used to move the POM within the reception bin. These two factors may explain why higher concentrations of SR were detected in BF 2 during summer.
Legionella is normally found in water, but studies have highlighted the presence of this bacterium in compost (O’Connor et al. Citation2007; Steele, Moore, and Sangster Citation1990; Whiley and Bentham Citation2011). Legionella pneumophila is a respiratory pathogen and is responsible for Legionnaires’ disease, which causes pneumonia, and Pontiac fever, with flu-like symptoms (PHAC Citation2011). Conza et al. found L. pneumophila in the air of composting plants (Conza, Pagani, and Gaia Citation2013). Two other studies suggested pulmonary diseases were related to Legionella in composting facilities and also in domestic composting (Bru-Adan et al. Citation2009; Le Goff et al. Citation2010). Because of these findings, it was suspected that airborne Legionella spp. could be present in BF. This bacterial genus was only found in the “output of finished product” site at a concentration of 3.6 × 101 16S copies/m3. Compared to the findings of Bonifait et al. of up to 1.9 × 10⁵ 16S copies/m3 in composting plants (Bonifait et al. in press), Legionella does not seem to be a major component of bioaerosols in BF. However, it is important to keep in mind that this study took place in two facilities during full running-in periods.
Mycobacterium spp. are bacteria found in nature. Some species such as M. tuberculosis, M. africanum, M. bovis, and M. fortuitum are human pathogens (Brosch et al. Citation2002; Hand and Sanford Citation1970). Because M. tuberculosis is transmitted through bioaerosols (Centers for Disease Control and Prevention [CDC] 2013), the evaluation of Mycobacterium spp. presence in the air in BF was a priority. Bonifait et al. showed that there are large concentrations of mycobacteria in composting facilities, ranging from 4.5 × 10² to 2.4 × 10⁷ 16S copies/m3 (Bonifait et al. in press). The high concentration of Mycobacterium spp. in BF suggests that detection of these bacteria is of great importance in facilities treating POM. Species identification using NGS could be useful to determine whether the species found are potentially harmful to workers’ health.
Ventilation is another factor that needs to be considered during bioaerosol exposure assessments. At the two facilities, general ventilation as well as source extraction systems were present. During the summer, the doors were opened more often than during winter, thus increasing air change rates and allowing the entry of microorganisms from the outdoor environment. The recommended air change rate for this kind of activity is six changes per hour (Environnement Canada Citation2013).
Endotoxin quantification
β-D-Glucans is a compound present in the cell wall of fungi (Bowman and Free Citation2006). Since molds have been detected in BF and no β-G-blocker was used during the endotoxin assay, the concentrations obtained express the combined concentrations of endotoxins and β-D-glucans.
Workers’ exposure to endotoxin levels above the recommendation of 90 EU/m3 for an 8-hr period may cause various health problems. The results presented in support the conclusion that the health risks for BF workers currently employed in these two facilities is negligible. However, because only two BF in use during this project were in Eastern Canada, the results and conclusions of this study are only applicable for those two BF. Higher or lower endotoxin concentrations could be detected in other BF depending on various factors including the composition of the treated POM and the confinement, as well as the ventilation of the facilities. The data provided will certainly guide the elaboration and the construction of future BF in order to limit worker’s exposure.
In comparison, the ambient median endotoxin concentrations found in compost facilities were ranging from 4.86 and 23.48 EU/m3 depending on activity levels. Maximum concentrations between 106.93 and 476.23 EU/m3 were also detected. Therefore, the possibility of concentration peaks in BF cannot be set aside. This is always the case with point sampling.
Next-generation sequencing (NGS)
The use of a high-efficiency sampler with the NGS method allowed the recovery of a substantial number of OTUs in a total of 12 air samples. Compared to the 1211 OTUs obtained with a wet-cyclone air sampler, 4859 OTUs is a considerably higher number. These OTUs were then grouped into 217 genera.
The three α diversity indices () show that richness/diversity of BF air samples is somewhat high, with a great standard deviation. Therefore, this indicates that there is a variability in the microbial composition of air samples. These indices use different calculation methods and have different outcomes. It is not surprising to have different magnitudes in the results. The Chao1 index measures the richness of a sample. A high number means that the richness is higher as well. The median and standard deviation values obtained (827.86 ± 1 403.72) show that the composition of some air samples is especially rich, but that there is an important variation between them. The diversity of a sample combines species richness and abundance into a single value of evenness. For that matter, the Shannon and Simpson indices were used. The Simpson index ranges between 0 and 1. A value close to 1 means that the diversity is very high, which is the case with the air samples of the present study (0.98 ± 0.05). The Shannon index ranges from 0 to 10 and is also used to determine the diversity of sample. Compared to the Simpson index, the variation between the samples is higher with the Shannon index, with the value of 6.94 ± 1.87.
Due to the large number of genera, only the 20 most abundant genera for each condition (summer, winter, BF 1 or BF 2) are shown in and . It is not excluded that specific genera in summer or in BF 1 could be found in winter or in BF 2, but in lower proportions. For presentation purposes, a large part of the diversity is not shown in these graphs.
The difference in bacterial diversity found in the air of BF could be related to factors such as the source of the POM and the treatment process. Differences in the POM were noted between the facilities. In BF 1, during the sampling period, the majority of the POM was composed of fruits and vegetables from table waste and supermarkets. Leaves, branches, paper, vegetables, and fruits were treated in BF 2. It was noticed that some bacteria were found more often and in larger proportions.
Lactobacillus is a genus that is always present in BF bioaerosols. It represents between 6.4% and 21.6% of the most abundant genera. This is not surprising, considering the fact that these bacteria can ferment vegetables and fruits (Vos et al. Citation2009).
Leuconostoc is another example of airborne bacteria that are source dependant. This microorganism was found in both facilities as well as both season and is responsible for the early stages of cabbage fermentation (Vos et al. Citation2009). A great amount of this vegetable was used in biomethanization during air sampling.
Sediminibacterium was previously isolated from sediments of a eutrophic reservoir (Qu and Yuan Citation2008) and ginseng field soil sample (Kim et al. Citation2013). It is a strict aerobe or facultative anaerobe bacterium, depending on the species. To our knowledge, its presence in POM has not been reported, but the results show that it is an important genus in BF bioaerosols. However, Sediminibacterium was not present in the 20 most abundant genera of BF 2.
Delftia is a strict aerobic bacterium of the Comamonadaceae family (Wen et al. Citation1999; Willems et al. Citation1991). The five species of this genus were previously isolated from soil (Li et al. Citation2015; Wen et al. Citation1999), activated sludge (Shigematsu et al. Citation2003), and fresh water (Chen et al. Citation2012; Jorgensen et al. Citation2009). In the present study, this genus was found during summer (9.7%) and winter (16.7%) and in BF 1 (12.7%). It was not a part of the 20 most abundant genera of BF 2.
The Enterobacteriaceae family was also present during both seasons and at both facilities, at between 9.7% and 15.2%. It is a large family of bacteria with great ecology heterogeneity (Brenner, Krieg, and Staley Citation2009).
As mentioned above, POM in BF 2 during summer was subject to aerobic conditions for 4 days. Also, a mechanical shovel was used for agitation and mixing of the POM. Aerobic condition may influence the microbial growth and community and mechanical mixing promotes aerosolization, thus impacting the observed results showing high bioaerosols concentration.
In a review study, Wéry presented the most abundant bacterial genera and species found in bioaerosols from composting facilities (Wéry Citation2014). These microorganisms were not collected during POM reception but in later stages, such as turning of compost piles during the thermophilic phase and screening of mature compost. Ten dominant genera (Acinetobacter, Bacillus, Clostridium, Corynebacterium, Delftia, Geobacillus, Microbacterium, Pseudomonas, Saccharomonospora, and Staphylococcus) present in BF were also found in composting facilities using a culture-independent approach.
SNG analysis allowed the identification of L. pneumophila, even if this bacterium was not found with qPCR. The main hypothesis is that concentrations may have been too low to allow qPCR detection. For S. rectivirgula, the opposite scenario was obtained, that is, only qPCR permitted its detection. Factors such as the database used, the specific qPCR protocol sensitivity (quantification), and the universal one (prior to sequencing) could explain these results.
Conclusion
Evaluation of bioaerosol composition and concentration was achieved using culture, qPCR, endotoxin quantification, and NGS in two biomethanization facilities. However, because only two BF were functional in Eastern Canada during the sampling period and samples were taken in a limited time frame, the nature of the project remains exploratory. Evaluation of future sites could allow the validation of the obtained results or could highlight completely different situations. This project could at least be used as a basal reference to minimize occupational risks at these future facilities. IOM cassettes could be used to evaluate the composition of the bioaerosols’ inhalable fraction and to better estimate the occupational exposure. Because the amount of treated POM using this technology will likely be higher in the near future, workers should be encouraged to use personal protective equipment including respiratory protection and gloves to limit the potential risk of health problems.
Acknowledgment
This project was funded by the Institut Robert Sauvé en Santé et Sécurité du Travail du Québec (IRSST 2013-0013). Marie-Eve Dubuis received a scholarship from National Sciences and Engineering Research Council (NSERC). We are thankful to Dr. Laetitia Bonifait for her technical assistance and to Amanda Kate Toperoff for English revision of the manuscript.
Additional information
Notes on contributors
Marie-Eve Dubuis
Marie-Eve Dubuis is a PhD student at the Department of Biochemistry, Microbiology and Bioinformatics at Université Laval and at the Centre de Recherche de l’Institut Universitaire de Cardiologie et de Pneumologie de Québec – Université Laval.
Hamza M’Bareche
Hamza Mbareche is a PhD student at the Department of Biochemistry, Microbiology and Bioinformatics at Université Laval and at the Centre de Recherche de l’Institut Universitaire de Cardiologie et de Pneumologie de Québec – Université Laval.
Marc Veillette
Marc Veillette is a research assistant at the Centre de Recherche de l’Institut Universitaire de Cardiologie et de Pneumologie de Québec – Université Laval. Bouchra Bakhiyi is a research assistant at Université de Montréal.
Bouchra Bakhiyi
Bouchra Bakhiyi is a research assistant at Université de Montréal.
Joseph Zayed
Joseph Zayed is a consultant at the Institut de recherche Robert-Sauvé en santé et en sécurité du travail and an associate professor at Université de Montréal.
Jacques Lavoie
Jacques Lavoie is a researcher at the Institut de recherche Robert-Sauvé en santé et en sécurité du travail.
Caroline Duchaine
Caroline Duchaine is a professor at the Department of Biochemistry, Microbiology and Bioinformatics at Université Laval and a researcher at the Centre de Recherche de l’Institut Universitaire de Cardiologie et de Pneumologie de Québec – Université Laval.
References
- ADEME. 2015. Méthanisation: Fiche technique. Angers/ Service Prévention et Gestion des Déchets Direction Consommation Durable et Déchets.
- Albrecht, A., R. Witzenberger, U. Bernzen, and U. Jackel. 2007. Detection of airborne microbes in a composting facility by cultivation based and cultivation-independent methods. Annals of Agricultural and Environmental Medicine 14 (1):81–5.
- Amann, R.I., W. Ludwig, and K.H. Schleifer. 1995. Phylogenetic identification and in-situ detection of individual microbial-cells without cultivation. Microbiological Reviews 59 (1):143–69.
- Amarante, J. A. L. 2010. Biométhanisation des déchets putrescibles municipaux—Technologies disponibles et enjeux pour le Québec. Centre Universitaire de Formation en Environnement, Université de Sherbrooke. https://www.usherbrooke.ca/environnement/fileadmin/sites/environnement/documents/Essais2010/Amarante_J__10-07-2010_.pdf (accessed 7 September 2015)
- Andersen, A.A. 1958. New sampler for the collection, sizing, and enumeration of viable airborne particles. Journal of Bacteriology 76 (5):471–84.
- Bach, H.J., J. Tomanova, M. Schloter, and J.C. Munch. 2002. Enumeration of total bacteria and bacteria with genes for proteolytic activity in pure cultures and in environmental samples by quantitative PCR mediated amplification. Journal of Microbiological Methods 49:235–45. doi:10.1016/s0167-7012(01)00370-0.
- Bonifait, L., G. Marchand, M. Veillette, H. M’Bareche, M.-E. Dubuis, C. Pépin, Y. Cloutier, Y. Bernard, and C. Duchaine. 2017. Workers’ exposure to bioaerosols from three different types of composting facilities. Journal of Occupational and Environmental Hygiene. doi:10.1080/15459624.2017.1335054
- Bowman, S.M., and S.J. Free. 2006. The structure and synthesis of the fungal cell wall. Bioessays 28 (8):799–808. doi:10.1002/bies.20441.
- Brenner, D.J., N.R. Krieg, and J.T. Staley. 2009. Bergey’s manual of systematic bacteriology: The proteobacteria. Part B: The gammaproteobacteria, Vol. 2. New York, NY: Springer.
- Brosch, R., S.V. Gordon, M. Marmiesse, P. Brodin, C. Buchrieser, K. Eiglmeier, T. Garnier, C. Gutierrez, G. Hewinson, K. Kremer, L.M. Parsons, A.S. Pym, S. Samper, D. Van Soolingen, and S.T. Cole. 2002. A new evolutionary scenario for the Mycobacterium tuberculosis complex. Proceedings of the National Academy of Sciences of the United States of America 99 (6):3684–9. doi:10.1073/pnas.052548299.
- Bru-Adan, V., N. Wery, M. Moletta-Denat, P. Boiron, J.P. Delgenes, and J.J. Godon. 2009. Diversity of bacteria and fungi in aerosols during screening in a green waste composting plant. Current Microbiology 59 (3):326–35. doi:10.1007/s00284-009-9438-3.
- Bunger, J., M. Antlauf-Lammers, T.G. Schulz, G.A. Westphal, M.M. Muller, P. Ruhnau, and E. Hallier. 2000. Health complaints and immunological markers of exposure to bioaerosols among biowaste collectors and compost workers. Occupational and Environmental Medicine 57 (7):458–64. doi:10.1136/oem.57.7.458.
- Bunger, J., B. Schappler-Scheele, R. Hilgers, and E. Hallier. 2007. A 5-year follow-up study on respiratory disorders and lung function in workers exposed to organic dust from composting plants. International Archives of Occupational and Environmental Health 80 (4):306–12. doi:10.1007/s00420-006-0135-2.
- Canadian Biogas Association. 2016. Biogas potential. http://biogasassociation.ca/about_biogas/biogas_potential.
- Caporaso, J.G., J. Kuczynski, J. Stombaugh, K. Bittinger, F.D. Bushman, E.K. Costello, N. Fierer, A.G. Pena, J.K. Goodrich, J.I. Gordon, et al. 2010. QIIME allows analysis of high-throughput community sequencing data. Nature Methods 7:335–6. doi: 10.1038/nmeth.f.303.
- Casati, S., L. Conza, J. Bruin, and V. Gaia. 2010. Compost facilities as a reservoir of Legionella pneumophila and other Legionella species. Clinical Microbiology and Infection 16 (7):945–7. doi:10.1111/j.1469-0691.2009.03009.x.
- Centers for Disease Control and Prevention. 2013. Core curriculum on tuberculosis: What the clinician should know. https://www.cdc.gov/tb/education/corecurr/pdf/chapter2.pdf.
- Chen, W.M., Y.S. Lin, D.S. Sheu, and S.Y. Sheu. 2012. Delftia litopenaei sp nov., a poly-beta-hydroxybutyrate-accumulating bacterium isolated from a freshwater shrimp culture pond. International Journal of Systematic and Evolutionary Microbiology 62:2315–21. doi:10.1099/ijs.0.037507-0.
- Comeau, A.M., W.K.W. Li, J.E. Tremblay, E.C. Carmack, and C. Lovejoy. 2011. Arctic ocean microbial community structure before and after the 2007 record sea ice minimum. Plos One 6:12. doi: 10.1371/journal.pone.0027492.
- Connaissances Des Énergies. 2015. Méthanisation. http://www.connaissancedesenergies.org/fiche-pedagogique/methanisation.
- Conza, L., S.C. Pagani, and V. Gaia. 2013. Presence of Legionella and free-living amoebae in composts and bioaerosols from composting facilities. Plos One 8 (7):6. doi:10.1371/journal.pone.0068244.
- Domingo, J.L., and M. Nadal. 2009. Domestic waste composting facilities: A review of human health risks. Environment International 35 (2):382–9. doi:10.1016/j.envint.2008.07.004.
- Douwes, J., P. Thorne, N. Pearce, and D. Heederik. 2003. Bioaerosol health effects and exposure assessment: Progress and prospects. The Annals of Occupational Hygiene 47 (3):187–200. doi:10.1093/annhyg/meg032.
- Duchaine, C., A. Meriaux, G. Brochu, K. Bernard, and Y. Cormier. 1999. Saccharopolyspora rectivirgula from Quebec dairy barns: Application of simplified criteria for the identification of an agent responsible for farmer’s lung disease. Journal of Medical Microbiology 48 (2):173–80.
- Dutch Expert Committee on Occupational Safety. 2010. Endotoxins: Health-based recommended occupational exposure limit.
- Dutkiewicz, J. 1997. Bacteria and fungi in organic dust as potential health hazard. Annals of Agricultural and Environmental Medicine 4:11–6.
- Environnement Canada. 2013. Document technique sur la gestion des matières organiques municipales.
- Epstein, E., W. Nerissa, C. Youngberg, and G. Croteau. 2001. Controlling dust and bioaerosols at a biosolids composting facility. BioCycle 42 (4):50–4.
- European Biogas Association. 2015. EBA biomethane & biogas report.
- Gilbert, Y., M. Veillette, A. Meriaux, J. Lavoie, Y. Cormier, and C. Duchaine. 2010. Metalworking fluid-related aerosols in machining plants. Journal of Occupational and Environmental Hygiene 7 (5):280–9. doi:10.1080/15459621003680227.
- Hand, W.L., and J.P. Sanford. 1970. Mycobacterium fortuitum—Human pathogen. Annals of Internal Medicine 73 (6):971–7. doi:10.7326/0003-4819-73-6-971.
- Heldal, K.K., L. Madso, and W. Eduard. 2015. Airway inflammation among compost workers exposed to actinomycetes spores. Annals of Agricultural and Environmental Medicine 22 (2):253–58. doi:10.5604/12321966.1152076.
- Herpers, B.L., B.M. de Jongh, K. van der Zwaluw, and E.J. van Hannen. 2003. Real-time PCR assay targets the 23S-5S spacer for direct detection and differentiation of Legionella spp. and Legionella pneumophila. Journal of Clinical Microbiology 41:4815–6. doi: 10.1128/jcm.41.10.4815-4816.2003.
- Holm-Nielsen, J.B., T. Al Seadi, and P. Oleskowicz-Popiel. 2009. The future of anaerobic digestion and biogas utilization. Bioresource Technology 100 (22):5478–84. doi:10.1016/j.biortech.2008.12.046.
- Joly, P., P.A. Falconnet, J. Andre, N. Weill, M. Reyrolle, F. Vandenesch, M. Maurin, J. Etienne, and S. Jarraud. 2006. Quantitative real-time Legionella PCR for environmental water samples: Data interpretation. Applied and Environmental Microbiology 72:2801–8. doi: 10.1128/aem.72.4.2801-2808.2006.
- Jorgensen, N.O.G., K.K. Brandt, O. Nybroe, and M. Hansen. 2009. Delftia lacustris sp nov., a peptidoglycan-degrading bacterium from fresh water, and emended description of Delftia tsuruhatensis as a peptidoglycan-degrading bacterium. International Journal of Systematic and Evolutionary Microbiology 59:2195–9. doi:10.1099/ijs.0.008375-0.
- Kim, Y.J., N.L. Nguyen, H.Y. Weon, and D.C. Yang. 2013. Sediminibacterium ginsengisoli sp nov., isolated from soil of a ginseng field, and emended descriptions of the genus Sediminibacterium and of Sediminibacterium salmoneum. International Journal of Systematic and Evolutionary Microbiology 63:905–12. doi:10.1099/ijs.0.038554-0.
- Klappenbach, J.A., P.R. Saxman, J.R. Cole, and T.M. Schmidt. 2001. RRNDB: The ribosomal RNA operon copy number database. Nucleic Acids Research 29 (1):181–4. doi:10.1093/nar/29.1.181.
- Kox, L.F.F., J. Vanleeuwen, S. Knijper, H.M. Jansen, and A.H.J. Kolk. 1995. PCR assay based on DNA coding for 16S ribosomal-RNA for detection and identification of mycobacteria in clinical-samples. Journal of Clinical Microbiology 33:3225–33.
- Le Goff, O., V. Bru-Adan, H. Bacheley, J.J. Godon, and N. Wery. 2010. The microbial signature of aerosols produced during the thermophilic phase of composting. Journal of Applied Microbiology 108 (1):325–40. doi:10.1111/j.1365-2672.2009.04427.x.
- Li, C.T., Z.F. Yan, X. Chu, F. Hussain, W.D. Xian, Z. Yunus, W.N. Hozzein, G. Abaydulla, and W.J. Li. 2015. Delftia deserti sp nov., isolated from a desert soil sample. Antonie Van Leeuwenhoek International Journal of General and Molecular Microbiology 107 (6):1445–50. doi:10.1007/s10482-015-0440-4.
- Macias-Corral, M., Z. Samani, A. Hanson, G. Smith, P. Funk, H. Yu, and J. Longworth. 2008. Anaerobic digestion of municipal solid waste and agricultural waste and the effect of co-digestion with dairy cow manure. Bioresource Technology 99 (17):8288–93. doi:10.1016/j.biortech.2008.03.057.
- Marchand, G., J. Lavoie, and L. Lazure. 1995. Evaluation of bioaerosols in a municipal solid-waste recycling and composting plant. Journal of the Air & Waste Management Association 45 (10):778–81. doi:10.1080/10473289.1995.10467406.
- Nadal, M., I. Inza, M. Schuhmacher, M.J. Figueras, and J.L. Domingo. 2009. Health risks of the occupational exposure to microbiological and chemical pollutants in a municipal waste organic fraction treatment plant. International Journal of Hygiene and Environmental Health 212 (6):661–9. doi:10.1016/j.ijheh.2009.06.002.
- Nehme, B., Y. Gilbert, V. Letourneau, R.J. Forster, M. Veillette, R. Villemur, and C. Duchaine. 2009. Culture-independent characterization of archaeal biodiversity in swine confinement building bioaerosols. Applied and Environmental Microbiology 75 (17):5445–50. doi:10.1128/aem.00726-09.
- O’Connor, B.A., J. Carman, K. Eckert, G. Tucker, R. Givney, and S. Cameron. 2007. Does using potting mix make you sick? Results from a Legionella longbeachae case-control study in South Australia. Epidemiology and Infection 135 (1):34–9. doi:10.1017/s095026880600656x.
- Pain, B.F., and R.Q. Hepherd. 1985. Anaerobic digestion of livestock wastes. Conference paper, Anaerobic Digestion of Farm Waste, NIRD, Reading, UK, 9–14.
- Pepys, J., P.A. Jenkins, G.N. Festenstein, P.H. Gregory, M.E. Lacey, and F.A. Skinner. 1990. Farmer’s lung: Thermophilic actinomycetes as a source of “farmer’s lung hay” antigen. 1963. Allergy Proceedings: The Official Journal of Regional and State Allergy Societies 11 (2):101-2, discussion 97-9. doi:10.2500/108854190778993263.
- PHAC. 2011. Legionella pneumophila: Pathogen safety data sheet—Infectious substances. http://www.phac-aspc.gc.ca/lab-bio/res/psds-ftss/legionella-eng.php.
- Poole, C.J.M., and M. Wong. 2013. Allergic bronchopulmonary aspergillosis in garden waste (compost) collectors-occupational implications. Occupational Medicine-Oxford 63 (7):517–9. doi:10.1093/occmed/kqt097.
- Prendki, V., P. Germaud, P. Bemer, A. Masseau, and M. Hamidou. 2008. Non tuberculous mycobacterial infections. Revue De Medecine Interne 29 (5):370–9. doi:10.1016/j.revmed.2007.09.030.
- Qu, J.H., and H.L. Yuan. 2008. Sediminibacterium salmoneum gen. nov., sp nov., a member of the phylum Bacteroidetes isolated from sediment of a eutrophic reservoir. International Journal of Systematic and Evolutionary Microbiology 58:2191–4. doi:10.1099/ijs.0.65514-0.
- Reboux, G., R. Piarroux, F. Mauny, A. Madroszyk, L. Millon, K. Bardonnet, and J.C. Dalphin. 2001. Role of molds in farmer’s lung disease in Eastern France. American Journal of Respiratory and Critical Care Medicine 163 (7):1534–9. doi:10.1164/ajrccm.163.7.2006077.
- Sanchez-Monedero, M.A., E.I. Stentiford, and S.T. Urpilainen. 2005. Bioaerosol generation at large-scale green waste composting plants. Journal of the Air & Waste Management Association 55 (5):612–18. doi:10.1080/10473289.2005.10464652.
- Schafer, J., P. Kampfer, and U. Jackel. 2011. Detection of Saccharopolyspora rectivirgula by quantitative real-time PCR. The Annals of Occupational Hygiene 55:612–9. doi: 10.1093/annhyg/mer018
- Schafer, J., K. Klug, V. Van Kampen, and U. Jackel. 2013. Quantification of Saccharopolyspora rectivirgula in composting plants: Assessment of the relevance of S. rectivirgula. Annals of Occupational Hygiene 57 (7):875–83. doi:10.1093/annhyg/met010.
- Schlosser, O., A. Huyard, K. Cartnick, A. Yanez, V. Catalan, and Z.D. Quang. 2009. Bioaerosol in composting facilities: Occupational health risk assessment. Water Environment Research 81 (9):866–77. doi:10.2175/106143009X407258.
- Searl, A. 2008. Exposure-response relationships for bioaerosols emissions form waste treatment processes. Institute of Occupational Medicine. http://sciencesearch.defra.gov.uk/Default.aspx?Menu=Menu&Module=More&Location=None&Completed=0&ProjectID=15140 ( accessed September 4, 2015).
- Shade, A., C.S. Hogan, A.K. Klimowicz, M. Linske, P.S. McManus, and J. Handelsman. 2012. Culturing captures members of the soil rare biosphere. Environmental Microbiology 14 (9):2247–52. doi:10.1111/j.1462-2920.2012.02817.x.
- Shigematsu, T., K. Yumihara, Y. Ueda, M. Numaguchi, S. Morimura, and K. Kida. 2003. Delftia tsuruhatensis sp nov., a terephthalate-assimilating bacterium isolated from activated sludge. International Journal of Systematic and Evolutionary Microbiology 53:1479–83. doi:10.1099/ijs.0.02285-0.
- Steele, T.W., C.V. Moore, and N. Sangster. 1990. Distribution of Legionella longbeachae serogroup-1 and other Legionellae in potting soils in Australia. Applied and Environmental Microbiology 56 (10):2984–8.
- Swan, J.R.M., A. Kelsey, B. Crook, and E.J. Gilbert. 2003. Occupational and environmental exposure to bioaerosols dorm composts and potential health effects—A critical review of published data. Health and Safety Executive. http://www.hse.gov.uk/research/rrpdf/rr130.pdf.
- Sykes, P., R.H.K. Morris, J.A. Allen, J.D. Wildsmith, and K.P. Jones. 2011. Workers’ exposure to dust, endotoxin and beta-(1-3) glucan at four large-scale composting facilities. Waste Management (New York, NY) 31 (3):423–30. doi:10.1016/j.wasman.2010.10.016.
- Vieitez, E.R., and S. Ghosh. 1999. Biogasification of solid wastes by two-phase anaerobic fermentation. Biomass & Bioenergy 16 (5):299–309. doi:10.1016/s0961-9534(99)00002-1.
- Vinneras, B., C. Schonning, and A. Nordin. 2006. Identification of the microbiological community in biogas systems and evaluation of microbial risks from gas usage. Science of the Total Environment 367 (2–3):606–15. doi:10.1016/j.scitotenv.2006.02.008.
- Vos, P., G. Garrity, D. Jones, N.R. Krieg, W. Ludwig, F.A. Rainey, K.-H. Schleifer, and W.B. Whitman. 2009. Bergey’s manual of systematic bacteriology: The firmicutes, Vol. 3, 2nd ed. New York, NY: Springer-Verlag.
- Ward, A.J., P.J. Hobbs, P.J. Holliman, and D.L. Jones. 2008. Optimisation of the anaerobic digestion of agricultural resources. Bioresource Technology 99 (17):7928–40. doi:10.1016/j.biortech.2008.02.044.
- Wen, A.M., M. Fegan, C. Hayward, S. Chakraborty, and L.I. Sly. 1999. Phylogenetic relationships among members of the Comamonadaceae, and description of Delftia acidovorans (den Dooren de Jong 1926 and Tamaoka et al. 1987) gen. nov., comb. nov. International Journal of Systematic Bacteriology 49:567–76. doi:10.1099/00207713-49-2-567.
- Wéry, N. 2014. Bioaerosols from composting facilities—A review. Frontiers in Cellular and Infection Microbiology 4:42. doi:10.3389/fcimb.2014.00042.
- Whiley, H., and R. Bentham. 2011. Legionella longbeachae and legionellosis. Emerging Infectious Diseases 17 (4):579–83. doi:10.3201/eid1704.100446.
- Willems, A., J. Deley, M. Gillis, and K. Kersters. 1991. Comamonadaceae, a new family encompassing the acidovorans ribosomal-RNA complex, including Variovorax paradoxus gen-nov, comb-nov, for Alcaligenes paradoxus (Davis 1969). International Journal of Systematic Bacteriology 41 (3):445–50. doi:10.1099/00207713-41-3-445.
- Wouters, I.M., S. Spaan, J. Douwes, G. Doekes, and D. Heederik. 2006. Overview of personal occupational exposure levels to inhalable dust, endotoxin, beta(1 -> 3)-glucan and fungal extracellular polysaccharides in the waste management chain. Annals of Occupational Hygiene 50 (1):39–53. doi:10.1093/annhyg/mei047.
- Zucker, B.A., and W. Muller. 2004. Airborne endotoxins and airborne gram-negative bacteria in a residential neighborhood. Water Air and Soil Pollution 158 (1):67–75. doi:10.1023/b:wate.0000044831.34371.99.