
ABSTRACT
An important marine pollution issue identified by the International Maritime Organization (IMO) is NOx emissions; however, the stipulated method for determining the NOx certification value does not reflect the actual high emission factors of slow-speed two-stroke diesel engines over long-term slow steaming. In this study, an accurate method is presented for calculating the NOx emission factors and total amount of NOx emissions by using the actual power probabilities of the diesel engines in four types of bulk carriers. The proposed method is suitable for all types and purposes of diesel engines, is not restricted to any operating modes, and is highly accurate. Moreover, it is recommended that the IMO-stipulated certification value calculation method be modified accordingly to genuinely reduce the amount of NOx emissions. The successful achievement of this level of reduction will help improve the air quality, especially in coastal and port areas, and the health of local residents.
Implications: As per the IMO, the NOx emission certification value of marine diesel engines having a rated power over 130 kW must be obtained using specified weighting factor (WF)-based calculation. However, this calculation fails to represent the current actual situation. Effective emission reductions of 6.91% (at sea) and 31.9% (in ports) were achieved using a mathematical model of power probability functions. Thus, we strongly recommend amending the certification value of NOx Technical Code 2008 (NTC 2008) by removing the WF constraints, such that the NOx emissions of diesel engines is lower than the Tier-limits at any load level to obtain genuine NOx emission reductions.
Introduction
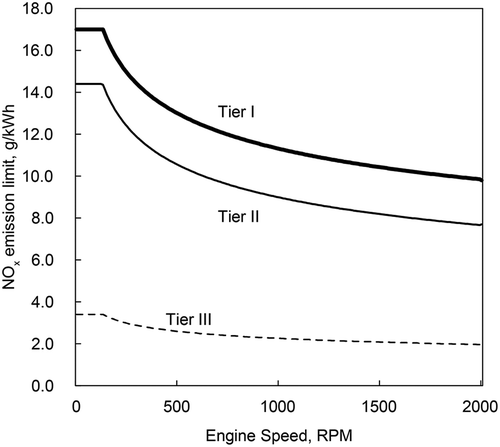
Following the adoption of Annex VI of the International Convention for the Prevention of Pollution from Ships (MARPOL) by the International Maritime Organization (IMO) in 1997, the regulations governing the emission of NOx, SOx, and CO2 have gradually become more stringent. After discussions over the course of several sessions at the 57th Session in 2008, the Marine Environment Protection Committee (MEPC, the Committee) of the IMO approved the proposed amendment that all new marine diesel engines must comply with the three-tier NOx emission regulation. The amendment was finally adopted by the Committee at the 58th Session in the same year, as shown in . The goal of this regulation is to reduce the level of NOx emissions caused by the international shipping industry by 20% after 2011, and to reduce NOx emissions in emission control areas (ECAs) by 80% after 2016 (IMO Citation2008a; Citation2008b; Citation2008c; Citation2008d). MARPOL Annex VI also specifies that from 2012 onward, the sulfur content in fuel oil for international shipping purposes must not exceed 3.5%, and will be further limited to no more than 0.5% after 2020. Moreover, beginning in 2015, the sulfur content in fuel oil within the sulfur emission control areas (SECAs) must not exceed 0.1%. Synthesizing all kinds of reasons, many large ships have practiced slow steaming in response, in order to reduce emissions, and due to substantially increased fuel costs (Doudnikoff and Lacoste Citation2014; Notteboom and Vernimmen Citation2009).
Figure 1. Three tiers of NOx emission limits.
Many scholars believe that shipping is a highly polluting mode of transport because the ships emit large quantities of NOx and SOx (Corbett and Fischbeck Citation1997; Corbett and Koehler Citation2003; Endresen et al. Citation2003). The Third IMO Greenhouse Gas (GHG) Study estimated that over the years from 2007 to 2012, an average of 20.9 million and 11.3 million tonnes of NOx and SOx, respectively, were emitted annually from all shipping activities, while international shipping was estimated to produce approximately 18.6 million and 10.6 million tonnes of NOx and SOx, respectively, on an annual basis. The NOx and SOx emissions from all shipping activities represented approximately 15% and 13% of global NOx and SOx emissions from anthropogenic sources, respectively, as reported in the latest Intergovernmental Panel on Climate Change (IPCC) Assessment Report. According to the IMO, NOx and SOx emissions from international shipping represented approximately 13% and 12% of global NOx and SOx totals, respectively (IMO Citation2014).
In the IMO Study, which is intended to serve as a key reference on global shipping emissions, the statistics of emissions in various categories were collected using bottom-up and top-down methods, and the information regarding ship speeds was gathered using the automatic identification system (AIS). In addition, the fuel oil consumption (FOC) and main engine (ME) power at approximately 75% of full power were estimated, the CO2 and SOx emissions were calculated, and the NOx emissions were estimated using the fixed NOx emission values as the emission factors (EFs).
The levels of SOx and CO2 emissions are dependent on the FOC. The ratio of the CO2 EF to specific fuel oil consumption (SFOC) can be constant. Heavy fuel oil (HFO) has a relatively low carbon content, for which the constant 3.114 (g CO2/g HFO) is widely adopted. In contrast, the carbon content of marine diesel oil (MDO) and marine gas oil (MGO) is higher than that of HFO, for which the constant 3.206 (g CO2/g MDO or MGO) is often used (IMO Citation2012). The FOC of the relative horsepower can be accurately measured by mounting magnetic-type fuel meters with 1% error margin at the fuel inlet and return line of diesel engines; however, the level of NOx emissions is associated with the engine load and combustion temperature. A higher combustion temperature and the time that combustion gases remain at high temperature result in greater NOx emissions. In addition, the NOx EF and combustion temperature vary with engine load, fuel injection timing, and quantity, especially for the load factor (Lf) under 0.25. Therefore, the factors that effectively influence the amount of NOx emissions from ships are the engine load and output, and not the speed. Although the relationship between the speed of the ship and ME output follows the propeller law, due to variations in the resistances of the ship for different ship types and propeller slippages, which can be attributed to variations in the sea state conditions, the actual ME load and ship speed may vary at any point in time (European Commission and ENTEC UK Limited Citation2002; Khan et al. Citation2013; IMO Citation2016). The ME power is not proportional to the exact cubic power of the speed of the ship. Furthermore, the propeller design and ME characteristics may vary with the type of ship. For example, the exponent values of container ships and bulk carriers may be between 2.8 and 3.2 because of different thrust power, hull, and propeller profile design. Thus, the actual ME horsepower cannot be precisely determined from the speed of the ship via the propeller law (Borkowski, Kasyk, and Kowalak Citation2011). However, due to recent advances in electronics, science, and technology, the power meters that are built in to modern ME control systems can accurately measure the real-time horsepower variations during operation of the ship, thereby enabling convenient and precise horsepower-associated calculations to be performed. Hence, the most simplified and accurate method for calculating the exhaust emissions is to compute the SOx and CO2 emissions using the measured FOC, and to calculate the NOx emissions based on the actual engine load or output, instead of the speed.
Following the mandatory enforcement of MARPOL Annex VI, each diesel engine with a rated power that exceeds 130 kW is required to be tested in compliance with the NOx Technical Code 2008 (NTC 2008) regulation, and to acquire the NOx emission certification value via the specified weighting factor (WF)-based calculation. Different types of diesel engines possess various characteristics and potentially different resulting NOx EFs. Before the energy crisis, almost all commercial ships navigated at 75–85% high engine load levels at sea because of high thermal efficiency. At lower loads, the two-stroke main diesel engines tend to experience longer combustion times, lower efficiencies, and lower power outputs, and therefore generate relatively large amounts of NOx per unit power, which leads to higher EFs when compared with high load operations (Andereadis et al. Citation2011; Corbett and Koehler Citation2003). This phenomenon is more pronounced for the electrohydraulically controlled large diesel engines and common rail engines that conform to the Tier II regulations.
In order to manufacture engines that comply with the Tier II emission regulations and to lower the SFOC to satisfy market demand, engine manufacturers relaxed the NOx emission control at low loads. A lower load can contribute to a higher NOx EF, although the NOx emission certification value will still be lower than the Tier II limits according to the low-load, low-WF calculation specified in the NTC 2008 regulations. However, this WF allocation fails to properly represent the actual situation that has developed over the last decade wherein large-scale vessels experience long periods of slow steaming. Excessive calculation errors of NOx emissions will occur if NOx EFs are regarded as fixed values while the actual load state and operation time are not considered. Moreover, greater variations in the ship speed and ME load will lead to higher errors. The NOx EFs of Tier II MEs running at 25% load are approximately 55% higher compared to the 100% load. The relationships of NOx EFs and engine load are explained later with detailed equations.
In this paper, the actual NOx EFs and total emissions for four types of large bulk carriers (BCs) with over 200,000 deadweight (DWT) are calculated using the mathematical model of power probability functions for the MEs in actual navigation. The computed results are then compared to the certification values and data published by the IMO. Moreover, it is suggested that the certification value calculation method of NTC 2008 be amended by removing the WF constraints, such that the NOx emissions of diesel engines must be lower than the Tier-limits at any load level for the purpose of genuine NOx emission reductions. Based on these results, an effective emission reduction of 6.91% at sea and 31.9% in port areas, respectively, is shown. The correct calculation of the actual EFs and total emissions may facilitate the accurate inventory of global shipping emissions, which may serve as key reference indexes for effective emission reduction, life cycle assessment, and policy formulation.
Methodology
Basic information and operation modes of four types of BCs
The four types of BCs with fixed pitch propeller examined in this work are mainly engaged in the transport of coal from Australia to Taiwan, with two to four sister ships for each type. Once the estimated time of arrival (ETA) to a port is determined, the ship speed, ME output, and revolutions per minute (RPM) remain almost unaltered during navigation. In addition, slow steaming is practiced in most cases to reduce the FOC. The research data used in this paper were extracted from data representing at least 12 months of operations of each representative vessel for each BC type between 2013 and 2015, wherein the ME load, power output, RPM, and generator engine (GE) power output were extracted from the electronic control system of the ME and the engine room (E/R) log book. These engines were tested/witnessed to obtain important data comprising the engine output, NOx EF, SFOC, and so on during certification. The information on machine testing, equipment, calibration records, and test results of engines are recorded in detail in well-maintained NOx Technical Files (Classification Societies Citation2014). For example, the manufacturer of the dynamometer for engine power measurement is Fuchino (serial number 91032) with a maximum measurement range of 100,000 BHP. The manufacturer of the NOx analyzer is Horiba (model CLA-155) with a maximum measurement range of 2,000 ppm, while that of the weighting machine for FOC is CAS (model 1W78).
In order to improve the propulsion efficiency and reduce the fuel costs, the hull and machinery designs are being continuously enhanced and optimized, thereby enhancing the overall efficiency in order to respond to market demands. The basic information of the four types of BCs is shown in . The fuel and exhaust valves of the BC1 ME are controlled using a chain and camshaft transmission with a relatively high SFOC. For the BC2 ME, electrohydraulic control is applied to accurately regulate the opening and closing of the fuel and exhaust valves, and the ME rated power and RPM are reduced, leading to an improvement of the overall propulsion efficiency and reduction of the SFOC. BC3 and BC4 featured a superior hull shape design and propulsion efficiency, which provides a reduction in the submerged resistance and the wind resistance above the surface of the water. The rated power and RPM of the BC4 ME are further reduced, whereas its DWT is increased, which represents the optimal design of these vessels. In order to obtain results more precisely, the engine output data presented in Lf, as shown later in Eq. (6), on hourly basis to minimize the gaps of transient power.
Table 1. Particulars of four types of BCs.
According to the IMO 3rd GHG Study, the average Lf of the ME for 100,000+ DWT large BCs operating at sea was reduced from 0.77 (2007) to 0.57 (2012), and daily FOC was reduced from 55.5 t to 42.3 t. Likewise, the average Lf was also reduced from 0.83 to 0.49 and from 0.69 to 0.32 for 120,000+ DWT tankers and 8,000+ TEU (twenty-foot equivalent units) container carriers, and daily FOC was reduced from 65.4 t to 39.4 t and from 200.0 t to 95.6 t, respectively (IMO Citation2014).
NOx emission certification value and weighting factor
According to MARPOL Annex VI, the NOx emission measurement shall apply to each marine diesel engine with a power output of more than 130 kW installed on a ship. The amount of NOx emissions obtained from the test bed involves the emissions mass flow rate calculated using the carbon balance method. Furthermore, the temperature, pressure, humidity, and fuel oil composition are considered when generating the final NOx emission certification value according to NTC 2008 (IMO Citation2008d), as expressed in Eqs. (1) and (2):
where
: NOx emission mass flow rate at mode i, g/h
: Weighting factor at mode i (according to the test cycle in NTC 2008)
: Measured power at each mode, kW
: Ratio between density of exhaust component and density of exhaust gas
: Concentration of the respective component in the raw exhaust gas, ppm, wet
: exhaust mass flow, kg/hr, wet
: NOx humidity correction factor
The WFs in NTC 2008 are based on the ISO 8178–4 standards, and were determined using the typical operating mode and running time of conventional marine diesel engines (IMO Citation2008d; ISO 2007). The emission tests of the diesel engines of the four BCs were performed, and the certification values were calculated according to Eqs. (1) and (2).
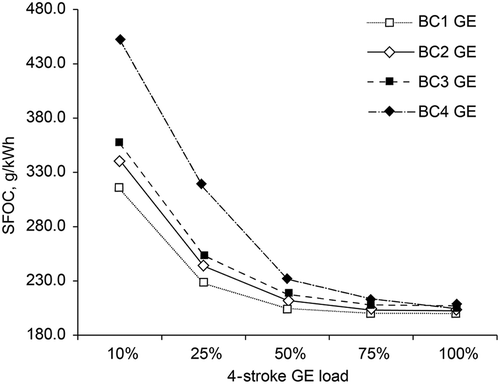
The NOx EFs of the MEs and the generator parent engines of the four BCs at various loads are shown in and , where the WFs assigned by NTC 2008 are represented by the black dots. The WF exhibits a maximum value of 0.50 when the ME operates at a 75% load, but the NOx EF is not that high. The SFOC at 75% load level is generally fairly low, as shown in . In the early days, most ships operated at a high speed around this load level because of high thermal efficiency, and consumed a large amount of fuel oil at the same time. However, under the present target of fuel cost reduction and energy saving, a slow steaming strategy is widely adopted, and there is an extremely low chance that the ships will operate at high loads. Consequently, a lower load results in a higher NOx EF. The EFs of Tier II MEs running at 25% load are approximately 55% higher compared to the 100% load. In addition, more pronounced differences can be observed at power levels lower than 25%, where the WF declines to a minimum value of 0.15. Therefore, this WF allocation and calculation approach according to NTC 2008 cannot reflect the actual emissions of ships operating with a slow steaming strategy. In contrast, the GEs operate within the load range of 25–75% in most cases, and show a relatively uniform WF allocation in . Although the WFs are 0.05 and 0.10 at 100% and 10% loads, respectively, the GEs do not run at these load levels during actual operations. shows the SFOC of four-stroke GEs at different load levels with a high SFOC at low load and a low SFOC at high load because of the thermal efficiency.
Figure 2. NOx EFs and WFs of two-stroke ME at different load levels.
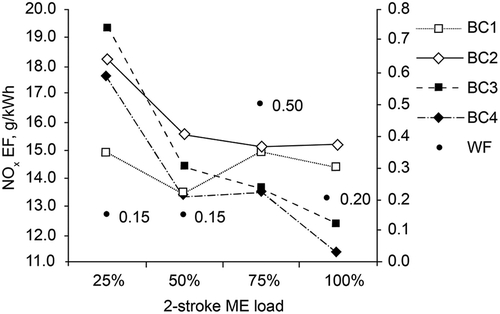
Figure 3. NOx EFs and WFs of four-stroke GE at different load levels.
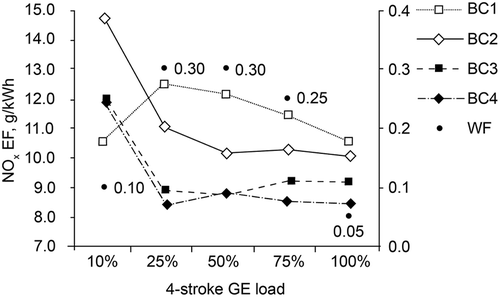
Figure 4. SFOC of the two-stroke ME at different load levels.
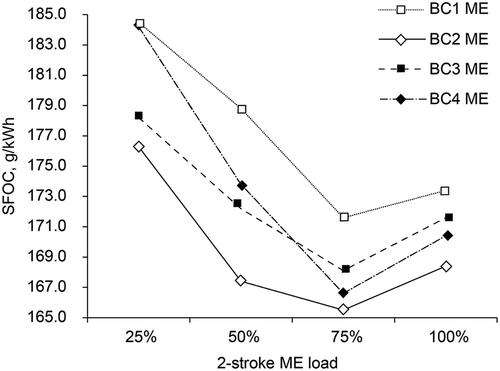
Figure 5. SFOC of the four-stroke GE at different load levels.
Power probability density function and emission formulas
The power probability density function (PPDF) of the MEs and GEs are obtained from actual operation. The definitions and constraints of the actual operating PPDF are as follows:
where
): power probability density function,
: load factor, operating power/rated power
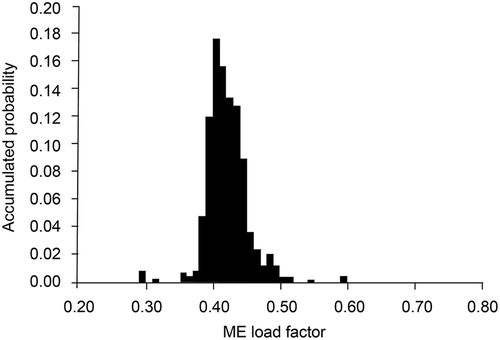
In –, the area between the two arbitrary load factors Lf denotes the accumulated probability of occurrence within this load interval. The total area of summation is 1.
Figure 6. Accumulated power probability of BC1 ME.
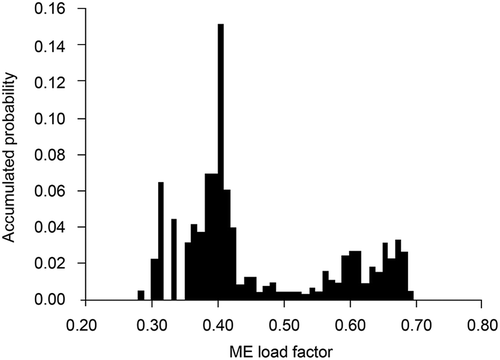
Figure 7. Accumulated power probability of BC2 ME.
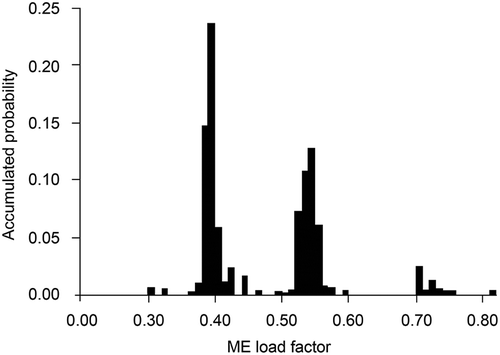
Figure 8. Accumulated power probability of BC3 ME.
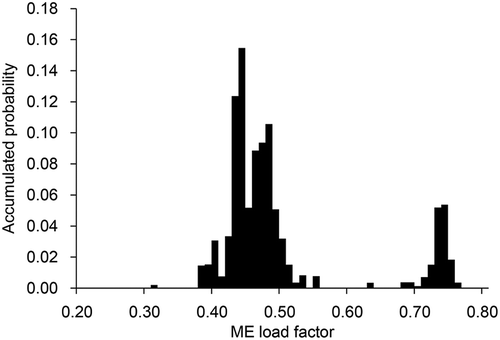
Figure 9. Accumulated power probability of BC4 ME.
Due to varying ship speeds, draft, sea conditions, and cargo loading conditions, there is no specific function that can represent all operating modes (Banks et al. Citation2013). The IMO 3rd GHG Study defines an equation showing all of these parameters (IMO Citation2014). By applying this modification, the results could be changed. However, the mathematical model introduced in the following provides a reasonable fit for the calculation of the actual NOx emissions. Thus, the products of the NOx emission function values and corresponding PPDF values can be summed, thereby deriving the most practical power probability emission factor (PPEF), as expressed in Eq. (5). Further, the summation of the product of the PPEF with the corresponding power and total operation time will yield the accurate total NOx emissions, as denoted by Eq. (6):
where
: function of NOx emission obtained from the test bed
P: rated power, kW
T: total operation time, hours
Results
Engine load factors
The engine power is expressed as a load factor, and the accumulated ME power probability distributions of the four BCs in a year are illustrated in –. The average Lf ranges from 0.42 to 0.50, and the vessels operate at even lower loads for long periods. The accumulated probability of an Lf greater than 0.7 is not high, and there is no probability that the Lf would exceed 0.6 in BC4 during the entire operation. This illustrates the fact that in order to lower the fuel costs, slow steaming is practiced in most cases by large BCs operating at sea, while long-term fast-steaming at over 75% ME load is rarely seen.
Certification value and emission factor
The WF allocation of the E3 test cycle specified by NTC 2008 and the NOx EF measured under different loads in the MEs of the four BCs are shown in . Using Eqs. (1) and (2), the BC1 ME has a certification value, 14.6 g/kWh, far lower than the Tier I limit (17.0 g/kWh), measured NOx EFs within 13.44–14.93 g/kWh, and a relatively high SFOC, as shown in . Although electrohydraulic control has been adopted in the BC2 ME, which is only required to comply with the Tier I limit because it was installed prior to 2011, the relaxed control on the NOx EF to reduce the SFOC means that BC2 has the highest certification value and the lowest SFOC among the four, as shown in and . The BC3 and BC4 MEs were installed after 2011, and the respective certification values must be maintained under the Tier II limit and must meet the market demands in terms of the SFOC. Therefore, by taking advantage of the low WF at lower loads, the NOx emission control at lower loads can be relaxed to achieve a low SFOC. The certification values of the MEs of the four BCs were calculated to be 14.60, 15.40, 13.68, and 13.10 g/kWh, respectively. It can be seen from that, with the exception of BC1, the other three MEs exhibit a sharp increase in the NOx EF at 25% load.
The WFs allocation of the GEs in the four types of BCs in the D2 test cycle specified by NTC 2008 and the NOx EFs measured at different load levels are illustrated in . The BC1 GE exhibits the lowest SFOC, as shown in , under the relaxed control on NOx emissions because it is only required to comply with the Tier I regulations. For the BC3 and BC4 GEs, which are required to follow the Tier II limit, the trade-off between the SFOC and EF was examined under different power levels, including 10%, 25%, 50%, 75%, and 100%. The NOx emissions control of the BC2 GE has reached the Tier II standards level; however, it only needs to conform to Tier I standards due to the early GE installation date. As a result, the emissions control can be slightly relaxed to reduce the SFOC. The certification values of the GEs of the four BCs are 11.80, 10.40, 9.10, and 8.70 g/kWh, respectively. In , except for the BC1 GE, the other three GEs exhibit a sharp increase in the NOx EF at a 10% load.
NOx PPEF and total emissions
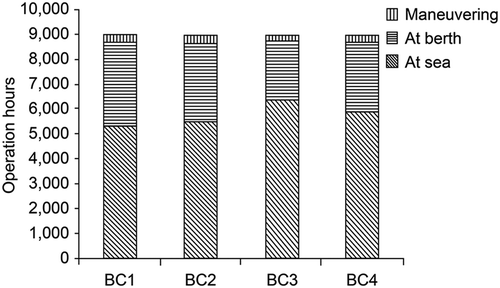
The operation hours of the four BCs are shown in . It can be seen that the average operation hours at sea and at berth account for 64.4% and 32.6% of the total time, respectively, and the average Lf of the MEs in the 9,000-hr continuous operation ranges from 0.42 to 0.50, as shown in –. The shipping emissions primarily originate from the ME, whereas the GE is the major contributor to the emissions at berth. Although the PPDF of a diesel engine is a random function that varies from ship to ship, the NOx EFs measured from the test bed are assumed as a linear function at different loads, as shown in and , and linear interpolation is used for the other engine loads. Therefore, the corresponding NOx emissions can be calculated once the load or power output data have been obtained from the diesel engine control system.
Figure 10. Operation hours of four BCs.
The PPEF calculated using the PPDF of the ME and GE operation is displayed in . The total NOx emissions from the MEs of the four BCs that were derived both at sea and during maneuvering operations in port are shown in .
Table 2. NOx PPEF of ME and GE.
Table 3. Total NOx emissions from ME of four BCs.
As shown in and , the BC1 ME with conventional mechanical control has a relatively high SFOC and the smallest PPEF of the four MEs. The BC2 ME has an excessively high PPEF due to the long-time operation at around 40% load while the EF exhibits its maximum value, as shown in . The BC3 and BC4 MEs exhibit lower SFOCs than the BC1 ME when working at low loads to satisfy market demands. An optimal balance is also obtained between the NOx EF and the SFOC. The NOx emission certification values of these two MEs obtained from the WF calculation based on the NTC 2008 regulation comply with the Tier II regulations. However, due to long-term low-power operation, the results calculated based on the PPDF of the actual operation eventually exceed the Tier II limit, 14.40 g/kWh, and reached 14.99 and 14.65 g/kWh, respectively.
Based on the hull dimensions, DWT, and ME rated power of the four BCs, it is evident that the overall efficiency of these ships has gradually increased from generation to generation. For example, as compared to BC1, BC4 has increased by 3% in terms of DWT, whereas there has been a 14% drop in the ME rated power. In terms of NOx emissions, the total NOx emissions are associated with the ME power probability, NOx EF, and operation hours. Generally speaking, electronically controlled two-stroke diesel engines always possess a higher NOx EF at lower loads. BC3 ME has the highest operation hours (6397.3 hr) with an ME power probability mostly ranging from 0.40 to 0.50 load factors, thus leading to the highest total NOx emissions amounts to 804.30 metric tons (MT) at sea, as shown in . The BC4 ME, despite its operation at sea for 5872.8 hr, has the lowest rated power (16,040 kW), with the power probability largely falling within 0.38 to 0.46 load factors, and a relatively lower EF, as shown in , which are attributed to the overall propulsion efficiency and ME enhancements, thereby generating the least amount of NOx emissions (only 579.38 MT). The BC1 ME possesses the lowest propulsion efficiency and highest ME rated power (18,660 kW), the lowest PPEF (14.13 g/kWh) and operation hours. Thus, BC1 shows a higher amount of total NOx emissions than that of BC4.
NOx emissions of the GE
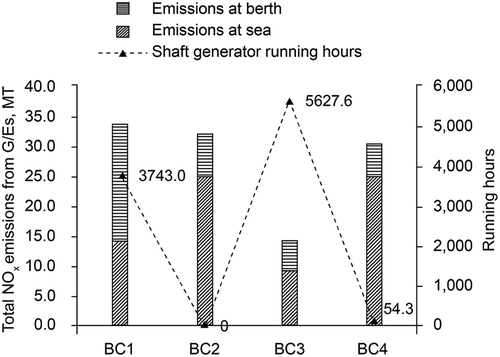
The total NOx emissions of the GEs and shaft generator (SG) running hours are shown in ; the total emission is the summation of the emission at berth, which is represented by horizontally striped bars, and the emission at sea, which is represented by diagonally striped bars, and the triangular dots represent the SG running hours, from which it can be seen that the total NOx emissions are related to the SG running hours at sea. BC3 has the highest SG running hours, and a relatively low NOx PPEF. The total NOx emissions from its three GEs are only 14.03 MT (accounting for 1.7% of the total emissions of BC3), the lowest among the four BCs. Despite the use of the SG at sea, due to the highest PPEF, BC1 still has the highest total NOx emissions from its three GEs among the four BCs at approximately 33.51 MT, although this only accounts for 4.9% of the total emissions of BC1. BC2 and BC4 have total NOx emissions of 32.09 MT and 30.27 MT, respectively, with only short-term or no use of the SG, which accounts for 4.3% and 4.9% of the total amounts.
Figure 11. Total NOx emissions from GEs and running hours of SG.
Discussion
PPEF and NTC 2008 certification value
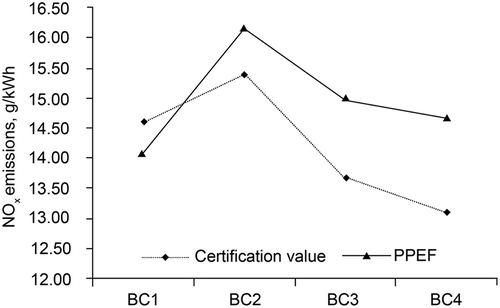
The certification value for each ME of the BCs obtained from the fixed-WF calculation based on the test results according to NTC 2008, and the PPEF calculated using the varying ME power probability as the coefficient, are shown in . The weight allocation of the former has more emphasis at the 75% load level, while that of the latter is dependent on the actual power probability and operation hours of the diesel engine. An electronically controlled Tier II ME would provide a false indication of low certification values due to the allocation pattern of low EF for high load and high EF for low load. Therefore, certification values cannot correctly represent the emissions per unit work (kWh) when the MEs are under long-term low-load operation. Instead, the PPEF and total NOx emissions calculated using the actual power probabilities of each ship as the variation coefficient can truly represent the actual emissions of the diesel engine under any load variations at any time. It can be seen in that the PPEFs of the electrohydraulically controlled MEs of BC2, BC3, and BC4 in actual slow steaming conditions are higher than the certification values, while resutls for BC1 are just the opposite. This indicates that the NOx emissions from traditional mechanically controlled MEs (Tier I engines) are lower than those from electrohydraulically controlled MEs (Tier II engines) under long-time, low-load operating conditions. Besides, the NOx emissions of the Tier II engines (BC3 and BC4) were originally expected to be lower but are actually higher than 14.40 g/kWh under long-time low-load operating conditions, and therefore fail to comply with the essence of the NOx Tier II regulation of MARPOL.
Figure 12. Comparison of PPEF and NOx certification values of MEs.
The IMO NOx limits are fairly arbitrary and based on the given weighting factors; if different weighting factors were used, then different NOx limits could be defined by IMO. However, the four BCs’ load profiles cannot be taken to be representative of global fleet. Obviously, if the ship engines are operating at low load they could generate more NOx emissions than the IMO rated value.
Comparison of total NOx emissions by different EFs
For NOx EFs, the Third IMO GHG Study applied fixed values of 17.0 and 15.3 g/kWh for Tier I and II slow-speed diesel engines, respectively (IMO Citation2014). The GREET model of the Argonne National Laboratory in the United States adopted 16.1 g/kWh, whereas the TEAM model used 8.46 g/kWh (Winebrake, Corbett, and Meyer Citation2006; Citation2012). These values were calculated using the WFs with an emphasis on diesel engines operated at high power levels. However, as demonstrated in this study, this approach cannot provide the accurate emission estimation of diesel engines in low-load operations.
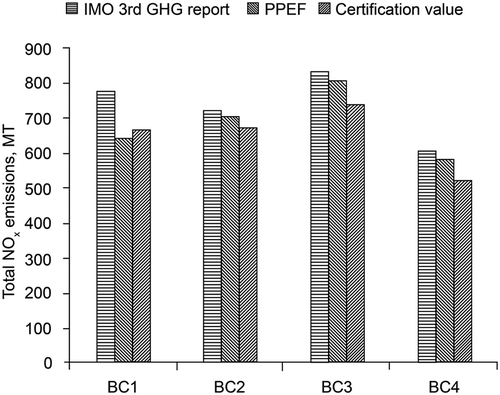
The total NOx emissions from the MEs of the four BCs were calculated using the published IMO values, the PPEF mathematical model expressed in Eqs. (5) and (6), and the NTC 2008 certification values illustrated in . Generally, the certification values of the large slow-speed diesel engines that conform to the Tier I or Tier II regulations are around 15.0 g/kWh or 13.0–14.0 g/kWh, respectively. The total NOx emissions calculated using the fixed values published by IMO, namely, 17.0 and 15.3, are 3.0–20.3% higher than those in the PPEF model, as illustrated by the horizontally striped bars in the chart in . The diagonally striped bars to the extreme right in plot the total NOx emissions calculated based on the emission certification values of the four MEs under slow steaming operation. As the EF is usually higher at lower loads, greater differences can be observed with lower certification values. For instance, the certification value of BC4 is 13.10 g/kWh, which leads to an underestimation in the total NOx emissions by about 10.4% as compared to the PPEF model. BC2 and BC3 have certification values of 15.40 g/kWh and 13.68 g/kWh, respectively, which result in an underestimation of the total NOx emissions by 4.0% and 7.9%, respectively, in comparison to the PPEF model. BC1 has a certification value of 14.60 g/kWh, which is slightly higher than that for the PPEF, which was 14.13 g/kWh. Thus, the total NOx emissions calculated based on the certification values exhibit a slight overestimation of approximately 3.3%. These discrepancies may be even greater with longer slow steaming operations.
Figure 13. Comparison of total NOx emissions with different EFs.
Emission reduction by limiting the NOx EF at any load levels
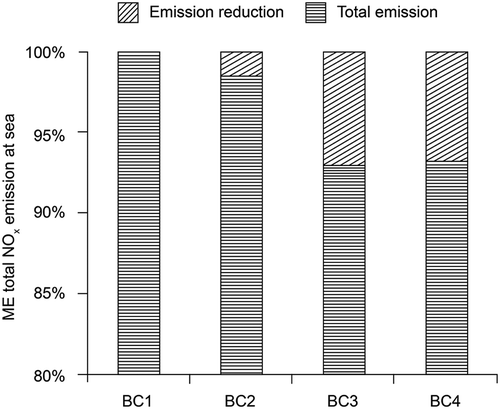
The effect of operation at low loads on the NOx emissions will become more obvious as the ME rated power increases. Large oil tankers and BCs have similar navigation modes. Based on the IMO statistical data in 2012, BCs and oil tankers with 10,000+ kW rated power account for 6,181 ships and 62.5% of the total installation power of these two types. The sum of the exhaust emissions from these two types of vessels is higher than that of container ships, and these are therefore considered to be the primary source of global marine pollution (IMO Citation2014). Hence, the total amount of emissions can be effectively reduced by controlling the exhaust emissions from ships by limiting the EF of the diesel engines at any load level, especially under slow steaming operation. Taking the four BCs studied in this work as an example, the EFs that exceed the Tier I or Tier II limits are uniformly reduced to 17.0 or 14.4 g/kWh, thereby complying with the MARPOL convention at any load level. As shown in , the BC3 and BC4 MEs are the most commonly used Tier II electrohydraulically controlled engines at present in comparison to those of BC1, which demonstrate the most effective level of emissions reduction at about 6.9% on average, which is equivalent to a 2,950,000 MT reduction in NOx emissions per year, according to IMO statistical data. In addition, the NOx EF of the BC3 and the BC4 ME may reach 22.23 and 20.14 g/kWh, respectively, at 10% engine load by linear extrapolation. The emission reduction effect during maneuvering operations in port is more significant, where the emissions can be reduced by approximately 31.9%, which is equivalent to a 150,000 MT annual NOx emission reduction. These reductions will help to significantly improve the air quality in coastal and port areas, as well as the health of local residents.
Figure 14. NOx emission reduction by limiting the NOx EF at any load levels.
Effect of fuel oil on NOx emissions
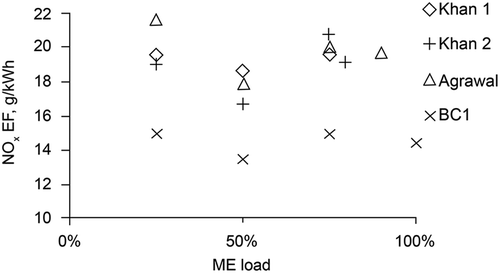
The fuel used in the test bed was of ISO DMA grade, whereas the cargo ships used HFO grade at sea. The use of HFO by the slow-speed diesel engine increases the NOx emissions by 6.4% (CARB Citation2008; IMO Citation2014). The heating value and carbon content of the HFO are lower than those of DMA grade, and the efficiency of diesel engines in actual navigation is generally lower than that in the test results obtained from the test bed. Actually, the SFOC is always 10–15% higher than the test values (IMO Citation2014). Therefore, the actual emissions from navigation would be greater than the results ( and ) calculated using the test values. Using the measurement and calculation methods specified in NTC 2008, Agrawal et al. (Citation2010) and Khan et al. (Citation2013) conducted on-board measurements on Tier 0 MEs, where the calculated NOx EFs turned out to be as high as 19.60 and 19.77 g/kWh, respectively. plots the EFs in comparison to those of BC1 and summarized from the related studies where the research objects were composed exclusively of Tier 0 large diesel engines, and the calculations were performed based on NTC 2008. Generally, Tier 0 diesel engines manufactured before 2000 were all focused on reducing the SFOC, although the NOx emissions are relatively high. The NOx emissions of Tier I diesel engines manufactured after 2000 and operated at low load levels are lower than those of Tier 0 engines. If the calculation is conducted based on the related study results, as shown in , the total NOx emissions from ships are likely to be overestimated.
Figure 15. EFs comparison of BC1 and related studies.
Conclusion
The NOx certification values obtained from the fixed-WF calculation specified in NTC 2008 do not correctly represent the emissions per unit work (kWh) when slow-speed two-stroke diesel engines are under long-term low-load operation because the WF allocation places more emphasis on the 75% power level. In this study, the PPEF and total NOx emissions calculated by using the proposed mathematical model of the actual power probabilities of each ship as the variation coefficient accurately represent the actual emissions of the diesel engines under any load variation at any point in time.
The total NOx emissions calculated using the fixed values published by the IMO, namely, 17.0 and 15.3 for Tier I and Tier II two-stroke diesel engines, are 3.0 to 20.3% higher than those in the PPEF model, and calculations that are based on the certification values may result in an underestimation of up to 10.4%.
The NOx emissions of Tier II engines with expected lower emissions are actually higher than 14.4 g/kWh under long-time and low-load operating conditions, as demonstrated in this study using the actual PPDF and mathematic model, and therefore fail to comply with the essence of the MARPOL Tier II regulations.
The mathematical model is useful, but depends on representative data on the load factors of a representative sample of the global fleet. Assume that the NOx EFs that exceed the Tier I or Tier II limits at any load levels should be limited to 17.0 or 14.4 g/kWh, or even lower, and regardless of weighting factors, which would allow them to comply with the MARPOL convention under any engine load conditions. Considering BC3 and BC4 ME load factor profiles as examples and applying these to IMO global fleet statistics, this will result in an effective and significant emission reduction of 6.9% and 31.9% at the sea and in port areas, respectively, which would substantially improve the air quality in coastal and port areas and the health of local residents. However, the direct use of clean fuels remains the most effective means to reduce emissions.
The correct calculation of the actual EFs and total emissions by using engine power probabilities as weighting factors, as demonstrated in this study, is very useful and applicable to the global shipping emissions inventory for purposes of life cycle assessment, effective emission reduction, and policy formulation. Future work will investigate the total emissions of pollutants and GHGs over the 25-year life cycle for large-scale ships using the mathematic model presented in this paper.
Conflicts of interest
The authors have no competing interest to declare.
Acknowledgments
The authors thank the classification societies and shipping companies in Taiwan for providing ship navigation and technical data.
Funding
This research did not receive any specific grant from funding agencies in the public, commercial, or not-for-profit sectors.
Additional information
Funding
Notes on contributors
Chih-Wen Cheng
Chih-Wen Cheng is a Phd student at the National Taiwan Ocean University.
Jian Hua
Jian Hua and Daw-Shang Hwang are Associate Professors at National Taiwan Ocean University.
Daw-Shang Hwang
Jian Hua and Daw-Shang Hwang are Associate Professors at National Taiwan Ocean University.
References
- Agrawal, H., W. A. Welch, S. Henningsen, J. W. Miller, and D. R. Cocker III. 2010. Emissions from main propulsion engine on container ship at sea. Journal of Geophysical Research 115:1–7. doi:10.1029/2009JD013346.
- Andereadis, P., A. Zompanakis, C. Chryssakis, and L. Kaiktsis. 2011. Effects of the fuel injection parameters on the performance and emissions formation in a large-bore marine diesel engine. International Journal of Engine Research 12:14–29.
- Banks, C., O. Turan, A. Incecik, G. Theotokatos, S. Izkan, C. Shewell, and X. Tian. 2013. Understanding ship operation profiles with an aim to improve energy efficient operations. London, UK: Low Carbon Shipping Conference.
- Borkowski, T., L. Kasyk, and P. Kowalak. 2011. Assessment of ship’s engine effective power, fuel consumption and emission using the vessel speed. Journal of KONES 18:31–9.
- CARB. 2008. Emissions estimation methodology for ocean-going vessels. http://www.arb.ca.gov/regact/2008/fuelogv08/appdfuel.pdf
- Corbett, J. J., and P. Fischbeck. 1997. Emissions from ships. Science 278:823–4. doi:10.1126/science.278.5339.823.
- Corbett, J. J., and H. W. Koehler. 2003. Updated emissions from ocean shipping. Journal of Geophysical Research 108 (D20):1–15. doi:10.1029/2003JD003751.
- Classification Societies. 2014. NOx technical files of diesel engines. Taipei, Tawain, ROC: Classification Societies.
- Doudnikoff, M., and R. Lacoste. 2014. Effect of a speed reduction of containerships in response to higher energy costs in sulfur emission control areas. Transportation Research Particle D: Transport and Environment 28:51–61. doi:10.1016/j.trd.2014.03.002.
- Endresen, Ø., E. Sørgård, J. K. Sundet, S. B. Dalsøren, I. S. Isaksen, T. F. Berglen, and G. Gravir. 2003. Emission from international sea transportation and environmental impact. Journal of Geophysical Research-Atmospheres 108 (D17). doi:10.1029/2002JD002898.
- European Commission and ENTEC UK Limited. 2002. Quantification of emissions from ships associated with ship movements between ports in European community. Brussels, Belgium: DG ENV.C1, European Commission.
- International Organization for Standardization, ISO 8178, Reciprocating internal combustion engines—Exhaust emission measurement—Part 4: Steady-state test cycles for different engine applications.
- International Maritime Organization. 2008a. International Maritime Organization, Conference of Parties to the International Convention for the Prevention of Pollution from Ships, 1973, as Modified by the Protocol of 1978 Relating Thereto, MP/CONF. 3/34, 28 October 1997, Consideration and adoption of the protocol of 1997 to amend the International Convention for the Prevention of Pollution from Ships, 1973, as modified by the protocol of 1978 relating thereto. Retrieved from https://docs.imo.org/Search.aspx?keywords=%22MP%2FCONF%203%2F34%22 (accessed August 2017).
- International Maritime Organization. 2008b. International Maritime Organization, Marine Environment Protection Committee, MEPC 57/21, 7 April 2008, Report of the Marine Environment Protection Committee on its fifty-seventh session. Retrieved from https://www.uscg.mil/imo/mepc/docs/mepc57-report.pdf (accessed August 2017).
- International Maritime Organization. 2008c. International Maritime Organization, Marine Environment Protection Committee, MEPC 58/23/Add.1, Annex 13, RESOLUTION MEPC.176(58). Adopted on 10 October 2008, Amendments to the annex of the protocol of 1997 to amend the International Convention for the Prevention of Pollution from Ships, 1973, as modified by the protocol of 1978 relating thereto (Revised MARPOL Annex VI). Retrieved from http://www.gc.noaa.gov/documents/Annex_VI_Air_Pollution.pdf (accessed August 2017).
- International Maritime Organization. 2008d. International Maritime Organization, Marine Environment Protection Committee, MEPC 58/23/Add.1, Annex 14, Resolution MEPC.177(58). Adopted on 10 October 2008, amendments to the technical code on control of emissions of nitrogen oxides from marine diesel engines. (NOx technical code 2008). Retrieved from http://www.imo.org/en/OurWork/Environment/PollutionPrevention/AirPollution/Documents/Air%20pollution/Resolution%20MEPC.177(58)%20NOx%20Technical%20Code%202008.pdf (accessed August 2017).
- International Maritime Organization. 2012. International Maritime Organization, Marine Environment Protection Committee, MEPC 63/23 Annex 8, 2012 Guidelines on the method of calculation of the attained energy efficiency design index (EEDI) for new ships. Retrieved from http://www.imo.org/en/OurWork/Environment/PollutionPrevention/AirPollution/Documents/212%2863%29.pdf (accessed August 2017).
- International Maritime Organization. 2014. International Maritime Organization, Marine Environment Protection Committee, MEPC 67/INF.3, Reduction of GHG emissions from ships, Third IMO GHG Study 2014-Final Report. Retrieved from http://www.imo.org/en/OurWork/Environment/PollutionPrevention/AirPollution/Documents/MEPC%2067-INF.3%20-%20Third%20IMO%20GHG%20Study%202014%20-%20Final%20Report%20(Secretariat).pdf (accessed August 2017).
- International Maritime Organization. 2016. International Maritime Organization, Marine Environment Protection Committee, MEPC 69/19/1, Development of guidelines for the use of more than one engine operational profile, submitted by Norway. Retrieved from https://docs.imo.org/Search.aspx?keywords=%22MEPC%2069-19-1%22 (accessed August 2017).
- Khan, M. Y., S. Ranganathan, H. Agrawal, W. A. Welch, C. Laroo, J. W. Miller, and D. R. Cocker III. 2013. Measuring in-use ship emissions with international and U.S. federal methods. Journal of the Air & Waste Management Association 63:284–91. doi:10.1080/10962247.2012.744370.
- Notteboom, T. E., and B. Vernimmen. 2009. The effect of high fuel costs on liner service configuration in container shipping. Journal of Transport Geography 17 (5):325–37. doi:10.1016/j.jtrangeo.2008.05.003.
- Winebrake, J. J., J. J. Corbett, and P. E. Meyer. 2006. Total fuel-cycle emissions for marine vessels: A well-to-hull analysis with case study. 13th CIRP International Conference on Life Cycle Engineering, Belgium, 1 June, LCE2006.
- Winebrake, J. J., J. J. Corbett, and P. E. Meyer. 2012. Energy use and emissions from marine vessels: A total fuel life cycle approach. Journal of the Air & Waste Management Association 57:102–10. doi:10.1080/10473289.2007.10465301.