
ABSTRACT
The increasing amount of food waste generated as a direct consequence of its excessive production, mismanagement, and wasteful behaviors represents a real challenge in promoting resource efficiency. In the United Kingdom (UK), the lack of robust mass flow data hinders the ability both to understand and address food waste challenges and to devise long-term sustainable prevention strategies. In recognition of these challenges, this paper seeks to (i) provide insights into the UK’s annual estimates of food mass flows, including imports, exports, distribution, consumption, surplus food production, and final disposal; and (ii) scrutinize the uptake and redistribution of surplus food as a potential food waste prevention strategy. Evidence collected from several enterprises and community-led initiatives in the UK, and London specifically, supports that there is an increasing potential of making a shift towards food redistribution and reuse. Further analysis has shown that the outreach of food redistribution initiatives in the UK is currently limited, possibly because redistribution efforts remain largely fragmented and independent from each other. It is concluded that a national commitment could be instrumental in encouraging the roll-out of this practice, and governmental support through fiscal incentives could lead to the development of a larger and coherent surplus food redistribution system, ultimately enabling food waste prevention and recovery of food’s multidimensional value.
Implications: This paper deals with the topical issue of the increasing amount of food waste generated as a direct consequence of excessive production, mismanagement, and wasteful behavior, representing a real challenge in achieving sustainability and resource efficiency. Currently, only a small fraction of food is redistributed back into the system. Yet, a considerable fraction of food waste generated is edible; thus, better planning, storage, and coordination amongst the different stakeholders in the food supply chain is required in order to prevent its wastage and promote its reuse in accordance with the waste hierarchy.
Introduction
In recent years, food waste has emerged as one of the world’s most pressing challenges. Although this is especially the case in industrialized countries, food wastage is becoming a growing concern in emerging economies, e.g., Brazil, India, and China, as well (Barilla Center for Food and Nutrition Citation2014). The increased distance between food production and consumption due to increased urbanization and globalization increases the risk of food losses during transportation, storage, and distribution. At the same time, changes in lifestyle and dietary patterns, due to increases in the available income, are shifting citizens’ preferences from starchy food to the consumption of increasing amounts of meat, fish, and fresh products such as fruits and vegetables, all of which are more perishable.
At the global level, it is estimated that one third of the food produced for human consumption is lost or wasted (Food and Agriculture Organization [FAO] Citation2011). In the United Kingdom (UK) alone, total food and drink waste accounts for about 15 million tonnes (Mt) per year (WRAP [Waste & Resources Action Programme] 2013b), approximately one quarter of the total food distributed for human consumption in the country. The United Nations, the European Union (EU), and various national and international organizations have rendered food wastage a key priority and a major area of concern and started promoting research and campaigns to raise awareness on this topic (xxx BIO Intelligence Service Citation2010; Defra Citation2013; European Parliament Citation2012; FAO Citation2011, 2013b; Citation2013a, House of Lords European Union Committee Citation2014; WRAP Citation2008).
As the world population is projected to reach 9.6 billion by 2050, resource and commodity limitations will make the challenge of food security greater in terms of both availability and demand. The world’s agricultural system will have to produce far more food and provide economic opportunities for hundreds of millions of rural poor, while reducing its environmental impacts, including ecosystem degradation, natural resource depletion, and high greenhouse gas emissions (World Resources Institute Citation2013).
When food is wasted, all the inputs and other values associated with its production (e.g., energy, water and fertilizers, land) are also “wasted” (FAO Citation2013b; House of Lords European Union Committee Citation2014; Kummu et al. Citation2012; WRAP Citation2008). Because of its biodegradable nature, when food is disposed of to landfill, it decomposes under anaerobic conditions releasing methane, a greenhouse gas that is 21 times more potent than carbon dioxide (Iacovidou et al. Citation2013; Pan and Nick Citation2007; Stuart Citation2009). It is estimated that the global carbon footprint of food waste is around 3.6 Gt of carbon dioxide (CO2) equivalent (eq), which in addition to the 0.8 Gt CO2 eq from deforestation and management of organic soils means that the total global carbon footprint of food waste is around 4.4 Gt of CO2 eq per year (or about 8% of total anthropogenic greenhouse gas emissions) (FAO, Citation2015). So, if global food waste was a country, it would rank as the third largest CO2 eq emitter in the world, after China and the United States (House of Lords European Union Committee Citation2014).
Besides the environmental impacts, food wastage also incurs significant economic costs. These costs are associated with the monetary value of the food wasted (i.e., the market price of individual goods) and of the primary resources consumed during its production, transportation, and consumption (Barilla Center for Food and Nutrition Citation2014; FAO Citation2011). Recent estimates show that food waste leads to total global losses of 750 billion USD, with UK’s contribution being at around 28.6 billion (19 billion GBP), excluding farm-level estimates (FAO Citation2013b). The social and moral dimensions of food waste are also important and become more pronounced the more we look into the levels or hunger and malnutrition in the world and the amounts of food waste that are produced each year (Papargyropoulou et al. Citation2014). As a matter of fact, it is estimated that the world’s nearly 1 billion hungry people could be lifted out of malnourishment on less than a quarter of the food that is currently wasted (Stuart Citation2009).
Evidently, food waste is an issue that needs to be urgently addressed; yet, limited evidence on how much is actually being wasted and at which stages of the supply chain is seriously hindering our ability to do so. Estimates on food waste generation are reported each year, but these are often based on different definitions of food waste and/or different measurement methods. This indicates that estimates could often be imprecise and incomparable, making it difficult to identify trends (Lebersorger and Schneider Citation2011; Östergren et al. Citation2014; Parfitt, Barthel, and Macnaughton Citation2010). Low data quality and uncertainty restrict our ability to understand the complexity of the food supply chain system and of the sources, patterns, and critical links between production, consumption, and disposal that all contribute to food waste generation.
Studies that attempted to provide some clarity to food and food waste mass flows have primarily focused on specific parts of the supply chain (C-Tech Innovation Ltd. Citation2002, Citation2004), denoting that a comprehensive food flow analysis of the whole supply chain is still lacking. Therefore, this study aims to look at the UK food supply chain and provide insights into the discrepancies that might be associated with food mass flows, looking at both upstream and downstream parts of the supply chain. In the UK, the Waste & Resources Action Programme (WRAP) launched the Love Food Hate Waste campaign in 2007 and conducted a number of in-depth studies and trials to help households reduce their food waste generation (WRAP Citation2009, Citation2011b, Citation2013b, Citation2013c, 2013d). It also developed the “Courtauld Commitment,” a voluntary agreement aimed at encouraging the UK grocery sector to reduce their food, drink, and packaging waste (WRAP Citation2013a). Additionally, a growing number of initiatives that aimed at the reduction of food waste through surplus food recovery and redistribution have emerged. These initiatives, which include community-led projects, food redistribution schemes, and schemes promoted by retailers and Internet platforms, have set their business case around food waste prevention and reuse. A second component of this study is to explore the potential of food redistribution as the next viable alternative and make suggestions as to how to pave the way towards food waste prevention and sustainable management.
Materials and methods
An extensive literature review was carried out to identify the food mass flows within the UK economy, including imports, exports, production, and consumption, as well as final disposal and management, based on annual estimates. But first: what is defined as food waste?
The Food and Agriculture Organization (FAO) proposes a distinction between food losses and food waste. Whereas food losses refer to the decrease in food quantity or quality taking place upstream of the food supply chain (i.e., production, postharvest, and processing stages), food waste indicates losses occurring downstream of the supply chain (i.e., distribution and consumption levels). Although this definition is reasonable, it created discrepancies in the way food waste was documented and, as such, the Food Loss and Waste (FLW) Protocol has developed an international standard to account and report “food loss and waste,” which is defined as any “food and/or associated inedible parts removed from the food supply chain” (Hanson et al. Citation2016). The FLW Protocol does not make a distinction between “food loss” and “food waste,” but it does considers as food waste both edible and inedible parts of food (e.g., bones, rinds, pits/stones, etc.) that are wasted across the entire food supply chain.
A distinction between edible and nonedible food waste is also made by WRAP. Edible food waste, of both avoidable and possibly avoidable nature, indicates all food and drink that is disposed of and may not be edible at the time of disposal (due to deterioration of quality, e.g., gone moldy) but which was edible at some point prior to disposal (see Table S1, Supplemental Materials) (WRAP Citation2013b). Nonedible waste is by definition “waste that is not fit for consumption” (e.g., bones, pits, and stones), hence unavoidable waste (see Table S1).
In this study, the term “food waste” is used to refer to both food losses and waste and indicates any raw or cooked food of edible and inedible nature that is discarded along the entire supply chain. More explicitly, it includes any food that is discarded, including food that is landfilled, composted, digested anaerobically, incinerated, and/or disposed to the sewer. This definition does not include crops intentionally grown for animal feed, or by-products originating from manufacturing operations that are used as ingredient in animal feed, as these are regarded by definition as nonwaste in the EU (European Commission Citation2012).
For the mass flow analysis, data on food production, consumption, and wastage within the UK supply chain were collected based on the conceptual food pathway presented in . Other pathways such as farmers’ markets, community supported agriculture, or production of food by consumers were not considered. Although food waste generation from these pathways may not be negligible, these were excluded from the food supply chain analysis due to the lack of available data.
Figure 1. UK food supply chain.
The FAO Food Balance Sheet for the United Kingdom 2011 (FAO Citation2014) was used to gather estimates on food production and distribution. Data on food consumption adopted from WRAP were distinguished between food purchases for consumption outside the household and inside the household (including food bought in supermarkets, corner shops, takeaways, and produce from allotments and gardens) (WRAP Citation2011b). All food waste estimates, including figures on food redistribution and co/by-products used as an ingredient in animal feed, were extrapolated from WRAP (WRAP Citation2013b, Citation2013c), whereas data on food waste disposal options were retrieved from Defra, which has gathered information from a variety of sources and developed overall figures on the amounts of waste processed by currently available management routes (Defra Citation2011b). The data available at the time of the study were often obtained from different years, but for the purposes of the study it was assumed that there is not a wide variation from one year to another. Details on data collection can be found in Table S2.
Semistructured interviews with stakeholders and food waste experts on existing initiatives that aimed at the reduction and recovery of food waste were conducted in London in 2014, and the figures/data provided were based on year 2013. The interviews were used in combination with evidence from the available literature, in order to collate information on how the surplus food redistribution system works.
Results
Food flows in the UK economy
A Sankey diagram, i.e., a flow chart illustrating flow directions and quantities, in which the width of the arrows is proportional to the flow quantity (Nuttbohm et al. Citation2009), was developed to represent the food mass flows in the UK economy (). Detailed description of the data used to construct the Sankey diagram can be found in Table S2.
Figure 2. UK food flow analysis.
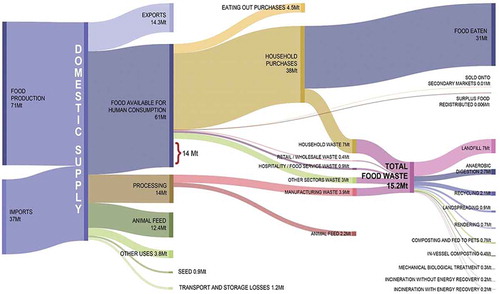
The sum of the food “imports” and “food produced” defined the total domestic food supply, which includes both primary commodities and processed commodities (e.g., olives and olive oil/wheat and wheat flour). This was then cascaded to food “exports,” “processing,” food grown for “animal feed,” food for “seed,” “transport and storage losses,” and “food available for human consumption” flows (FAO Citation2014). The total “food available for human consumption” flow in the UK was found to be approximately 61 Mt per annum, accounting for 57% of the total UK food supply (). Of this, 38 Mt were purchased for consumption in the household, of which 31 Mt were eaten and 7 Mt were thrown away. Moreover, 4.5 Mt (out of the 61 Mt) were purchased for consumption outside the household (WRAP Citation2011b); from the remaining 18.5 Mt, a significant fraction ended up as waste, including waste from the retail, wholesale, hospitality, and other sectors (e.g., pre–factory gate food waste) (WRAP Citation2013b). This, combined with the food waste produced from the manufacturing sector, adds up to a total of 15.2 Mt of food waste produced each year in the UK (WRAP Citation2013b), accounting for around 25% of the total food distributed for human consumption in the UK. Only a small fraction (0.016 Mt) of the food that is not consumed nor wasted is found to be redistributed for human consumption (WRAP Citation2013c).
Figure 3. The UK domestic food supply chain (including production and imports), with a focus on the distribution of food available for human consumption across the supply chain.
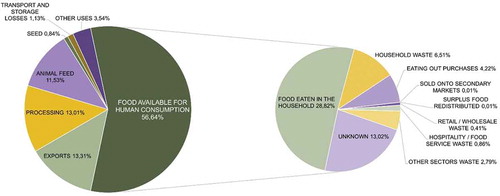
The percentage distribution of the domestic food supply in the UK and the proportions of food available for human consumption that is consumed and wasted across the various segments of the supply chain are shown in . Household consumption of food represents nearly one third of the total domestic food supply, whereas total food waste generated accounts for around one sixth of the total food supply.
Around 14 Mt in the food available for human consumption (13% of the total domestic food supply) is indicated as “unknown” (). This could be partly attributed to inconsistencies between data sets, and the inaccuracy and imprecision of available food waste data and associated estimates. An abundance of 7.9 Mt from the “processing” flow is also observed. This figure is misleading, as processed food is already accounted in the food for human consumption. The reasons behind this discrepancy could be that in the “food production” flow, all food products (i.e., primary [raw], processed, and primary food for processing) are accounted (meaning that there is possibly some double counting); processed foods are then accounted in the “food for human consumption” flow, whereas the primary food products for processing are accounted in the “processing” flow; an extraction rate is normally used to calculate the transformation of a primary commodity into a processed commodity (e.g., the weight of olives used to produce oil does not correspond to the weight of the olive oil produced, etc.), which means that the 7.9 Mt figure could in reality be much smaller.
Considering that in the FAO Food Balance Sheet the processed commodities obtained from manufacturing are indicated in separate food entries of the food balance (therefore already accounted for in “food production”) indicates that this discrepancy is a result of the way food data are reported. For example, deviations of the estimates of food available for human consumption could be attributed to uncertainties around estimates of the nonfood use such as seed, animal feed, processing, and losses. Despite these limitations, FAO data offered the most reliable estimates of food flows at a country level at the time of the study.
In evaluating the potential of food redistribution, it is clear that not all of the food waste generated is of edible nature. As such, the percentages of edible and nonedible waste, relative to each food waste flow, provide a better estimate of the real proportion of food waste that could have actually been avoided and consumed ().
Table 1. Edible vs. nonedible fractions of food waste.
Excluding potentially edible components in food waste from Others sectors due to the lack of data, it can be reported that around 10 Mt of food waste in the UK could have been avoided and consumed, accounting for around 22% of the total food available for human consumption or 12% of the total domestic food supply. This is a conservative estimate but a significant one, which has gained increased attention by both the industry and the media. For example, it has been recently reported in the press that UK supermarkets alone throw away 115,000 tonnes of edible food each year—which equates to £230 million going to waste (GS1 UK, Citation2016).
Factors contributing to food waste generation
The reasons behind food waste generation are numerous and vary greatly across the different stages and context of the food supply chain. Whereas in developing countries the majority of food losses occur mostly due to financial, technical, and infrastructural constraints at the postharvesting and storage levels, in industrialized countries food wastage occurs due to the wasteful practices of the food industry and consumers. In regards to the latter, changing lifestyles and dietary patterns, and aesthetic demands that impose stringent quality and cosmetic standards, seem to exacerbate the problem (Barilla Center for Food and Nutrition Citation2014; House of Lords European Union Committee Citation2014; Iacovidou et al. Citation2012b; Iacovidou, Ohandja, and Voulvoulis Citation2012a, Citation2012c; Lebersorger and Schneider Citation2011; Papargyropoulou et al. Citation2014).
For example, around 30% of the fruits and vegetables produced in India are wasted in postharvest handling due to the lack of cold storage facilities, which accounts for 18% of this loss (Emerson Citation2013). In the UK, the large amount of food waste that is generated upstream in the supply chain is largely due to the problematic relationships between producers and retailers. Large food waste arisings can occur at both the farm and manufacturing stages due to factors such as contractual requirements, product standards, and poor demand forecasting (FAO Citation2013a). Farmers and manufacturers are frequently tied to only one or two customers (retailers), who often change or cancel their forecast orders at the last minute, leaving producers with large quantities of unsold food that is likely to be thrown away (Stuart Citation2009). Strict product quality standards are another important driver of food wastage in the production level. It is estimated that about 30% of vegetable and fruit crops in UK farms are not harvested because they fail to meet retailers’ tight cosmetic standards (Stuart Citation2009; Vision Citation2020 Citation2013). This high figure is in contrast with similar estimates from the United States, where approximately 7% of planted fields are typically not harvested each year (Gunders Citation2012). Food waste arisings at the farm level are considered to be “the biggest unknown of all waste statistics” (Stuart Citation2009). This might be because farmers can plough crops that are not legally classified as waste back into their fields, meaning that this waste remains largely unmeasured.
At the processing level, contamination, accidental spillage, technical limits on production, and operation and process losses are among the main reasons for food waste generation (Parfitt, Barthel, and Macnaughton Citation2010). This food waste is mainly composed of animal by-products, fruit and vegetable trimmings, whey from cheese making, and other biodegradable matter that cannot be eaten. In the hospitality sector, food waste arises from spoilage, food preparation, and food left on consumers’ plates (Valpak Ltd. and WRAP Citation2013), whereas at the retail level it is mostly due to extensive inefficiencies in marketing and sale strategies, such as the common practice of overstocking to ensure that customers’ favorite products are always available (Stuart Citation2009). Compliance with food safety legislation and quality standards, poor management of reserves, as well as deterioration of products or packaging due to poor handling are other causes of food waste at the distribution stage of the supply chain.
However, the highest proportion of food waste originates from households, accounting for 46% of the total food waste generated across the whole supply chain and around 11% of the food distributed for human consumption. This quantity is much lower than similar estimates from the United States, where consumer-level waste represents up to 21% of the available food supply (Buzby, Farah-Wells, and Hyman Citation2014). Nevertheless, household waste still represents the largest food waste flow in the UK and has been the focal point of a number of studies around waste management and food waste reduction strategies.
WRAP estimated that an average person in the UK produces around 110 kg of food waste per year, of which 86 kg could have been avoided through better planning, purchasing, storage, and/or preparation (WRAP Citation2013b). In fact, at the household level, most of the food is wasted either because it is not used on time or because too much of it is cooked, prepared, and/or served (WRAP Citation2009). Promotions such as “buy one, get one free” may incentivize consumers to purchasing larger volumes of food than they are able to consume, leading to its inevitable, but unnecessary wastage (FAO Citation2013a; Stuart Citation2009). Another cause of increasing food wastage in households is the confusion generated by the date labeling on food products, as only 37% of consumers know the difference between “use by” and “best before” dates on food packaging (FAO Citation2013a). To elaborate, “use by” labels refer to the safety of the product and are intended for highly perishable foods (e.g., milk, yogurt, cured meat), whereas “best before” refer to the quality of the product, meaning that the food is still safe to consume after that date even though some characteristics such as taste, texture, or appearance may be altered (e.g., bread, cheese, tinned tuna) (FAO Citation2013a).
Surplus food redistribution for human consumption
“Surplus food” can be defined as food that is still perfectly edible and reusable but due to aesthetic criteria or lack of demand is rejected (considered of no further use) by producers and retailers. The dividing line between surplus food and food waste is very thin, as surplus food can easily become waste if not redirected to reuse quickly. Surplus food is produced at every stage of the supply chain and arises from a variety of sources, including farms, manufacturers, supermarkets, local grocery shops, bakeries, and restaurants. This means that the types of surplus food generated may vary greatly and can include agricultural crops, perishable fresh or prepared foods, and nonperishable processed foods (Hawkes and Webster Citation2000). The reasons for surplus food arisings are many and varied, including size and shape, small blemishes, mislabeling, incorrect or damaged packaging, expiration date, and cancelled orders (Alexander and Smaje Citation2008; Schneider Citation2013; WRAP Citation2014). Overproduction may also lead to food surplus arisings, a phenomenon that has now become so widespread that it constitutes a real threat to global food security, rather than a safeguard against unpredictable weather patterns and other catastrophic events. It is estimated that a food supply of 130% above our current nutritional needs would be sufficient to guarantee food security, but in high-income countries this supply can often go up to 200% of the food that is physically needed, leading to massive wastage (Papargyropoulou et al. Citation2014; Stuart Citation2009).
A way of dealing with surplus food in a sustainable manner is to redistribute it for human consumption through different channels: through charities and community-led initiatives for feeding those in need; development of secondary markets for products rejected by retailers but are still fit for human consumption (e.g., by selling surplus food in farmers’ markets or in community shops at discounted prices); or establishment of new value chains and businesses by transforming surplus food into new products, such as jams, chutneys, and juices.
In some European countries, surplus food redistribution is well established and implemented on a large scale. For instance, in Spain and France, more than 100,000 tonnes of food are redistributed each year (Webster Citation2014). In the UK, this intervention is still in its infancy, with only a tiny percentage of food available for human consumption being redistributed to charities (about 6000 tonnes) or sold onto secondary markets every year. The most recent estimates about surplus food redistribution are provided by the All-Party Parliamentary Inquiry into Hunger and Food Poverty, according to which only 2% of surplus food generated by retailers, manufacturers, and suppliers was redistributed in the UK in 2015, whereas 98% was composted, turned into energy, or disposed of to landfill (Downing, Priestley, and Carr Citation2015). In fact, it has been estimated that around 400,000 tonnes of surplus food produced by retailers and restaurants are available for redistribution in the UK (Spillett Citation2014), indicating that the volume of food currently redistributed could be increased by approximately 60 times. However, this estimate does not take into account the potential for gleaning unharvested crops from farmers’ fields (Stuart Citation2009), meaning that this figure could in reality be much higher.
Nonetheless, not all of the food that is wasted could be reclaimed through redistribution; yet, a significant proportion that is currently disposed as waste could be redirected for human consumption. It estimated that 10% of the 3.9 Mt of food wasted every year by the food and drink industry (up to 3% of the total amount of food waste generated in the UK) is surplus food that is fit for reuse (FareShare Citation2015). These quantities may appear trivial in comparison with the entire amount of food waste generated, but if salvaged they could contribute to a reduction of food waste. Notwithstanding the potential of food prevention strategies to reduce food waste generation, some amounts of surplus food are always likely to be present even in the best-designed supply chain systems. As such, surplus food redistribution should be seen as an additional prevention option for the better management of the food supply chain system.
Surplus food redistribution initiatives: Examples from the London region
In the UK, there are several organizations and initiatives that aim to reduce and recover food waste through surplus food redistribution, which despite their currently limited scale make a real impact in reducing food waste and food poverty. At present, the largest food redistribution charities are FareShare, which collaborates with a network of major retailers and producers to redistribute surplus food to local charities and community projects across the UK (FareShare Citation2014), and FoodCycle, which operates in 23 locations across the country serving nutritious meals, made with surplus food, to people at risk of social isolation and food poverty (FoodCycle Citation2017). In addition, various community-led projects and social enterprises that save surplus food from going to waste are sprouting in the country. Social media and Internet platforms are also starting to play an important role in food waste redistribution, by connecting and sustaining networks between businesses willing to donate their surpluses and local charities, community groups, or social entrepreneurs.
Within the UK, London has the largest number of food redistribution initiatives. provides a list of these initiatives and indicates the type of activities they carry out, the places from where they source surplus food, and the amount of food they save from becoming waste. This list is not exhaustive but offers a broad overview of the existing business models of a number of food redistribution initiatives. It must be highlighted that the amount of surplus food salvaged (as shown in ) varies widely between the different initiatives and can be expressed in yearly, monthly, weekly, or daily figures. This is mainly due to the number of events that these initiatives organize, which may depend on their organizational structure, variability in the amount and frequency of surplus food supply, and segment of the public they reach. Because of these factors, the number of events organized varies considerably during the course of a year, often making it difficult to provide annual estimates. It must be noted that another reason for the variation observed in is that at the time of the interviews, some of the initiatives were at the start of their business; hence, they were unable to provide annual estimates.
Table 2. London food redistribution initiatives.
Discussion
A large amount of the food mass flowing through the UK economy is wasted, but speculations indicate that a considerable fraction of it could be redistributed back to the supply chain. The exact fraction of this food is hard to estimate, largely because of data uncertainties and potential inaccuracies associated with both food waste generation and surplus food redistribution.
Food waste documentation and uncertainty
In regards to food waste generation, estimates may depend on a number of interrelating factors, ranging from macro (cultural, economic, etc.) to micro (knowledge of what can be frozen, portion sizes, etc.) at all stages of the supply chain, as well as data availability, measurement methods, and transparency (FAO Citation2011). Moreover, the use of varying definitions of food waste around the globe aggravates the uncertainty problem, as it leads to the production of data sets that may not be comparable, making it difficult to monitor global trends (Lebersorger and Schneider Citation2011; Östergren et al. Citation2014; Parfitt, Barthel, and Macnaughton Citation2010). Even in places where the definition may not be an issue, stakeholders fail to meticulously document food waste generation rates, whereas others that may have this information documented they are often unwilling to share it (Stuart Citation2009). This means that estimates are most frequently calculated based on data provided by businesses/stakeholders that are efficient (i.e., hence have no reluctance in sharing their data), overlooking those that are perhaps more wasteful. As a result, it is very likely that the amount of food waste generated in the UK is much higher than that is actually documented.
The lack of transparency in food waste generation rates is more pronounced upstream in the supply chain; for example, in the farm level, large amounts of fruits, vegetables, fish, and meat (most often including edible parts, e.g., offal) may be discarded during processing. On the household level, self-documentation may also be unreliable. For instance, Stuart (Citation2009) have reported that several studies have found that householders tend to underestimate how much food they actually waste, sometimes by as much as 30 times (Stuart Citation2009). At the downstream part of the supply chain when food surplus redistribution and food waste management take place, uncertainties may also exist. Figures on the volume of food redistributed are often based on data from large organizations, hence neglecting to account for the amounts of food saved by the smaller initiatives.
Therefore, the amount of surplus food that may be available for redistribution could remain largely unknown due to undocumented surplus food production upstream (e.g., in the farm and manufacturing sectors) and downstream (e.g., in the distribution and retail sectors) of the food supply chain. This is also the case for food waste generation rates, of which figures might be underestimated due to disposal of food waste via other means (e.g., use of food waste disposal units [FWDs], littering, etc.).
The food waste hierarchy
Despite the uncertainties around its documentation, food wastage is regarded as an unacceptable practice, and appropriate measures are to be adopted in order to control this problem. The food waste hierarchy (), proposed in the EU Waste Framework Directive (European Parliament and Council Citation2008), provides guidance for reducing food waste.
Figure 4. Food waste hierarchy (adapted from Papargyropoulou et al. Citation2014; Vision Citation2020 Citation2013).
The UK government has formally adopted the principles of the food waste hierarchy into its national waste strategy (Defra Citation2011a). However, the way food waste is currently managed does not conform to this hierarchy. Around 46% of all food waste generated is sent to landfill, with only approximately 18% and 14% sent to anaerobic digestion and recycling (including composting), respectively (Defra Citation2011b). Additionally, only 14% of food waste from manufacturing operations is used as ingredient for animal feed, whereas the amount of surplus food redistributed or sold onto the secondary market is extremely small (WRAP Citation2013c). The existing legislative framework and fiscal environment favors options further down the food waste hierarchy, hence neglecting opportunities for reuse through the distribution of food for feeding people or livestock.
For example, the EU Animal By-products regulation, established after the foot-and-mouth disease outbreak in 2001 to prohibit the use of any food that contains or has been in contact with meat, fish, or other products of animal origin, including all catering waste for animal feed (FAO Citation2013a), has in many cases acted as a barrier to the redistribution of food to livestock. At the same time, the need to divert 75% of biodegradable waste from landfill by 2020, coupled with concerns about climate change, have led to the expansion of energy-from-waste technologies such as anaerobic digestion that are highly subsidized by the UK government (Defra Citation2011a; Spillett Citation2014). Although this technology can offer multiple benefits through biogas and digestate production, it undermines prevention initiatives and fails to support food reuse.
Amongst the prevention strategies that have been occasionally promoted to support sustainable food management, the redistribution of food back to the supply chain stands out due to its potential to prevent food waste generation at various stages of the supply chain. Efficient supply chain management and household consumer behavior are considered to be the two main areas that could affect the uptake of food redistribution initiatives (Midgley Citation2014). Although there is an undeniable urgency to reduce food waste by addressing its root causes, it is also true that the way the food system is currently designed to operate, food surpluses are extremely difficult to avoid.
In fact, unpredictable weather and climatic patterns, mismatches between supply and demand, and the market’s need to ensure variety, quality, and freshness of products mean that there will always be an amount of surplus food that needs to be managed. For this reason, having a system in place that promptly redirects these surpluses to businesses that are in need for food, while saving energy and money on waste disposal and management, could be a potential solution.
Surplus food redistribution
A FAO report suggests that as a result of food wastage 3.3 Gt of global CO2 eq emissions (i.e., 7% of global greenhouse gas emissions [GHGs]) and consumption of 250 billion cubic meters (km3) of surface and groundwater are emitted and wasted each year, respectively (FAO Citation2013a). In the UK, WRAP demonstrates that by reducing avoidable food waste through food redistribution from the manufacture/retail sectors could lead to a reduction of approximately 3.1 tonnes of CO2 eq per tonne of food waste, while saving around 1000 m3 of water per tonne of food waste (WRAP Citation2015). In addition, redistribution of surplus food may result in economic savings for the businesses donating the food, the charities receiving it, and their final beneficiaries; these savings could be spent on purchasing other goods and services of significant importance to increasing social welfare (FareShare Citation2015; Schneider Citation2013). Increasing the efficiency and productivity of the food supply chain system means that the capital, labor, and natural resources (land, water, and energy) used to produce, transport, and sell food will also be used more efficiently (WRAP Citation2015), hence maximizing the recovery of multidimensional value, i.e., environmental, economic, social, and technical value embedded in and associated with food waste (Iacovidou et al. Citation2017).
Therefore, food redistribution and reuse initiatives can be seen as a value recovery strategy that could potentially address environmental, economic, and social aspects. Indicatively in 2014, FareShare received 7360 tonnes of surplus food, which was redistributed to support 1923 charities and community projects, contributing toward more than 15.3 million meals. Over 149,000 people benefit from FareShare’s food redistribution every week, saving charities on average £13,000 a year (a combined saving of nearly £20 million), 80% of which are reinvested into additional support services. At the same time, the food redistributed by FareShare helps businesses reduce their CO2 eq emissions, which in 2014 alone contributed to a saving of approximately 25,000 tonnes of CO2 eq emissions (FareShare Citation2015).
In other countries, surplus food redistribution to charities has been encouraged and subsidized, reducing greatly the amount of food ending up in the waste stream (Webster Citation2014). For example, the Good Samaritan laws in the United States have supported the development of food redistribution, which contributes to more than 1 Mt of food donated each year (Stuart Citation2009). The Good Samaritan laws are often criticized for the potential to produce perverse consequences (FAO Citation2013a), as they protect food donors from the legal liability that might arise from their donations, which is seen as a form of risk in the quality and safety of the food redistributed (Schneider Citation2013). However, under this legislation, food donors are still responsible to deliver good-quality products in accordance to safety and hygiene regulations. The extra level of reassurance that this law provides can be critical in stimulating donation, without compromising the necessary safeguards (Bio by Deloitte Citation2014).
By offering an institutional enabling environment and encouraging the private sector to donate its food through more adequate fiscal incentives, government policies could support redistribution and the creation of a market for surplus food. For example, if food waste were taxed, regardless of the disposal method, more companies and businesses would be incentivized to donate their food in the same way in which the landfill tax encouraged the uptake of composting and anaerobic digestion. In France, food donors qualify for a tax credit equal to 60% of the value of the food donated and fiscal incentives have been applied in a way that it is now more expensive for businesses to send food to anaerobic digestion plants than to donate it (Bio by Deloitte Citation2014). Similarly, in Spain, 35% of the net value of the food donated can be claimed as a corporate tax credit (Bio by Deloitte Citation2014). To a certain extent, this can explain why 100,000 tonnes of food in France and 118,000 tonnes in Spain are donated by retailers and suppliers every year, compared with only 5900 tonnes in the UK (Webster Citation2014).
To push for an expansion of these initiatives in the UK, it would require the presence of fiscal incentives to support food donation and redistribution at a larger scale. Furthermore, it would need a constant and rather large amount of food to be made available to them, and at a readily manner, so that surplus food markets have a suitable basis for development. Currently, the unpredictable nature of surplus food availability acts as a barrier to the expansion of food reuse initiatives. Collaborations between different redistribution organizations across sectors can reduce risks related to food redistribution at different levels of the supply chain and provide certified information about the quantity and quality of the food that is made available.
At present, redistribution efforts remain largely fragmented and independent from each other, and logistic issues relating to transport and availability of the processing facilities and storage space create further difficulties to their long-term existence. Therefore, the development of a larger redistribution system needs to be supported and sustained through a stronger national commitment, as well as a stronger communication and collaboration between all stakeholders involved. This can be achieved by the development of a network of producers, retailers, and other supply chain stakeholders, connected through specific online platforms and providing up-to-date information on the level, location, amount, and type of surplus food available. This could enable redistribution initiatives to be swiftly responsive to the amount and types of surplus food that are available, reducing its wastage up to extraordinary levels. Hence, the development of a food surplus database is essential not only from an economic and a social perspective, but also from the environmental perspective, as it will essentially circulate food back into the supply chain, enabling its efficient utilization, preventing its wastage, and salvaging its value.
Arguments that surplus food redistribution offers little incentive to change industry behavior cannot be ignored (Midgley Citation2014). Although these arguments point to the fundamental inefficiencies that characterize our food system, they fail to consider the far-reaching opportunities that food redistribution initiatives can bring about, as they are instrumental in raising awareness about food waste and can transform wasteful behaviors. The truth is that people are not fully aware of the scale of food waste and surplus food generated, because a large part of it is invisible to them. At the same time, they are presently disconnected from how food is produced, which has an adverse effect on the way they value food.
As such, surplus food redistribution initiatives can essentially lead to a change in the cultural mindset and the way consumers currently value and engage with food, which is one of the underlying causes of food waste. In fact, increased awareness can have significant trickle down effects: as food waste becomes more visible, people become more conscious of waste, and this can have an impact in terms of food waste generation at the household level. This can be compared to the impact that separate food waste collection schemes have been found to have on the reduction of household food waste generation, as they help people realize how much food they actually waste, which in turn motivates them to implement ways to avoid some of that wastage (WRAP Citation2011a). This is especially meaningful not only because it can reduce food waste generation, but also because it can make people more aware of the value embedded in any resource or product they use, taking responsibility for its proper disposal at the end of its lifetime.
Conclusion
A glimpse into the UK food supply chain has unveiled potential stages at which interventions can be made in order to either gain better data on food production and management (hence addressing important research gaps) or address food waste minimization goals. Currently only a small fraction of food is redistributed back in to the system. Yet, a considerable fraction of food waste generated is edible, emphasizing that better planning, storage, and coordination amongst the different stakeholders in the food supply chain could prevent its wastage and promote its reuse in accordance with the waste hierarchy. Although there are numerous prevention strategies that focus on reducing food wastage, surplus food redistribution has not been gaining the same attention. This might be because current policies incentivize food waste prevention and management options, such as campaigns, and waste treatment via anaerobic digestion and composting, neglecting to account for the multiple benefits that surplus food redistribution can provide to the environment, economy, and society.
At present, food redistribution initiatives have a limited outreach and are largely fragmented and independent from each other. Yet, the development of a larger and more coherent food surplus redistribution system appears to be promising in achieving food waste prevention at all stages of the food supply chain and is considered to be instrumental in promoting the recovery of food’s multidimensional (i.e., environmental, economic, social, and technical) value. A strong national commitment and governmental support through the provision of fiscal incentives are fundamental in creating the enabling environment required for a large surplus food redistribution system to be developed.
Supplemental Document
Download MS Word (40.3 KB)Supplemental material
Supplemental data for this paper can be access on the publisher’s website.
Additional information
Notes on contributors
Elisa Facchini
Elisa Facchini, Centre for Environmental Policy, Imperial College London, London, UK.
Eleni Iacovidou
Eleni Iacovidou, School of Civil Engineering, University of Leeds, Leeds, UK.
Jan Gronow
Jan Gronow, Resource & Waste Solutions LLP, Cirencester, UK.
Nikolaos Voulvoulis
Nikolaos Voulvoulis, Centre for Environmental Policy, Imperial College London, London, UK.
Related Research Data
References
- Alexander, C., and C. Smaje. 2008. Surplus retail food redistribution: An analysis of a third sector model. Resour. Conserv. Recycl. 52 (11):1290–98. doi:10.1016/j.resconrec.2008.07.009.
- Barilla Center for Food and Nutrition. 2014. Food waste: Causes, impacts and proposals. Parma, Italy: Barilla Center for Food and Nutrition.
- Bio by Deloitte. 2014. Comparative Study on EU Member States’ legislation and practices on food donation: Executive Summary. Brussels, Belgium: European Economic and Social Committee.
- BIO Intelligence Service. 2010. Preparatory study on food waste across EU 27: Final report. Paris, France: European Commission (Environment Directorate).
- Buzby, J.C., H. Farah-Wells, and J. Hyman. 2014. The estimated amount, value, and calories of postharvest food losses at the retail and consumer levels in the United States. USDA-ERS Economic Information Bulletin 121:1–33
- C-Tech Innovation Ltd. 2002. Agricultural waste mass balance: Opportunities for recycling and producing energy from waste technologies Chester, UK: C-Tech Innovation Ltd.
- C-Tech Innovation Ltd. 2004. United Kingdom food and drink processing mass balance: A Biffaward programme on sustainable resources use. Warwickshire, UK: C-Tech Innovation Ltd.
- Defra. 2011a. Government review of waste policy in England 2011. London: Defra.
- Defra. 2011b. Recycling of catering and food waste—Evidence project final report. Loughborough, UK: Defra.
- Defra. 2013. Waste prevention programme for England: Priority areas. Loughborough, UK: Defra.
- Downing, E., S. Priestley, and W. Carr. 2015. Food waste. London: House of Commons Library.
- Emerson. 2013. The food wastage & cold storage infrastructure relationship in India. In Developing realistic solutions. Pune, India: Emerson Climate Technologies.
- European Commission. 2012. Guidance on the interpretation of key provisions of Directive 2008/98/EC on waste. Brussels, Belgium: Directorate Environment.
- European Parliament. 2012. European Parliament resolution of 19 January 2012 on how to avoid food wastage: Strategies for a more efficient food chain in the EU (2011/2175(INI)). Brussels: European Commission.
- European Parliament and Council. 2008. Directive 2008/98/EC of 19 November 2008 on waste and repealing certain directives (Waste Framework Directive). Official Journal of the European Union. Brussels, Belgium: EPC.
- Food and Agriculture Organization. 2011. Global food losses and food waste—Extent, causes and prevention. Rome, Italy: Food and Agriculture Organization.
- Food and Agriculture Organization. 2013a. Food wastage footprint: Impacts on natural resources. Rome, Italy: Food and Agriculture Organization.
- Food and Agriculture Organization. 2013b. Toolkit: Reducing the food wastage footprint. Rome, Italy: Food and Agriculture Organization.
- Food and Agriculture Organization. 2014. Food balance sheet for the United Kingdom 2011, ed. FAOSTAT. Rome, Italy: Food and Agriculture Organization.
- Food and Agriculture Organization. 2015. Food wastage footprint & climate change Accessed xxx. http://www.fao.org/fileadmin/templates/nr/sustainability_pathways/docs/FWF_and_climate_change.pdf.
- FareShare. 2014. Charity provides one million meals a month as demand for food soars. Accessed xxx. http://www.fareshare.org.uk/wp-content/uploads/2014/03/FareShare-provides-food-for-1-million-meals-a-month.pdf.
- FareShare. 2015. FareShare food efficiency framework. London, UK: FareShare.
- FoodCycle. 2017. FoodCycle fact sheet. Accessed xxx. http://www.foodcycle.org.uk/wp-content/uploads/2017/06/FoodCycle-factsheet_July-2017.pdf.
- Gunders, D. 2012. Wasted: How America is losing up to 40 percent of its food from farm to fork to landfill. New York, NY: Natural Resources Defense Council.
- GS1 UK. 2016. Barcodes and global standards help battle food waste. Accessed xxx: https://www.gs1uk.org/our-industries/news/2016/11/01/weve-signed-up-to-support-the-newly-launched-campaign-by-the-grocer-waste-not-want-not.
- Hanson, C., B. Lipinski, K. Robertson, D. Dias, I. Gavilan, P. Gréverath, S. Ritter, J. Fonseca, R. Van Otterdijk, T. Timmermans, J. Lomax, C. O’Connor, A. Dawe, R. Swannell, V. Berger, M. Reddy, D. Somoyi, B. Tran, B. Leach, and T. Quested. 2016. Food loss and waste accounting and reporting standard (FLW standard). Washington DC: Food Loss and Waste Protocol.
- Hawkes, C., and J. Webster. 2000. Too much and too little? Debates on surplus food redistribution. London, UK: Sustain.
- House of Lords European Union Committee. 2014. Counting the cost of food waste: EU food waste prevention. London, UK: The Stationery Office.
- Iacovidou, E., M. Vlachopoulou, S. Mallapaty, D.G. Ohandja, J. Gronow, and N. Voulvoulis. 2013. Anaerobic digestion in municipal solid waste management: Part of an integrated, holistic and sustainable solution. Waste Manage. (Oxford) 33 (5):1035–36. doi:10.1016/j.wasman.2013.03.010.
- Iacovidou, E., J. Millward-Hopkins, J. Busch, P. Philip, C.A. Velis, J.N. Hahladakis, O. Zwirner, and A. Brown. 2017. A pathway to circular economy: Developing a conceptual framework for complex value assessment of resources recovered from waste. J. Cleaner Prod. 168 (Suppl. C):1279–88. doi:10.1016/j.jclepro.2017.09.002.
- Iacovidou, E., D.-G. Ohandja, J. Gronow, and N. Voulvoulis. 2012b. ‘The household use of food waste disposal units as a waste management option: A review”. Critical Reviews in Environmental Science and Technology 42:1485–508. doi:10.1080/10643389.2011.556897.
- Iacovidou, E., D.-G. Ohandja, and N. Voulvoulis. 2012c. Food waste co-digestion with sewage sludge—Realising its potential in the UK. J. Environ. Manage. 112:267–74. doi:10.1016/j.jenvman.2012.07.029.
- Iacovidou, E., D.-G. Ohandja, and N. Voulvoulis. 2012a. Food waste disposal units in UK households: The need for policy intervention. Sci. Total Environ. 423:1–7. doi:10.1016/j.scitotenv.2012.01.048.
- Kummu, M., H. De Moel, M. Porkka, S. Siebert, O. Varis, and P.J. Ward. 2012. Lost food, wasted resources: Global food supply chain losses and their impacts on freshwater, cropland, and fertiliser use. Sci. Total Environ. 438:477–89. doi:10.1016/j.scitotenv.2012.08.092.
- Lebersorger, S., and F. Schneider. 2011. Discussion on the methodology for determining food waste in household waste composition studies. Waste Manage. (Oxford) 31 (9–10):1924–33. doi:10.1016/j.wasman.2011.05.023.
- Midgley, J.L. 2014. The logics of surplus food redistribution. J. Environ. Plann. Manage. 57 (12):1872–92. doi:10.1080/09640568.2013.848192.
- Nuttbohm, K., L. Fischer, L. Muckenfuss, and S. Baiboks. 2009. Visualising sustainability communication with Sankey diagrams—A viable approach? In Environmental Informatics and Industrial Environmental Protection: Concepts, Methods and ToolsBerlin, Germany: EnviroInfo.
- Östergren, K., J. Gustavsson, H. Bos-Brouwers, T. Timmermans, O. Hansen, H. Møller, G. Anderson, C. O’Connor, H. Soethoudt, T. Quested, S. Easteal, A. Politano, C. Bellettato, M. Canali, L. Falasconi, S. Gaiani, M. Vittuari, F. Schneider, G. Moates, K. Waldron, and B. Redlingshöfer. 2014. In FUSIONS Definitional Framework for Food Waste, Sweden: SIK. https://www.eu-fusions.org/phocadownload/Publications/FUSIONS%20Definitional%20Framework%20for%20Food%20Waste%202014.pdf.
- Pan, J., and V. Nick. 2007. The role of mechanical and biological treatment in reducing methane emissions from landfill disposal of municipal solid waste in the United Kingdom. J. Air Waste Manage. Assoc. 57:155–63. doi:10.1080/10473289.2007.10465317.
- Papargyropoulou, E., R. Lozano, J.K. Steinberger, N. Wright, and Z. B. Ujang. 2014. The food waste hierarchy as a framework for the management of food surplus and food waste. J. Cleaner Prod. 76:106–15. doi:10.1016/j.jclepro.2014.04.020.
- Parfitt, J., M. Barthel, and S. Macnaughton. 2010. Food waste within food supply chains: Quantification and potential for change to 2050. Philos. Trans. R. Soc. London, Ser. B 365 (1554):3065–81. doi:10.1098/rstb.2010.0126.
- Schneider, F. 2013. The evolution of food donation with respect to waste prevention. Waste Manage. (Oxford) 33 (3):755–63. doi:10.1016/j.wasman.2012.10.025.
- Spillett, R. 2014. Supermarkets only give 2% of unwanted food to hungry families and send the rest to be turned into biofuel because it is cheaper. London, UK: Daily Mail. http://www.dailymail.co.uk/news/article-2646997/Supermarkets-send-tonnes-food-biogas-feeding-hungry-green-energy-subsidies.html.
- Stuart, T. 2009. Waste: Uncovering the global food scandal. London, UK: Penguin.
- Valpak Ltd. and WRAP. 2013. PlasFlow 2017, ed. Valpak Ltd. and Waste & Resources Action Programme (WRAP). Banbury, UK: Waste & Resources Action Programme (WRAP).
- Vision 2020. 2013. Vision 2020: UK roadmap to zero food waste to landfill. London, UK: Vision2020 Network Ltd.
- Webster, B. 2014. Britain shamed over supermarket waste. http://www.thetimes.co.uk/tto/news/uk/article4113022.ece.
- World Resources Institute. 2013. Creating a sustainable food future: A menu of solutions to sustainably feed more than 9 billion people by 2050. Washington DC: World Resources Institute.
- WRAP. 2008. The food we waste. Banbury, UK: Waste & Resources Action Programme.
- WRAP. 2009. Household food and drink waste in the UK. Banbury, UK: Waste & Resources Action Programme.
- WRAP. 2011a. Literature review—Relationship between household food waste collection and food waste prevention. Banbury, UK: Waste & Resources Action Programme.
- WRAP. 2011b. New estimates for household food and drink waste in the UK. Banbury, UK: Waste & Resources Action Programme.
- WRAP. 2013a. The Courtauld Commitment—Information sheet. Banbury, UK: Waste & Resources Action Programme.
- WRAP. 2013b. Estimates of food and packaging waste in the UK grocery retail and hospitality supply chain. Banbury, UK: Waste & Resources Action Programme.
- WRAP. 2013c. Estimates of waste in the food and drink supply chain. Banbury, UK: Waste & Resources Action Programme.
- WRAP. 2014. Food connection programme—Final report. Banbury, UK: Waste & Resources Action Programme.
- WRAP. 2015. Strategies to achieve economic and environmental gains by reducing food waste. Banbury, UK: Waste & Resources Action Programme.