
ABSTRACT
In the present study, personal exposure to fine particulate matter (particulate matter with an aerodynamic diameter <2.5 μm [PM2.5]) concentrations in an urban hotspot (central business district [CBD]) was investigated. The PM monitoring campaigns were carried out at an urban hotspot from June to October 2015. The personal exposure monitoring was performed during three different time periods, i.e., morning (8 a.m.−9 a.m.), afternoon (12.30 p.m.–1.30 p.m.), and evening (4 p.m.–5 p.m.), to cover both the peak and lean hour activities of the CBD. The median PM2.5 concentrations were 38.1, 34.9, and 40.4 µg/m3 during the morning, afternoon, and evening hours on the weekends. During weekdays, the median PM2.5 concentrations were 59.5, 29.6, and 36.6 µg/m3 in the morning, afternoon, and evening hours, respectively. It was observed that the combined effect of traffic emissions, complex land use, and micrometeorological conditions created localized air pollution hotspots. Furthermore, the total PM2.5 lung dose levels for an exposure duration of 1 hr were 8.7 ± 5.7 and 12.3 ± 5.2 µg at CBD during weekends and weekdays, respectively, as compared with 2.5 ± 0.8 µg at the urban background (UB). This study emphasizes the need for mobile measurement for short-term personal exposure assessment complementing the fixed air quality monitoring.
Implications: Personal exposure monitoring at an urban hotspot indicated space and time variation in PM concentrations that is not captured by the fixed air quality monitoring networks. The short-term exposure to higher concentrations can have a significant impact on health that need to be considered for the health risk–based air quality management. The study emphasizes the need of hotspot-based monitoring complementing the already existing fixed air quality monitoring in urban areas. The personal exposure patterns at hotspots can provide additional insight into sustainable urban planning.
Introduction
The air quality in Asian cities (particularly that of India and China) is a subject that has fueled intense debate in recent times. According to the recent LANSET report, 50% of global deaths attributed to ambient air pollution in 2015 occurred in India and China (Landrigan et al. Citation2017). The erratic and mostly unplanned development in these cities have led to the spatial variation in emission intensity (Dodman Citation2009; Guest and Brown Citation2005). These urban centers also have land use policies that isolate pockets of commercial and industrial activities (Adams and Kanaroglou Citation2016). The spatial limitation, coupled with the increase in human migration towards urban areas, has resulted in the mushrooming of human settlements in and around the central business districts (CBDs). The change in land use, city layout, vehicle density (especially heavy-duty vehicles), fleet age, fuel quality, and micrometeorological conditions have resulted in local space and time events of air pollutants at CBDs (Johnson et al. Citation2010; Tang, Blangiardo, and Gulliver Citation2013). Furthermore, the emitted pollutants become trapped or recirculate in these areas due to the street canyon (urban streets flanked by tall buildings) effect. As a result, the localized air pollution hotspots are created where the pollutant concentrations are several times higher than what is generally observed in some of the other locations. The residents, vendors, and children living in adjacent areas are constantly exposed to such higher pollutant concentrations and may receive a substantial contribution to their daily total exposure in a short period of time.
The air quality monitoring in cities is generally an expensive affair. Consequently, very few monitoring stations are set up in urban areas, which may not provide an accurate picture of the air quality in the city. In India, the Central Pollution Control Board (CPCB), in association with the State Pollution Control Boards (SPCBs), are conducting periodic air quality monitoring at selected locations (fixed station) in urban areas across the country under National Air Quality Monitoring Program (NAMP). Fixed stations, by and large, have severe limitations. First of all, they do not reflect both the spatial variability and severity of the pollution levels at hotspots. The pollutants—mainly particulate matter (PM)—show high spatial variability, which may be attributed to the heterogeneity in traffic characteristics, street characteristics, terrain, and micrometeorology (Hankey and Marshall Citation2015; Kaur, Nieuwenhuijsen, and Colvile Citation2007; Targino et al. Citation2016). The air quality measured at fixed stations are a representative of the local area, i.e., about a radius of 1 km (Chan, Chang-Chuan, and Hwang, Jing-Shiang Citation1996). Thus, the data from fixed stations are not a true reflection of the personal exposure to short-term air pollution events in urban hotspots.
Mobile monitoring is cost-effective and can be used to complement the existing (fixed-station) expensive monitoring systems to understand the spatial and temporal variability of the air pollutants. It offers the flexibility in monitoring pathways where the route can be customized so as to include the particular areas of concern, such as high-traffic roads or the specific sources of interest. The applicability of mobile data can be improved by the repeated measures, integrating meteorology and land use characteristics and improving the spatial and temporal characteristics of a fixed-site monitoring network (Tunno et al. Citation2012). Many studies have used different mobile platforms (van, car, bicycle) for the personal exposure studies (Elen et al. Citation2013; Hagler, Thoma, and Baldauf Citation2010; Kaur, Nieuwenhuijsen, and Colvile Citation2007; Krecl et al. Citation2014; Wallace et al. Citation2009). On the other hand, limited studies have focused on personal exposure while walking. In developing countries such as India, walking is the most preferred mode of travel in CBD and individuals are exposed to increased levels of PM.
In the present study, an attempt has been made to understand the spatial and temporal variability of air pollutants, particularly fine PM and its contribution to the personal exposure at a CBD in Chennai, a city that experiences hot and humid (tropical) climatic conditions.
Methodology
Description of the study area
Chennai is one of the oldest and the fourth largest agglomerations in India, with a population of about 8.6 million (2011 census). The growth in population and unplanned urbanization are making the city vulnerable to air quality–related issues. As a result, the personal exposure of a city resident is expected to be high. Based on the air quality data obtained from CPCB and hotspot analysis, T Nagar (central business district [CBD]), a bustling commercial area in Chennai, was found to be an air pollution hotspot and was selected for the present study (Tamil Nadu Pollution Control Board [TNPCB] 2014). presents the details of the study area and monitoring paths. T Nagar is one of the busiest business and commercial district in the city, characterized by dense, high-rise buildings along the streets, high roadside pedestrian usage, and heavy-traffic conditions. The land use information of the study area was obtained from the Google Earth. The boundary of the study area (2 × 2 km) was digitized and converted from ArcGIS shape file format (.shp) to Google Earth–compatible format (.kml). The image was georeferenced and digitalized to represent the various land uses of study area (barren land, major roads, settlement, and vegetation). The land use map layout was then created. The land use pattern of 2 × 2 km area around the monitoring location indicates that the area is dominated by built-up area (83%) and about 10% vegetation (). A population density of 30,970 persons/km2 (2011 census) shows the CBD’s burgeoning population. The exponential increase in vehicle population, especially in the last decade, has resulted in the increased usage of personalized vehicles in the CBD. The average traffic density at CBD was 1600 vehicles per hour, with 75% two-wheelers, 16% light commercial vehicles, 6% three-wheelers, and 3% heavy commercial vehicles. During peak hours, the vehicle density on the road can go up to 4000 vehicles/hr. As the vehicle fleet is dominated by two-wheelers and most of the two-wheelers run on petrol, the petrol-driven vehicles constitute a major portion as compared with diesel-powered vehicles (95% petrol, 5% diesel). Other sources of air pollution in this area include resuspension of road dust, construction activities, and biomass burning. Around 850 permanent street vendors are found on its pavements, which have been utilized for informal shopping activities. The urban background (UB) site selected for the present study is a lush green academic campus (Indian Institute of Technology [IIT] Madras).
Figure 1. Map of the study area showing the monitoring locations (CBD and UB), monitoring route, and the weather station.
Figure 2. Land use pattern at CBD.
Air quality and health data
Even though the health impacts of fine particles are well documented, the monitoring of PM2.5 (PM with an aerodynamic diameter <2.5 μm) is still limited in Indian cities. The Tamil Nadu Pollution Control Board (TNPCB) is monitoring PM10 under the NAMP—for a duration of 24 hr (8-hr average sampling) twice a week, with 104 observations in a year. The PM10 samples were collected on filter papers using a high-volume sampler (Envirotech APM460 BL; Envirotech pvt instruments Ltd.; New Delhi, India Grimm model 1.109; Grimm Aerosol Technik, Ainring, Germany GPS logger software version 91; Surrey, UK ESRI ArcGIS, version 9.3; California, US) operating at a flow rate of 16.67 L/min (or 1 m3/hr). The filter papers were then weighed to determine the concentration levels. The respirable suspended particulate matter (RSPM; i.e., PM10) concentrations monitored at T Nagar (CBD) for a 4-yr period, i.e., 2012–2015, were collected and analyzed.
In order to comprehend the potential association between air quality and hospital visits, monthly visits to a major government hospital located in the study area for the same period (2012–2015) were also collected. As per the guidelines of the International Classification of Diseases (ICD-10), the unscheduled hospital visits (outpatient [OP] visits) for respiratory cases were categorized. The cause-specific (respiratory) OP visits recorded in the hospital registers were collected manually by segregating the data from hospital registers. The total monthly respiratory OP visit counts were then correlated with the average monthly PM10 concentrations measured at the fixed station.
Monitoring protocol for personal PM exposure measurements
Size-segregated PM concentrations were monitored during June to October 2015 (12 monitoring sessions) using optical spectrophotometer (Grimm model 1.109; xx, xx). The instrument works on the light scattering principle, and a laser diode is used as the light source. The size of the particles is proportional to the scattered light intensity. The air is sampled at a rate of 1.2 L/min using a volume-controlled pump. The particles pass through 32 channels from 0.265 to 34 μm, and the scattered light signal is collected on a mirror and led onto the detector, which is at 90° to the incident laser light. The particles are then collected on a 47-mm polytetrafluoroethylene (PTFE) filter. The detection limit of the instrument is 100 ± 3 mg/m3, sensitivity is 1 μg/m3, and instrument reproducibility is ±2%. A self-test and zero calibration check were performed at the beginning of each measurement. The data were collected at every 6 sec. Global Positioning System (GPS) data (GPS Logger software; xx, xx) with a time resolution of 2 sec was retrieved and plotted on a map so as to track the monitoring pathway during the campaign. Both GPS and instrument time were synchronized before every monitoring campaign. The instrument was carried in a backpack, and sampling port was positioned at breathing level (approximately 1.5 m from the ground level) as reported in previous studies (Kaur, Nieuwenhuijsen, and Colvile Citation2005; Richardson et al. Citation2013; Sloan et al. Citation2016). The monitoring by walking was carried out for about 50 min in each of these areas during three different time periods, i.e., morning (8 a.m.–9 a.m.), afternoon (12.30 p.m.–1.30 p.m.), and evening (4 p.m.–5 p.m.), to get the exposure concentrations at peak time periods. The personal exposure measurements were carried out for 4 days (7 June 2015, 14 June 2015, 25 June 2015, 26 October 2015) in CBD and four days in urban background site (5 September 2015, 6 September 2015, 8 September 2015, 9 September 2015). The monitoring path was selected in such a way that they cover a traffic-dominated area, a commercial area, a residential area, and the nearest fixed monitoring station. The monitoring path was further divided into three stretches for a better understanding of exposure at different land use characteristics, i.e., traffic-dominated (T), residential (R), and commercial activity (C)-dominated areas (). The T stretch (900 m long) constitutes a major road (South Usman Road), which is flanked by buildings on both sides. With shops located on either side, the area is bustling with a predominantly floating population. A flyover also passes through this stretch, and small shops have mushroomed under the flyover. A school is also located along this busy stretch. The R stretch (520 m) contains residential complexes on both sides and even has some vegetation. The C stretch (700 m) is a narrow road with commercial activities going on both sides that is frequently used by two-wheelers and three-wheelers along with pedestrians.
Figure 3. Description of the monitoring route (T, R, C) characteristics. Also indicated are the location of the flyover bridge, school, as well as the traffic intersections.
Exposure assessment
The mobile PM measurements made at CBD and the particle airway dosimetry analysis were used for exposure assessment. The Multiple Particle Path Dosimetry (MPPD) model, jointly developed by Chemical Industry Institute of Toxicology (CIIT; USA) and the Dutch National Institute for Public Health and the Environment (RIVM; The Netherlands), was used to study the airway particle dosimetry. The deposition fraction of inhaled particles (PM2.5) was estimated in each region of the respiratory tract (head [H], tracheobronchial [TB], and pulmonary [P]) using the MPPD model. The human stochastic lung (60th percentile) structure was considered in the present study (Manigrasso et al. Citation2015). The exposure scenario for an adult man under light exercise conditions was considered (functional reserve capacity [FRC] of 3300 mL, upper respiratory tract [URT] volume of 50 mL at a fixed tidal volume of 800 mL, inspiratory fraction of 0.5, and respiration frequency of 16 breaths/min; Hinds Citation2012). A single particle with a particle density of 1 g/cm3, geometric standard deviation (GSD) of 1.7 (for poly-disperse particles) with inhalability adjustment, and mass median diameter (MMD) were the selected particle properties. In the absence of site-specific PM data, the particle density is assumed to be 1 g/cm3 (Hussein et al. Citation2015; Sánchez-Soberón et al. Citation2015). The MMD used for the model simulation was calculated separately for each particle fraction from the measured PM data (Figure S1). Based on the literature, the GSD value of 1.7 was selected to represent the characteristics of poly-disperse particles (poly-disperse particles have a GSD greater than 1.05) (Horvath, Gunter, and Wilkison Citation1990; Venkataraman and Kao Citation1999). The particle dose in various part of respiratory tract was estimated using eq 1.
where DF is the deposition fraction, TV is the tidal volume, f is the frequency of breathing, and t is the duration of exposure, which is considered to be 60 min.
Quality control and assurance
To ensure data quality assurance and quality control, the instruments were calibrated using the methods given in manufacturers’ manuals. Background and flow checks were performed prior to conducting each monitoring campaign. The PTFE filters used for collecting particles in the instrument were replaced at regular intervals to avoid filter overloading. The protocols recommended by the manufacturer were followed in operating the instrument. The GPS-logged time was cross-checked with the field/instrument logs to confirm a time and location of each mobile monitoring. The data integrity was ensured by checking outlying data with field/instrument logs.
Data processing and analysis
The SPSS software package (IBM SPSS Statistics, version 22; IBM, Armonk, NY, USA) was used for the statistical analysis of the air quality data. The ArcGIS software (ESRI ArcGIS, version 9.3; xx, xx) was used to get the spatial variation of the PM concentrations at the hotspot. Postprocessing of the data was carried out to remove extreme values, and the data were converted to a format that is compatible with ArcGIS 9.3 software. Each x-y coordinate location with associated pollutant concentration was mapped as point locations. The data were then aggregated.
Meteorological data
Temperature, humidity, wind speed (m/sec), and wind direction data monitored at nearby weather monitoring station were collected for the study period (www.wunderground.com). The Web site provides real-time weather information that comes from the National Weather Service (NWS) and over 250,000 personal weather stations (PWS). For Chennai, the weather information was collected from the weather station located at the Annadurai International airport in Chennai City. This weather station is a quality-controlled station operated by the Indian Meteorological Department (IMD), which carries out regular checks and calibration of the instruments.
Results and discussion
Air quality at CBD and respiratory hospital visits
The air quality data of 2012–2015 collected from the ongoing NAMP were analyzed (). The monthly average PM10 concentration in the CBD varied from 62 to 189 µg/m3 with mean values of 90.9 ± 29.8, 101.8 ± 15.6, 119.8 ± 31.6, and 127.8 ± 29.6 µg/m3 for the years 2015, 2014, 2013, and 2012, respectively. The PM concentrations at CBD were above the PM10 National Ambient Air Quality Standards (NAAQS = 100 µg/m3) for most of the time. The vehicle exhaust emissions and the resuspension of dust due to the frequent movement of people and vehicles were considered to be the major contributor of PM levels at CBD. The PM concentrations increased during the winter months as well as during June to August, because this period is considered to be as shopper’s time in Chennai. The number of people visiting CBD is close to 0.2 million per day during peak time (Shankar Citation2015). A gradual decrease in the PM10 concentration at CBD over the years was observed. This might be due to the efforts of the state government in tackling traffic congestion and improving air quality at CBD. The Chennai Corporation has also relocated the street hawkers to a new complex to reduce street congestion. In addition, the traffic and parking management policies may have played a role in improving the air quality at CBD.
Figure 4. Monthly average fixed-site PM10 concentrations at CBD during 2012–2015.
The correlation between PM concentrations and respiratory hospital visits during 2012–2015 was analyzed. Results showed a statistically significant positive correlation of 0.41 at 0.01 level (r = 0.41, N = 48, and P = 0.0039). In the past epidemiological studies, the daily hospital admissions were correlated with daily PM concentrations to understand the association between air pollution and health effects (Lin et al. Citation2003; Schwartz and Dockery Citation1992). On a smaller time scale, the influences of air pollution and meteorology were clearly established in the past studies (Jhun et al. Citation2015; Yamazaki et al. Citation2015). Even though the hospital visits may also depend on several other factors, viz., day of week, holidays, or epidemic outbreak, such analysis could not be carried out in the present study due to the lack of daily health data. A statistical summary of air quality and hospital data is given in Table S1.
Personal PM exposure concentrations
Characteristics of PM concentrations at CBD
The PM concentrations were found to vary both spatially and temporally at CBD. presents the temporal variations in PM2.5 concentrations during weekends and weekdays at CBD. The higher PM2.5 concentrations during the morning and evening hours as compared with afternoon hours were contributed by the peak hour traffic. Earlier studies have also reported the elevated PM concentrations at street canyons due to traffic emissions(Krecl et al. Citation2017; Wehner et al. Citation2002). Further, the traffic-related PM emissions are generally high in Indian cities due to the heterogeneous traffic, poor vehicle maintenance, the larger proportion of older vehicles, inadequate road infrastructure, and low fuel quality (Gurjar, Molina, and Ojha Citation2010). It was also reported that the heavy motor vehicles (HMVs) contribute significantly to the total PM emissions due to the higher PM emission factors (Menon and Nagendra Citation2017).
Figure 5. Personal exposure concentrations of PM2.5 during weekends and weekdays at CBD.
During weekdays, the median PM2.5 concentrations were 59.5, 29.6, and 36.6 µg/m3 in morning, afternoon, and evening, respectively. The morning concentrations were higher due to the peak traffic emissions as well as the meteorological conditions. The atmospheric inversion conditions that exist in the morning can result in higher concentrations in the morning as compared with the evening. In tropical areas such as Chennai, the stable boundary layer exists up to 8–9 a.m., with low mixing height in the morning hours as compared with the afternoon and evening hours(Mehta et al. Citation2016). This results in high PM2.5 concentrations in the morning, although the traffic count was higher in the evening hours as compared with morning hours. It was also observed that the wind speed was relatively low in the morning hours, which further prevented the dispersion of air pollutants.
The median PM2.5 concentrations were 38.1, 34.9, and 40.4 µg/m3 during the morning, afternoon, and evening periods on the weekends. As the commercial area becomes more active towards evening, the movement of people and vehicles result in resuspension of road dust, which further results in higher PM concentration levels. Earlier studies also indicated that the road dust and street sweeping contribute about 25% to the total PM emissions in Indian cities (Lomborg Citation2009). The contribution of vehicular exhaust to the ambient PM was more on weekdays, indicated by the higher PM2.5/PM10 ratio (0.51) as compared with that of the weekends (0.4). At urban background (UB), the PM2.5 concentrations vary between 7.38 and 27.5 µg/m3, which were much lower as compared with CBD. The PM values during morning, afternoon, and evening hours at CBD and UB were 62.6, 53.35, and 54.58 µg/m3 and 16.5, 14.4, and 12.8 µg/m3, respectively. provides the descriptive statistics of PM2.5 concentrations during weekdays and weekends. The statistical analysis of PM concentrations and meteorological parameters at CBD and UB were given in Table S2.
Table 1. Statistical summary of the weekday and weekend PM2.5 concentrations measured at CBD.
presents the previous studies on personal exposure to PM (ultrafine particles [UFP], PM2.5, PM10) using mobile platforms. Most of these studies were pertaining to European (Mol, Amsterdam, London), American (New Jersey, Los Angeles, New York, Londrina, Bogota), and some Asian (Xian) cities. In most of these studies, the personal exposure assessments (while traveling in bicycle/car) were focused on exposure to roadside emissions resulting from homogenous traffic conditions and land use pattern. In case of cities in developing countries, traffic is heterogeneous in nature and land use is mixed type (combination of traffic, commercial, residential, industry); hence, the emission and exposure patterns vary significantly. Also, walking is the most common travel mode in the CBD of developing countries. In the present study, we examined the personal exposure at CBD having heterogeneous traffic and mixed land use pattern (commercial, traffic, and residential). The results of the present study were comparable to other highly populated cities such as Xian, China. However, the variability in PM values was higher in the present study, which may be attributed to the heterogeneous traffic, mixed land use characteristics, and tropical climatic conditions.
Table 2. PM exposure studies for different exposure modes in an urban environment compared with the present study.
Effect of meteorology
The ambient PM levels were reported to be closely associated with the meteorology (Wehner and Wiedensohler Citation2003). In the present study, the PM concentrations were correlated with the meteorological parameters (temperature, wind speed, and relative humidity) prevailing during the monitoring period. The temperature (r = −0.33) and relative humidity (r = 0.27) were found to have a role in determining PM concentrations. An inverse relationship between temperature and the PM concentration was also reported in the previous studies (Hussein et al. Citation2004). The wind pattern changes due to the street canyon effect, which needs to be studied further (Kumar, Fennell, and Britter Citation2008; Murena, Garofalo, and Favale Citation2008; Zwack et al. Citation2011b). In the present study, elevated PM2.5 concentrations were observed in the CBD during the weekday morning hours due to the atmospheric inversion conditions. The mixing height was observed to vary diurnally, with comparatively low mixing height in the night and morning(Mehta et al. Citation2016). It was also reported that the reason for the occurrence of high pollution potential was due to low mixing height (less than 500 m) and mean wind speed less than 4 m/sec during the morning hours (Gross Citation1970; Iyer and Raj Citation2013). Thus, morning hours with high traffic flow and less wind speed can result into poor air quality. The regular cleaning of the pavement/road, as well as installation of mechanical dust collector, can improve the air quality at CBD. The recent studies at this CBD also established a linkage between temperature and wind speed with urban heat island (UHI) effect (Swamy, Shiva Nagendra, and Schlink Citation2017). These features may be further explored for personal exposure studies at CBD.
Spatial and temporal variation of PM concentrations
The monitoring pathway within the CBD was further divided into different stretches based on activity to elucidate the factors contributing to elevated pollutant concentrations. The PM2.5 concentrations at T stretch (traffic) varied between 40.6 and 51.7 µg/m3 with a median concentration of 44.1 µg/m3. The maximum concentration of 51.7 µg/m3 occurred during weekdays, corresponding to morning peak hour traffic. Further, the tall buildings on either side of the road, as well as the flyover at study stretch, resulted in the poor dispersion of air pollutants. The minimum concentration of 40.6 µg/m3 was found during weekend afternoons because of lean traffic flow on roads and better dispersion conditions. The PM2.5 concentrations at R stretch (residential) varied between 24.25 and 54.2 µg/m3 with a median concentration of 32.2 µg/m3. The higher concentrations at this stretch were observed during the weekday morning. During weekends, the PM concentrations were much less, i.e., 24.2–35.8 µg/m3, due to reduced traffic flow and human activities. The maximum concentration of 54.2 µg/m3 was observed during sweeping of the road. The vegetation cover at this area is also playing a role in reducing the PM concentration to an extent as compared with C and T stretches.
The PM2.5 concentrations at C stretch (commercial) varied between 35.4 and 60.5 µg/m3 with a median concentration of 40.8 µg/m3. The highest concentration was observed during weekend afternoons and evenings due to increased commercial activity (shopping) during that period. Even on weekdays, this particular stretch is critical for air pollution levels, as narrow stretch flanked by tall buildings on either side prevent air pollution dispersion. The plying of two-wheelers and three-wheelers (auto rickshaws) were also observed to be prominent in this area. The narrow streets and intense human activities have resulted in a stop-and-go of vehicles, which caused a significant increase in vehicular emissions. The frequent stop-and-go traffic was reported to increase the PM2.5 concentration by about 10% in an urban street canyon (Zwack et al. Citation2011b). During weekends, this stretch further gets crowded with people and obstruct free movement. The PM concentrations were also observed to be very high during these periods.
A dust map was created to understand the spatial variability of PM concentration along the monitoring pathway during the weekends and weekdays ( and ). The data were aggregated for each 1 min, and the median value was represented in these figures (Krecl et al. Citation2014; Targino et al. Citation2016). The hotspots were marked as 1, 2, and 3 in and . The potential hotspots were identified as the commercial centre with construction activities (1), traffic intersection (2), and below the flyover (3). A school is also located near the flyover, and elevated concentration in this area can have serious implication on the health of school children. The space under the flyover is occupied by many street vendors. The traffic diversions, especially in the morning, improving the green cover inside the school compound as well as the relocation of street hawkers, etc., might further improve the air quality at CBD. The PM time series for weekends and weekdays are shown in and , respectively.
Figure 6. Spatial map of aggregated median PM2.5 concentrations during weekends. The potential hotspots identified are marked (1, construction activity; 2, traffic intersection; 3, below the flyover).
Figure 7. Spatial map of aggregated median PM2.5 concentrations during weekdays. The potential hotspots identified are marked (1, construction activity; 2, traffic intersection; 3, below the flyover).
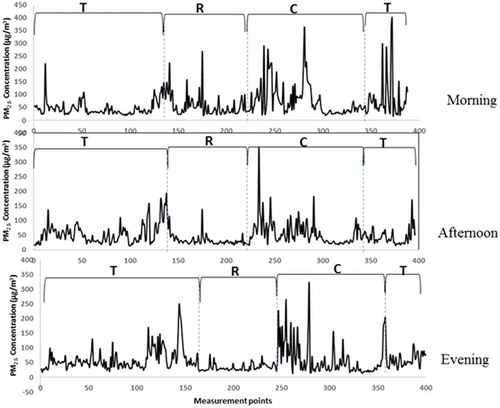
Figure 8. Time-series plots of PM2.5 concentrations on weekends.
Figure 9. Time-series plots of PM2.5 concentrations on weekdays.
Exposure assessment
In the CBD, the groups vulnerable to the PM exposure are the people who visit the CBD for shopping purposes, the street vendors and shopkeepers, and the local residents. Depending on the exposure duration, it can result in an acute short-term to long-term health effects. The particle dosimetry studies provide insight into the particles that get deposited in the various regions of the lungs. The deposition fraction was simulated using MPPD model, which was further used to estimate the particle dose. The results indicated significant particle deposition at CBD as compared with UB. The total PM2.5 doses (in µg) for exposure duration of 1 hr during weekends and weekdays were 8.7 ± 5.7 and 12.3 ± 5.2 µg, respectively, at CBD. At UB the PM2.5 dose was 2.5 ± 0.8 µg. The results indicated significant particle dosage to the lungs even for shorter exposure duration. The vehicle exhaust consists of particles of the smaller size range, which can penetrate deep into the lungs (Menon and Nagendra Citation2017). The PM2.5 deposition was higher (15.3 ± 8.7 µg) during the weekday morning, which indicated the contribution of traffic to the particle dosage. also indicates significant deposition of PM at the pulmonary region. The diesel particles were found to affect the various cellular processes involved in lung and cardiovascular diseases (Longhin et al. Citation2016). The statistically significant positive correlation between the respiratory hospital visits and ambient PM10 at CBD also supports these findings.
Figure 10. PM2.5 dose for various regions of lungs (head [H], tracheobronchial [TB], and pulmonary [P]) at CBD and UB.
![Figure 10. PM2.5 dose for various regions of lungs (head [H], tracheobronchial [TB], and pulmonary [P]) at CBD and UB.](/cms/asset/0718259f-2d9c-414a-9b8a-663cd4ba7c1f/uawm_a_1407837_f0010_b.gif)
Even though there are overwhelming evidence linking PM2.5 exposure to health effects, still the studies based on the actual dose delivered to the respiratory system are limited. A recent study has indicated that repeated exposures to low level of fine PM (<6 µg/cm2) can even induce epigenetic changes (Zhou et al. Citation2017, Citation2016). The acute and repeated low-level exposures can result in DNA damage, apoptosis, autophagy, etc.(Zhou et al. Citation2017). At CBD, the deposited doses were 4–5 times higher than those at the UB. The particle deposition rate was reported to be higher in children and the elderly as compared with adults for the same PM exposure. In addition, the chemical composition of the deposited PM also matters in inducing specific health effects. The heterogeneous traffic-emitted PM was reported to contain elements such as Ca, Fe, Zn, Ba, Be, Ca, Cd, Co, Cr, Cu, Mn, Ni, Pb, etc. (Srimuruganandam and Shiva Nagendra Citation2011). The metals such as Ca, Br, Pb, Cd, Fe, etc., were predominantly found in the finer PM fraction and can be deposited deep in the lungs(Zwozdziak et al. Citation2017).
Fixed-site and mobile measurements
In developed countries, most of the PM monitoring is still focused on PM10, with limited PM2.5 measurements. At CBD, the manual sampling of PM10 is being carried out twice a week. Therefore, the temporal variations could not be obtained from the manual sampling. The average PM10 concentrations obtained using mobile measurements were in the range of 93–227 µg/m3; on the other hand, the average PM10 concentrations from the fixed monitoring sites were in the range of 71–122 µg/m3. The previous studies also reported that fixed-site monitors significantly underestimate the actual PM exposure(Adams et al. Citation2001; Cortese and Spengler Citation1976; Gulliver and Briggs Citation2004; Oglesby et al. Citation2000) . The PM2.5/PM10 ratio obtained from the present study indicated that PM2.5 constitutes about 50% of PM10 at CBD. In the past, fixed-station air quality data were used in most of the epidemiological studies to relate air pollution and health risk (Lin et al. Citation2003). These types of studies can result in an error called Berkson error, which reduces the estimation power of health risks. The use of personal exposure measurements along with the fixed-site monitoring air quality data can reduce the Berkson error (Deffner Citation2016; Sheppard et al. Citation2012).The personal exposure measurements can thus complement the fixed-site measurements (Strand, Vedal, Rodes, Dutton, Gelfand, and Rabinovitch 2006).
Conclusion
The urban air pollutant patterns are complex in the tropical humid environment because of increase in heat gain by the air mass during the day time. In the present study, human exposure patterns for PM2.5 at urban hotspots (CBD in Chennai City) were characterized. At CBD, high PM2.5 concentrations were observed due to traffic emissions, resuspension of road dust, local activities, and atmospheric dispersion conditions. It was observed that the PM2.5 concentrations at CBD were 79% higher than those at the UB. The short-term exposures to higher levels of PM concentrations can lead to acute and chronic health impacts. The particle dosimetry studies indicated significant particle deposition in the lungs at CBD as compared with UB. This study emphasizes the need for hotspot-based monitoring for short-term personal exposure assessment. Furthermore, the design and implementation of location-specific policy can improve the overall air quality at the CBD.
SUPPLEMENTARY_FILE.docx
Download MS Word (410.3 KB)Acknowledgment
The authors would like to thank the Central Pollution Control Board (CPCB), New Delhi, Tamil Nadu Pollution Control Board (TNPCB), Chennai, and Indo-German Centre for Sustainability (IGCS) for their support and cooperation to carry out this study.
Supplemental material
Supplemental data for this paper can be accessed on the publisher’s website.
Additional information
Funding
Notes on contributors
Jyothi S. Menon
Jyothi S. Menon is a research scholar in the Department of Civil Engineering at Indian Institute of Technology Madras, Chennai, India.
S.M. Shiva Nagendra
S.M. Shiva Nagendra is an associate professor in the Department of Civil Engineering at Indian Institute of Technology Madras, Chennai, India.
Related Research Data
References
- Adams, H.S., M.J. Nieuwenhuijsen, R.N. Colvile, M.A.S. McMullen, and P. Khandelwal. 2001. Fine particle (PM2.5) personal exposure levels in transport microenvironments, London, UK. Science of the Total Environment 279 (1–3):29–44. doi:10.1016/S0048-9697(01)00723-9.
- Adams, M.D., and P.S. Kanaroglou. 2016. Mapping real-time air pollution health risk for environmental management: Combining mobile and stationary air pollution monitoring with neural network models. Journal of Environmental Management 168:133–41. doi:10.1016/j.jenvman.2015.12.012.
- Berghmans, P., N. Bleux, L. Int Panis, V.K. Mishra, R. Torfs, and M. Van Poppel. 2009. Exposure assessment of a cyclist to PM10 and ultrafine particles. Science of the Total Environment 407 (4):1286–98. doi:10.1016/j.scitotenv.2008.10.041.
- Chan, C.-C., and J.-S. Hwang. 1996. “Site representativeness of urban air monitoring stations.” Journal of the Air & Waste Management Association 46 (8):755–760. doi:10.1080/10473289.1996.10467510.
- Cortese, A. D., and J.D. Spengler. 1976. Ability of fixed monitoring stations to represent personal carbon monoxide exposure. Journal of the Air Pollution Control Association 26 (12):1144–50. doi:10.1080/00022470.1976.10470372.
- Deffner, V. 2016. Exposure modeling and exposure measurement error correction in health outcome models with longitudinal data structure. Doctoral dissertation, PhD in Faculty of Mathematics, Computer Science and Statistics, Ludwig Maximilian University (LMU), Munich.
- Dodman, D. 2009. Urban density and climate change. In Analytical review of the interaction between urban growth trends and environmental changes, ed. xxx, xx–xx. New York: United Nations Population Fund (UNFPA), Paper 1, April 2nd, Available at https://www.uncclearn.org/sites/default/files/inventory/unfpa14.pdf.
- Elen, B., J. Peters, M. Van Poppel, N. Bleux, J. Theunis, M. Reggente, and A. Standaert. 2013. The Aeroflex: A bicycle for mobile air quality measurements. Sensors 13 (1):221–40. doi:10.3390/s130100221.
- Franco, J.F., J.F. Segura, and I. Mura. 2016. Air pollution alongside bike-paths in Bogotá-Colombia. Frontiers in Environmental Science 4:77. doi:10.3389/fenvs.2016.00077.
- Gross, E. 1970. The National Air Pollution Potential Forecast Program. No. WBTM-NMC-47. Washington, DC: National Meteorological Center. Accessed April 17, 2018. http://www.dtic.mil/dtic/tr/fulltext/u2/714568.pdf.
- Guest, A., and S. Brown. 2005. Population distribution and suburbanization. In Handbook of population. Handbooks of sociology and social research, ed. D. L. Poston, 59–86. Boston, MA: Springer. doi:10.1007/0-387-23106-4_3.
- Gulliver, J., and D.J. Briggs. 2004. Personal exposure to particulate air pollution in transport microenvironments. Atmospheric Environment 38 (1):1–8. doi:10.1016/j.atmosenv.2003.09.036.
- Gurjar, B.R., L.T. Molina, and C.S.P. Ojha. 2010. Air pollution: Health and environmental impacts. Boca Raton, FL: CRC press.
- Hagler, G.S.W., E.D. Thoma, and R.W. Baldauf. 2010. High-resolution mobile monitoring of carbon monoxide and ultrafine particle concentrations in a near-road environment. Journal of the Air & Waste Management Association 60 (3):328–36. doi:10.3155/1047-3289.60.3.328.
- Hankey, S., and J.D. Marshall. 2015. On-bicycle exposure to particulate air pollution: Particle number, black carbon, PM2.5 and particle size. Atmospheric Environment 122:65–73. doi:10.1016/j.atmosenv.2015.09.025.
- Hinds, W.C. 2012. Aerosol technology: Properties, behavior, and measurement of airborne particles. New York: John Wiley\& Sons.
- Horvath, H., R.L. Gunter, and S.W. Wilkison. 1990. Determination of the coarse mode of the atmospheric aerosol using data from a forward-scattering spectrometer probe. Aerosol Science and Technology 12 (4):964–80. doi:10.1080/02786829008959407.
- Hussein, T., A. Puustinen, P.P. Aalto, J.M. Mäkelä, K. Hämeri, and M. Kulmala. 2004. Urban aerosol number size distributions. Atmospheric Chemistry and Physics 4 (2):391–411. doi:10.5194/acp-4-391-2004.
- Hussein, T., A. Wierzbicka, J. Londahl, M. Lazaridis, and O. Hanninen. 2015. Indoor aerosol modeling for assessment of exposure and respiratory tract deposited dose. Atmospheric Environment 106:402–11. doi:10.1016/j.atmosenv.2014.07.034.
- Int Panis, L., B. De Geus, G. Vandenbulcke, H. Willems, B. Degraeuwe, N. Bleux, V. Mishra, I. Thomas, and R. Meeusen. 2010. Exposure to particulate matter in traffic: A comparison of cyclists and car passengers. Atmospheric Environment 44 (19):2263–70. doi:10.1016/j.atmosenv.2010.04.028.
- Iyer, U.S., and P. Ernest Raj. 2013. Ventilation coefficient trends in the recent decades over four major Indian metropolitan cities. Journal of Earth System Science 122 (2):537–49. doi:10.1007/s12040-013-0270-6.
- Jhun, I., B.A. Coull, J. Schwartz, B. Hubbell, and P. Koutrakis. 2015. The impact of weather changes on air quality and health in the United States in 1994–2012. Environmental Research Letters 10 (8):84009. doi:10.1088/1748-9326/10/8/084009.
- Johnson, M. V., J.S. Isakov, T.S. Mukerjee, and H. Özkaynak. 2010. Evaluation of land-use regression models used to predict air quality concentrations in an Urban area. Atmospheric Environment 44 (30):3660–68. doi:10.1016/j.atmosenv.2010.06.041.
- Kaur, S., M.J. Nieuwenhuijsen, and R.N. Colvile. 2005. Pedestrian exposure to air pollution along a major road in Central London, UK. Atmospheric Environment 39 (38):7307–20. doi:10.1016/j.atmosenv.2005.09.008.
- Kaur, S., M.J. Nieuwenhuijsen, and R.N. Colvile. 2007. Fine particulate matter and carbon monoxide exposure concentrations in urban street transport microenvironments. Atmospheric Environment 41 (23):4781–810. doi:10.1016/j.atmosenv.2007.02.002.
- Krecl, P., C. Johansson, J. Ström, B. Lövenheim, and J. C. Gallet. 2014. A feasibility study of mapping light-absorbing carbon using a taxi fleet as a mobile platform. Tellus, Series B: Chemical and Physical Meteorology 66:1. doi:10.3402/tellusb.v66.23533.
- Krecl, P., C. Johansson, A.C. Targino, J. Strom, and L. Burman. 2017. Trends in black carbon and size-resolved particle number concentrations and vehicle emission factors under real-World conditions. Atmospheric Environment 165:155–68. doi:10.1016/j.atmosenv.2017.06.036.
- Kumar, P., P. Fennell, and R. Britter. 2008. Effect of wind direction and speed on the dispersion of nucleation and accumulation mode particles in an urban street Canyon. Science of the Total Environment 402 (1):82–94. doi:10.1016/j.scitotenv.2008.04.032.
- Lähde, T., J.V. Niemi, A. Kousa, T. Rönkkö, P. Karjalainen, J. Keskinen, A. Frey, R. Hillamo, and L. Pirjola. 2014. Mobile particle and NOx emission characterization at Helsinki Downtown: Comparison of different traffic flow areas. Aerosol and Air Quality Research 14 (5):1372–82. doi:10.4209/aaqr.2013.10.0311.
- Landrigan, P.J., R. Fuller, N.J.R. Acosta, O. Adeyi, R. Arnold, N. (. Basu, A. Bibi Baldé, et al. 2017. The lancet commission on pollution and health. The Lancet 6736 (17). doi:10.1016/S0140-6736(17)32345-0.
- Lin, C.A., L.A.A. Pereira, G.M. De Souza Conceição, H.S. Kishi, R. Milani, A.L. F. Braga, and P.H.N. Saldiva. 2003. Association between air pollution and ischemic cardiovascular emergency room visits. Environmental Research 92 (1):57–63. doi:10.1016/S0013-9351(02)00054-3.
- Lomborg, B. 2009. Global crises, global solutions: Costs and benefits. Cambridge, UK: Cambridge University Press.
- Longhin, E., M. Gualtieri, L. Capasso, R. Bengalli, S. Mollerup, J.A. Holme, J. Øvrevik, S. Casadei, C. Di Benedetto, P. Parenti, and M. Camatini. 2016. Physico-chemical properties and biological effects of diesel and biomass particles. Environmental Pollution 215:366–75. doi:10.1016/j.envpol.2016.05.015.
- Manigrasso, M., G. Buonanno, L. Stabile, L. Morawska, and P. Avino. 2015. Particle doses in the pulmonary lobes of electronic and conventional cigarette users. Environmental Pollution 202:24–31. doi:10.1016/j.envpol.2015.03.008.
- Mehta, S.K., M.V. Ratnam, S.V. Sunilkumar, D.N. Rao, V. Boddapati, and K. Murthy. 2016. Diurnal variability of the atmospheric boundary layer height over a tropical station in the Indian monsoon region. Atmospheric Chemistry and Physics 17 (1):531–49. doi:10.5194/acp-2016-542.
- Menon, J.S., and S.M. Shiva Nagendra. 2017. Statistical distribution and particle dosimetry models to estimate personal exposure at urban sidewalks of tropical climate. Sustainable Cities and Society. doi:10.1016/j.scs.2017.09.005.
- Murena, F., N. Garofalo, and G. Favale. 2008. Monitoring CO concentration at Leeward and windward sides in a deep street Canyon. Atmospheric Environment 42 (35):8204–10. doi:10.1016/j.atmosenv.2008.07.048.
- Oglesby, L., N. Künzli, M. Röösli, C. Braun-Fahrländer, P. Mathys, W. Stern, M. Jantunen, and A. Kousa. 2000. Validity of ambient levels of fine particles as surrogate for personal exposure to outdoor air pollution—Results of the European EXPOLIS-EAS study (Swiss Center Basel). Journal of the Air & Waste Management Association 50 (7):1251–61. doi:10.1080/10473289.2000.10464156.
- Peters, J., J. Theunis, M. Van Poppel, and P. Berghmans. 2013. Monitoring PM10 and ultrafine particles in urban environments using mobile measurements. Aerosol and Air Quality Research 13 (2):509–22. doi:10.4209/aaqr.2012.06.0152.
- Peters, J., J. Van Den Bossche, M. Reggente, M. Van Poppel, B. De Baets, and J. Theunis. 2014. Cyclist exposure to UFP and BC on urban routes in Antwerp, Belgium. Atmospheric Environment 92:31–43. doi:10.1016/j.atmosenv.2014.03.039.
- Poppel, M.V., J. Peters, and N. Bleux. 2013. Methodology for setup and data processing of mobile air quality measurements to assess the spatial variability of concentrations in urban environments. Environmental Pollution 183:224–33. doi:10.1016/j.envpol.2013.02.020.
- Qiu, Z., J. Song, X. Xu, Y. Luo, R. Zhao, W. Zhou, B. Xiang, and Y. Hao. 2017. Commuter exposure to particulate matter for different transportation modes in Xi’an, China. Atmospheric Pollution Research 8 (5):940–48. doi:10.1016/j.apr.2017.03.005.
- Richardson, K. S., A. Kuenzi, R.J. Douglass, J. Hart, and S. Carver. 2013. Human exposure to particulate matter potentially contaminated with Sin Nombre Virus. EcoHealth 10 (2):159–65. doi:10.1007/s10393-013-0830-x.
- Sánchez-Soberón, F., M. Mari, V. Kumar, J. Rovira, M. Nadal, and M. Schuhmacher. 2015. An approach to assess the particulate matter exposure for the population living around a cement plant: Modelling indoor air and particle deposition in the respiratory tract. Environmental Research 143:10–18. doi:10.1016/j.envres.2015.09.008.
- Schwartz, J., and D.W. Dockery. 1992. Increased mortality in Philadelphia associated with daily air pollution concentrations. American Review of Respiratory Disease 145 (3):600–04. doi:10.1164/ajrccm/145.3.600.
- Shankar, A. 2015. A T’Nagar dream. Accessed June 15, 2017. http://madrasmusings.com/Vol 24 No 22/a-t-nagar-dream!html.
- Sheppard, L., R.T. Burnett, A.A. Szpiro, S.-Y. Kim, M. Jerrett, C.A. Pope Iii, and B. Brunekreef. 2012. Confounding and exposure measurement error in air pollution epidemiology. Air Quality, Atmosphere & Health 5 (2):203–16. doi:10.1007/s11869-011-0140-9.
- Sloan, C.D., T.J. Philipp, R. K. Bradshaw, S. Chronister, W.B. Barber, and J.D. Johnston. 2016. Applications of GPS-tracked personal and fixed-location PM2.5 continuous exposure monitoring. Journal of the Air and Waste Management Association 66 (1):53–65. doi:10.1080/10962247.2015.1108942.
- Srimuruganandam, B., and S.M. Shiva Nagendra. 2011. Characteristics of particulate matter and heterogeneous traffic in the urban area of India. Atmospheric Environment 45 (18):3091–102. doi:10.1016/j.atmosenv.2011.03.014.
- Swamy, G., S.M. Shiva Nagendra, and U. Schlink. 2017. Urban heat island (UHI) influence on secondary pollutant formation in a Tropical humid environment. Journal of the Air & Waste Management Association 67 (10):1080–91. doi:10.1080/10962247.2017.1325417.
- Tamil Nadu Pollution Control Board. 2014. Ambient air quality report 2014. Accessed xxx. http://www.tnpcb.gov.in/pdf/ambient_airquality_rpt-2014.pdf.
- Tang, R., M. Blangiardo, and J. Gulliver. 2013. Using building heights and street configuration to enhance intra-urban PM, NO and NO land use regression models. Environmental Science & Technology 47 (20):11643–50. doi:10.1021/es402156g.
- Targino, A.C., M.D. Gibson, P. Krecl, M.V.C. Rodrigues, M.M. Dos Santos, and M. De Paula Correa. 2016. Hotspots of black carbon and PM2.5 in an urban area and relationships to traffic characteristics. Environmental Pollution 218:475–86. doi:10.1016/j.envpol.2016.07.027.
- Thai, A., I. McKendry, and M. Brauer. 2008. Particulate matter exposure along designated bicycle routes in Vancouver, British Columbia. Science of the Total Environment 405 (1–3):26–35. doi:10.1016/j.scitotenv.2008.06.035.
- Tunno, B.J., K.N. Shields, P. Lioy, N. Chu, J.B. Kadane, B. Parmanto, G. Pramana, J. Zora, C. Davidson, F. Holguin, and J.E. Clougherty. 2012. Understanding intra-neighborhood patterns in PM2.5 and PM10 using mobile monitoring in Braddock, PA. Environmental Health 11 (2009):76. doi:10.1186/1476-069X-11-76.
- Venkataraman, C., and A.S. Kao. 1999. Comparison of particle lung doses from the fine and coarse fractions of urban PM-10 aerosols. Inhalation Toxicology 11 (2):151–69. doi:10.1080/089583799197221.
- Wallace, J., D. Corr, P. Deluca, P. Kanaroglou, and M. Brian. 2009. Mobile monitoring of air pollution in cities: The case of Hamilton, Ontario, Canada. Journal of Environmental Monitoring 11 (5):998–1003. doi:10.1039/b818477a.
- Wehner, B., and A. Wiedensohler. 2003. “Long term measurements of submicrometer urban aerosols: statistical analysis for correlations with meteorological conditions and trace gases.” Atmospheric Chemistry and Physics 3 (3): 867–79. doi:10.5194/acp-3-867-2003.
- Wehner, B., W. Birmili, T. Gnauk, and A. Wiedensohler. 2002. Particle number size distributions in a street Canyon and their transformation into the urban-air background: Measurements and a simple model study. Atmospheric Environment 36 (13):2215–23. doi:10.1016/S1352-2310(02)00174-7.
- Weijers, E.P., A.Y. Khlystov, G.P.A. Kos, and J.W. Erisman. 2004. Variability of particulate matter concentrations along roads and motorways determined by a moving measurement unit. Atmospheric Environment 38 (19):2993–3002. doi:10.1016/j.atmosenv.2004.02.045.
- Westerdahl, D., S. Fruin, T. Sax, P.M. Fine, and C. Sioutas. 2005. Mobile platform measurements of ultrafine particles and associated pollutant concentrations on freeways and residential streets in Los Angeles. Atmospheric Environment 39 (20):3597–610. doi:10.1016/j.atmosenv.2005.02.034.
- Yamazaki, S., M. Shima, Y. Yoda, K. Oka, F. Kurosaka, S. Shimizu, H. Takahashi, Y. Nakatani, J. Nishikawa, K. Fujiwara, Y. Mizumori, A. Mogami, T. Yamada, and N. Yamamoto. 2015. Exposure to air pollution and meteorological factors associated with children’s primary care visits at night due to asthma attack: Case-crossover design for 3-year pooled patients. BMJ Open 5 (4):e005736. doi:10.1136/bmjopen-2014-005736.
- Yu, C.H., Z. Fan, P.J. Lioy, A. Baptista, M. Greenberg, and R.J. Laumbach. 2016. A novel mobile monitoring approach to characterize spatial and temporal variation in traffic-related air pollutants in an urban community. Atmospheric Environment 141:161–73. doi:10.1016/j.atmosenv.2016.06.044.
- Zhou, W., D. Tian, J. He, L. Zhang, X. Tang, L. Zhang, Y. Wang, L. Li, J. Zhao, X. Yuan, and S. Peng. 2017. Exposure scenario: Another important factor determining the toxic effects of PM2.5 and possible mechanisms involved. Environmental Pollution 226:412–25. doi:10.1016/j.envpol.2017.04.010.
- Zhou, W., D. Tian, H. Jun, Y. Wang, L. Zhang, L. Cui, and L. Jia. 2016. Repeated PM2.5 exposure inhibits BEAS-2B cell P53 expression through promoter hypermethylation. Oncotarget 7 (15):20691–703. doi:10.18632/oncotarget.7842.
- Zwack, L.M., C.J. Paciorek, J.D. Spengler, and J.I. Levy. 2011a. Characterizing local traffic contributions to particulate air pollution in street Canyons using mobile monitoring techniques. Atmospheric Environment 45 (15):2507–14. doi:10.1016/j.atmosenv.2011.02.035.
- Zwack, L.M., C.J. Paciorek, J.D. Spengler, and J.I. Levy. 2011b. Modeling spatial patterns of traffic-related air pollutants in complex urban terrain. Environmental Health Perspectives 119 (6):852. doi:10.1289/ehp.1002519.
- Zwozdziak, A., M.I. Gini, L. Samek, W. Rogula-Kozlowska, I. Sowka, and K. Eleftheriadis. 2017. Implications of the aerosol size distribution modal structure of trace and major elements on human exposure, inhaled dose and relevance to the PM2.5 and PM10 metrics in a european pollution hotspot urban area. Journal of Aerosol Science 103:38–52. doi:10.1016/j.jaerosci.2016.10.004.