
ABSTRACT
For many national parks and wilderness areas with special air quality protections (Class I areas) in the western United States (U.S.), wildfire smoke and dust events can have a large impact on visibility. The U.S. Environmental Protection Agency’s (EPA) 1999 Regional Haze Rule used the 20% haziest days to track visibility changes over time even if they are dominated by smoke or dust. Visibility on the 20% haziest days has remained constant or degraded over the last 16 yr at some Class I areas despite widespread emission reductions from anthropogenic sources. To better track visibility changes specifically associated with anthropogenic pollution sources rather than natural sources, the EPA has revised the Regional Haze Rule to track visibility on the 20% most anthropogenically impaired (hereafter, most impaired) days rather than the haziest days. To support the implementation of this revised requirement, the EPA has proposed (but not finalized) a recommended metric for characterizing the anthropogenic and natural portions of the daily extinction budget at each site. This metric selects the 20% most impaired days based on these portions using a “delta deciview” approach to quantify the deciview scale impact of anthropogenic light extinction. Using this metric, sulfate and nitrate make up the majority of the anthropogenic extinction in 2015 on these days, with natural extinction largely made up of organic carbon mass in the eastern U.S. and a combination of organic carbon mass, dust components, and sea salt in the western U.S. For sites in the western U.S., the seasonality of days selected as the 20% most impaired is different than the seasonality of the 20% haziest days, with many more winter and spring days selected. Applying this new metric to the 2000–2015 period across sites representing Class I areas results in substantial changes in the calculated visibility trend for the northern Rockies and southwest U.S., but little change for the eastern U.S.
Implications: Changing the approach for tracking visibility in the Regional Haze Rule allows the EPA, states, and the public to track visibility on days when reductions in anthropogenic emissions have the greatest potential to improve the view. The calculations involved with the recommended metric can be incorporated into the routine IMPROVE (Interagency Monitoring of Protected Visual Environments) data processing, enabling rapid analysis of current and future visibility trends. Natural visibility conditions are important in the calculations for the recommended metric, necessitating the need for additional analysis and potential refinement of their values.
Introduction
In the 1977 Clean Air Act Amendments, Congress set as a national goal the prevention of future and remedying of existing visibility impairment resulting from man-made air pollution in Class I federal lands such as national parks and wilderness areas. To address this goal, the Regional Haze Rule was finalized in 1999 and called on states to establish goals and reduce emissions to improve visibility in 156 mandatory Class I areas. The recently revised 2017 Regional Haze Rule (82 FR 3078) defines regional haze as “visibility impairment that is caused by the emission of air pollutants from numerous anthropogenic sources located over a wide geographic area. Such sources include, but are not limited to, major and minor stationary sources, mobile sources, and area sources.” In the 2017 Regional Haze Rule, visibility impairment was defined as “any humanly perceptible difference due to air pollution from anthropogenic sources between actual visibility and natural visibility on one or more days.” The Interagency Monitoring of Protected Visual Environments (IMPROVE) program was created in 1988 to identify chemical species responsible for existing anthropogenic and natural visibility impairment, document long-term trends for assessing progress toward the national visibility goal, and provide regional haze monitoring data representing Class I areas (Hand et al. Citation2012a; Malm et al. Citation1994, Citation2004). Daily PM2.5 (particulate matter with an aerodynamic diameter <2.5 μm) speciation concentrations for the IMPROVE network are sampled every third day and reported at local conditions (not corrected to standard pressure and temperature). Anions are analyzed from nylon filters using ion chromatography and blank corrected. Carbon aerosols are analyzed from quartz filters using thermal optical techniques, with the organic carbon concentrations corrected for a positive additive artifact (Chow et al. Citation2010; Dillner, Phuah, and Turner Citation2009; Watson et al. Citation2009). To convert these concentration measurements to light extinction, we use the revised IMPROVE equation (Pitchford et al. Citation2007). This revised IMPROVE equation calculates the daily light extinction from the daily concentrations of seven components (ammonium sulfate, ammonium nitrate, organic carbon mass (OCM), elemental carbon, fine soil, coarse matter, and sea salt), combined with site-specific Rayleigh scattering estimates and monthly average relative humidity climatology. To be consistent with the United States (U.S.) Environmental Protection Agency (EPA) 2003 Guidance for Tracking Progress Under the Regional Haze Rule (EPA 2003), only years with the following data criteria have been analyzed: (1) 75% completeness on all scheduled sampling days, (2) 50% completeness on scheduled sampling days in each quarter, and (3) no more than 10 missing scheduled sampling days in a row.
For tracking visibility over time, the 2017 Regional Haze Rule requires states to track visibility on the 20% most impaired (and 20% clearest) days. Previously, Previously, the U.S. EPA's 2003 Regional Haze Rule guidance describe the tracking of visibility conditions on the clearest and haziest days having the lowest and highest deciview values, respectively (EPA 2003). Deciviews are a unit of measurement of the “haze index” and can be calculated directly from the total light extinction (Text) by the following:
where Text is now most often calculated following the revised IMPROVE equation in Pitchford et al. (Citation2007).
One difficulty in discerning improvement in visibility due to control of anthropogenic sources is the highly variable impact of natural sources, such as dust storms and wildfire smoke at certain Class I areas on the haziest days. After discussions with stakeholders, the EPA proposed “Draft Guidance for the Second Implementation Period of the Regional Haze Rule” in July 2016 and finalized Regional Haze Rule revisions in January 2017 to address this and other aspects of the program. In the 2016 Draft Guidance (EPA 2016a) and associated Technical Support Document (TSD) (EPA 2016b), a draft recommended approach for the visibility tracking metric for the Regional Haze Program was described and applied to IMPROVE data from 2000 to 2014. The 2016 Draft Guidance has not yet been finalized, but this study expands upon the description of the recommended visibility tracking metric in the 2016 Draft Guidance and associated TSD by incorporating more recent IMPROVE data from 2015 and showing additional novel analyses of the aerosol composition and trends between 2000 and 2015.
Description of the recommended visibility tracking metric
A comprehensive description of the recommended visibility tracking metric is given in the 2016 Draft Guidance and associated TSD. In summary, the recommended tracking metric selects a different set of days that are the “most impaired” rather than the “haziest” to calculate the values specified in the Regional Haze Rule. The level of daily impairment (I) is determined by the difference (delta) between the total and natural deciview values:
which is proportional to the log of the ratio of Text to natural extinction (Next).
This extinction ratio is highest for days with high anthropogenic extinction and low natural extinction. Several steps are involved in estimating the natural and anthropogenic split of extinction. The first step is to determine a threshold value for episodic (natural) versus routine (natural + anthropogenic) dust and carbon extinction. This involves calculating the lowest annual 95th percentile carbon (organic carbon mass + light absorbing carbon) and dust (fine soil + coarse mass) extinction values for the years available during the analyses for the TSD (2000–2014) and assigning the daily carbon and dust extinction in excess of this threshold as episodic. The remaining nonepisodic carbon and dust are converted back to their individual components proportionally and along with the other components are split into routine natural and anthropogenic fractions (with sea-salt and Rayleigh extinction considered natural). These fractions are determined daily based on the ratio of the annual averages of each component’s nonepisodic extinction and the average natural extinction values estimated by the 2006 National Conditions II (NCII) committee. This statistical method of determining the natural and anthropogenic fractions of light extinction is not informed by analysis of chemical source signatures or source-receptor modeling; therefore, components such as organic carbon mass that have a complex mixture of sources (including biogenic emissions, wildfire, prescribed fire, agricultural fire, residential wood combustion, biomass burning, and fossil fuel combustion) are most likely to incorrectly classified.
Finally, the daily impairment is calculated from these natural and anthropogenic fractions and ranked to select the 20% most impaired days for each year. See the Draft Guidance and TSD for a detailed description of these steps. After this different set of 20% most impaired days is selected, the calculation of the annual and 5-yr average total deciview values used to track visibility progress would be the same using the recommended metric or the original metric. Site-specific graphs of the extinction composition[s] and deciview values for the 20% most impaired days can be found in Appendix G of the TSD.
Results
Comparison of the 20% haziest and 20% most impaired days
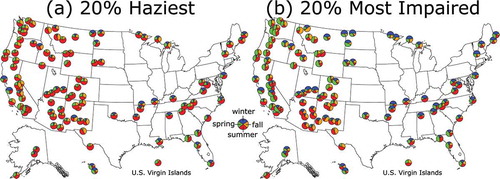
Because the set of days selected as the 20% haziest and 20% most impaired are different, the resulting extinction composition[s] and deciview trends of the two metrics may also be different. The composition of aerosol extinction on the 20% haziest days (original metric) in 2015 is regionally distinct; sulfate contributes to half or more of the extinction across the eastern U.S. and Hawaii, organic carbon mass (OCM; calculated as organic carbon × 1.8) contributes to most of the extinction in the northern Rockies and Pacific Northwest, and a mixture of components contributes to extinction in California, the southwest U.S., and the northern Great Lakes region (see ). The extinction in some areas along the coast in California and Alaska is dominated by sea salt (calculated as chloride × 1.8). Compared with the 20% haziest days, the composition on the 20% most impaired days (recommended metric; ) consistently has greater fractions of sulfate and nitrate and smaller fractions of OCM, coarse mass (calculated as the difference between PM10 [PM <10 μm] and PM2.5), and sea salt (especially for sites in Alaska and along the Pacific Coast). Regionally, notable shifts between the 20% haziest and 20% most impaired days occurred for sites in the Pacific Northwest, Northern Rockies, and the southwest U.S. due to the removal of OCM and coarse mass extinction days in the recommended metric. This large difference in the OCM and coarse mass extinction for the 20% most impaired days relative to the 20% haziest days in the western U.S. impacts the fractional composition more than the changes in sulfate or nitrate extinction. Because sulfate and nitrate typically come from anthropogenic sources (Copeland Citation2005), this shift away from OCM and coarse mass makes the recommended tracking metric more sensitive to emission reduction strategies that target anthropogenic emissions.
Figure 1. Chemical composition[s] of aerosol extinction in 2015 scaled in proportion to the square root of the total aerosol extinction for days selected as the (a) 20% haziest and (b) 20% most impaired.
![Figure 1. Chemical composition[s] of aerosol extinction in 2015 scaled in proportion to the square root of the total aerosol extinction for days selected as the (a) 20% haziest and (b) 20% most impaired.](/cms/asset/efd4c83e-49b3-4d26-a64d-5c463f305083/uawm_a_1424058_f0001_oc.jpg)
The seasonality (winter: December–February; spring: March–May; summer: June–August; fall: September–November) of days selected in the 20% haziest and 20% most impaired days helps explain these changes in composition (see ). Summer days, which are frequently influenced by OCM-heavy smoke and secondary organic aerosols (SOAs), dominate the 20% haziest days () much more than the 20% most impaired days (). For the 20% most impaired days, the winter and spring days with more nitrate (mostly attributed to anthropogenic sources) and less OCM/coarse matter (mostly attributed to natural sources) are selected. Because anthropogenic sources typically emit throughout the year, this shift in the 20% most impaired days from mainly summer to all seasons suggests that the recommended tracking metric is more responsive to emission reduction strategies targeting these sources. The higher number of winter days selected as the 20% most impaired is similar to the seasonality of high-PM2.5 episodes in the western U.S. (Baker, Simon, and Kelly Citation2011) and some areas of the northeastern U.S.; this indicates the importance of emission reduction strategies targeting nitrate which improve visibility and help attain/maintain the PM2.5 24-hr National Ambient Air Quality Standards.
Figure 2. Seasonality (winter: December–February; spring: March–May; summer: June–August; fall: September–November) of days in 2015 selected as the (a) 20% haziest and (b) 20% most impaired.
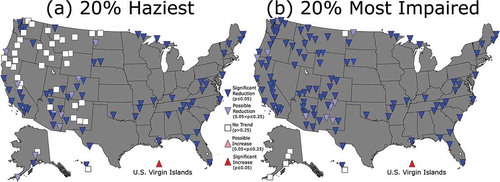
Although visibility progress is determined in the Regional Haze Program using 5-yr averages of current deciview values compared with the 2000–2004 baseline period, other statistical methods can be employed to determine significance in deciview trends. shows the statistical significance (P value; determined by the strength of the relationship between year and deciview) and direction of the linear Pearson correlation coefficient of the deciview trends for the 20% haziest and 20% most impaired days from 2000 to 2015. For the 20% haziest days (), sites in the eastern U.S. and southern California have significant visibility improvement (deciview reduction) whereas sites in the western U.S. are mixed between no trend, possible improvement, and significant improvement. Some sites in the southwest U.S. with no visibility trend for the 20% haziest days are in close proximity with sites having significant improvement, suggesting that sporadic localized emissions such as wildfire smoke and dust storms can impact the visibility trend. For the 20% most impaired days (), only Medicine Lake, Montana, within the contiguous U.S. does not have a significant or possible visibility improvement between 2000 and 2015. Several sites in Alaska, Hawaii, and the U.S. Virgin Islands have had either no visibility trend or a degradation in visibility during this period. The U.S. Virgin Islands site experienced visibility degradation regardless of the choice of metric; this may be related to increases in Atlantic Ocean wind speed (Zheng, Pan, and Li Citation2016) leading to higher sea-salt concentrations. When the 2000–2015 period is divided in half (2000–2007 and 2008–2015) and the same statistical test (linear Pearson correlation coefficient of the deciview trend) is applied, significant visibility improvement in the eastern U.S. and southern California is more widespread in the 2008–2015 period for both the 20% haziest and 20% most impaired metrics (see Figure S1). Most sites in the U.S. had visibility improvement for the 20% most impaired days during 2008–2015; this is in contrast to the 2000–2007 period, which had no trend in visibility for most sites.
Figure 3. Significance and direction of the linear visibility trends (in deciviews) from 2000 to 2015 for days selected as the (a) 20% haziest and (b) 20% most impaired.
Natural and anthropogenic fractions of the 20% most impaired days
In addition to identifying the level of impairment for each day, the recommended tracking metric uses a statistical method to calculate the composition-specific episodic and routine fractions of the extinction in order to differentiate the natural and anthropogenic contributions. For the 20% most impaired days in 2015, the natural extinction is substantially smaller than the anthropogenic extinction at sites in the eastern U.S. and California and comparable in many of the sites in the Pacific Northwest and southwest U.S. (see ). Some sites in the western U.S. have greater natural extinction than anthropogenic on the 20% most impaired days in 2015; this highlights their remote location and generally good visibility conditions. The composition of the natural extinction () is quite different from that of the anthropogenic extinction (), with OCM dominating the natural fraction at most sites and sulfate/nitrate dominating the anthropogenic fraction. OCM makes up a sizeable fraction of the anthropogenic extinction at sites in the Northern Rockies, which may be due to an erroneous attribution of frequently occurring wildfire smoke as anthropogenic in origin. Sites outside the contiguous U.S. have the most divergent composition[s] of natural and anthropogenic extinction. At these sites, natural extinction consists of a mixture of components whereas anthropogenic extinction is nearly 100% sulfate (sulfate and coarse mass for the U.S. Virgin Islands). The large magnitude of anthropogenic sulfate extinction for the site in Hawaii, given its remoteness from large industrial sources of sulfur dioxide (SO2), suggests that some natural sulfate from volcanoes is impacting the extinction budget attributed to anthropogenic sources and indicates that additional analyses using source-receptor modeling may be needed to properly attribute the source of sulfate extinction.
Figure 4. Chemical composition[s] of (a) natural and (b) anthropogenic aerosol extinction during the 20% most impaired days in 2015 scaled in proportion to the square root of natural and anthropogenic aerosol extinction, respectively.
![Figure 4. Chemical composition[s] of (a) natural and (b) anthropogenic aerosol extinction during the 20% most impaired days in 2015 scaled in proportion to the square root of natural and anthropogenic aerosol extinction, respectively.](/cms/asset/ed8de964-d811-48ba-8c26-5eb8dc728863/uawm_a_1424058_f0004_oc.jpg)
The recommended visibility tracking metric can also be used to determine the distinct trends in visibility attributed to natural () and anthropogenic () sources. For the anthropogenic-sourced visibility trends, all sites in the contiguous U.S. except for Medicine Lake (Montana) and Lostwood (North Dakota) had significant improvement between 2000 and 2015 on the 20% most impaired days. The trends for these two sites could be have been influenced by their vicinity to the Bakken region, which has experienced growth in oil/gas production and associated wintertime haze episodes (Evanoski-Cole et al. Citation2017; Hand et al. Citation2014; Prenni et al. Citation2016). The trend in natural visibility is more variable than that of anthropogenic visibility. In the western U.S., most sites had no trend but a few had improvements or degradation in visibility associated with natural sources. The sites with significant improvement or degradation in natural visibility did not cluster geographically, suggesting that local emissions attributed to natural sources may be responsible.
Figure 5. Significance and direction of the (a) natural and (b) anthropogenic (total minus natural) linear visibility trends (in deciviews) on the 20% most impaired days from 2000 to 2015.
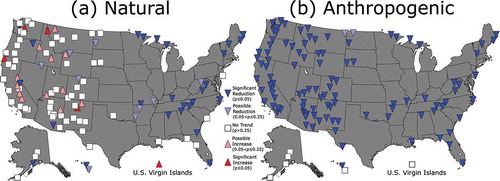
In the eastern U.S., nearly all noncoastal sites had a possible or significant improvement in natural visibility during this time period. This is not an expected result, as in the eastern U.S. natural emissions are due mostly to biogenic emissions, which are not subject to large variability over time. It is possible that the improving trend in natural extinction is due to the interaction between natural and anthropogenic pollution, particularly in regards to the reduction in SOA yields from biogenic volatile organic compounds (VOCs) under the much lower anthropogenic sulfate concentrations in the 2008–2015 period (Carlton et al. Citation2009; Blanchard et al. Citation2016; Hand et al. Citation2012b). If this trend in natural visibility in the eastern U.S. is due to biogenic SOA yields, it highlights the difficulty in determining whether light extinction is attributable to natural or anthropogenic sources when they are closely intertwined. The lack of a trend in natural deciviews at coastal sites in the eastern U.S. may be due to increased transport of Saharan dust (Bozlaker et al. Citation2013; Hand, Gill, and Schichtel Citation2017) or local sea-salt production.
When the 2000–2015 period is divided in half (2000–2007 and 2008–2015), the significant improvement in the eastern U.S. for both anthropogenic and natural visibility is more evident in the 2008–2015 period (see Figure S2). For the western U.S., far more sites experienced a significant degradation in natural visibility during the first half (2000–2007) than the second half (2008–2015) of the study period. This lack of consistency in extinction trends attributed to natural sources may complicate demonstrations of visibility progress as part of the Regional Haze Rule, particularly in areas with a degradation in natural visibility.
Conclusion
In the 2017 Regional Haze Rule revisions and 2016 Draft Guidance, a new focus on anthropogenically impaired days was finalized and a recommended visibility tracking metric was proposed, both based on the level of anthropogenic visibility impairment rather than total haze. By using a statistical method to differentiate natural and anthropogenic fractions of light extinction and selecting days based on maximizing the anthropogenic relative to the natural, this recommended metric avoids tracking days with large natural extinction that can dominate the visibility trend at some sites. This recommended visibility tracking metric is (1) much less sensitive to episodic wildfire smoke and dust events, (2) more responsive to anthropogenic emission reductions, and (3) able to differentiate between natural and anthropogenic impacts to visibility.
Because impairment is proportional to the log of the ratio of anthropogenic and natural extinction, the days considered in the 20% most impaired have a substantially different extinction composition and seasonality than the 20% haziest days. The visibility trends from 2000 to 2015 are different at many sites for the 20% haziest and 20% most impaired days, especially in the western U.S. where the 20% most impaired days show a visibility improvement over time. This is due mainly to the removal of episodic dust and wildfire smoke events in the selection of the 20% most impaired days. The composition[s] of natural and anthropogenic sources to visibility are distinct, with sulfate and nitrate dominating the anthropogenic composition at most sites across the U.S. Anthropogenic contributors to visibility degradation have decreased at all sites in the contiguous U.S. over time, particularly during the second half (2008–2015) of the study period.
The statistical method differentiating natural and anthropogenic contributions to light extinction is based solely on IMPROVE observations of the major aerosol components This simplified attribution of natural and anthropogenic sources to light extinction is more uncertain for components such as OCM with a complex mixture of sources and for Hawaii which is influenced by unique natural sources such as volcanoes. The statistical method described in this study could be modified to include site-specific adjustments of the natural conditions values and carbon/dust episodic thresholds that are based on advanced chemical analyses of the IMPROVE observations or source-receptor modeling.
Supplemental Document
Download MS Word (554.3 KB)Acknowledgment
The authors recognize the contributions of many people throughout the Regional Haze Rule revision process, including Tim Allen, Bret Anderson, Jim Boylan, Pat Brewer, Scott Copeland, Neil Frank, Bret Schichtel, Gail Tonnesen, John Vimont, and several other representatives from state agencies, and EPA and other federal employees. IMPROVE is a collaborative association of state, tribal, and federal agencies, and international partners. We also appreciate the comments from three anonymous reviewers that greatly improved the paper.
Supplemental data
Supplemental data for this paper can be accessed on the publisher’s website.
Additional information
Funding
Notes on contributors
Brett Gantt
Brett Gantt is a statistician in the Office of Air Quality Planning and Standards at the U.S. Environmental Protection Agency.
Melinda Beaver
Melinda Beaver, Brian Timin, and Phil Lorang are environmental protection specialists in the Office of Air Quality Planning and Standards at the U.S. Environmental Protection Agency.
Related Research Data
References
- Baker, K. R., H. Simon, and J. T. Kelly. 2011. Challenges to modeling “cold pool” meteorology associated with high pollution episodes. Environmental Science & Technology 45 (17):7118–19. doi:10.1021/es202705v.
- Blanchard, C. L., G. M. Hidy, S. Shaw, K. Baumann, and E. S. Edgerton. 2016. Effects of emission reductions on organic aerosol in the southeastern United States. Atmos Chemical Physical 16:215–38. doi:10.5194/acp-16-215-2016.
- Bozlaker, A., J. M. Prospero, M. P. Fraser, and S. Chellam. 2013. Quantifying the contribution of long-range Saharan dust transport on particulate matter concentrations in Houston, Texas, using detailed elemental analysis. Environmental Science & Technology 47:10,179–10,187.
- Carlton, A. G., C. Wiedinmyer, and J. H. Kroll. 2009. A review of secondary organic aerosol (SOA) formation from isoprene. Atmos Chemical Physical 9:4987–5005. doi:10.5194/acp-9-4987-2009.
- Chow, J. C., J. G. Watson, L.-W. A. Chen, J. Rice, and N. H. Frank. 2010. Quantification of PM2.5 organic carbon sampling artifacts in U.S. networks. Atmos Chemical Physical 10:5223–39.
- Copeland, S. A. 2005. A statistical analysis of visibility-impairing particles in federal Class I areas. Journal of the Air and Waste Management Association 55:1621–35. doi:10.1080/10473289.2005.10464756.
- Dillner, A. M., C. H. Phuah, and J. R. Turner. 2009. Effects of post-sampling conditions on ambient carbon aerosol filter measurements. Atmospheric Environment 43:5937–43.
- Evanoski-Cole, A. R., K. A. Gebhart, B. C. Sive, Y. Zhou, S. L. Capps, D. E. Day, A. J. Prenni, M. I. Schurman, A. P. Sullivan, and Y. Li. 2017. Composition and sources of winter haze in the Bakken oil and gas extraction region. Atmospheric Environment 156:77–87.
- Hand, J. L., T. E. Gill, and B. A. Schichtel. 2017. Spatial and seasonal variability in fine mineral dust and coarse aerosol mass at remote sites across the United States. Journal of Geophysical Research: Atmospheres 122:3080–97.
- Hand, J. L., B. A. Schichtel, W. C. Malm, S. Copeland, J. V. Molenar, N. H. Frank, and M. L. Pitchford. 2014. Widespread reductions in haze across the United States from the early 1990s through 2011. Atmospheric Environment 94:671–79. doi:10.1016/j.atmosenv.2014.05.062.
- Hand, J. L., B. A. Schichtel, W. C. Malm, and M. L. Pitchford. 2012b. Particulate sulfate ion concentration and SO2 emission trends in the United States from the early 1990s through 2010. Atmos Chemical Physical 12:10353–65. doi:10.5194/acp-12-10353-2012.
- Hand, J. L., B. A. Schichtel, M. Pitchford, W. C. Malm, and N. H. Frank. 2012a. Seasonal composition of remote and urban fine particulate matter in the United States. Journal of Geophysical Research 117:D05209. doi:10.1029/2011JD017122.
- Malm, W. C., B. A. Schichtel, M. L. Pitchford, L. L. Ashbaugh, and R. A. Eldred. 2004. Spatial and monthly trends in speciated fine particle concentration in the United States. Journal of Geophysical Research 109:D0336. doi:10.1029/2003JD003739.
- Malm, W. C., J. F. Sisler, D. Huffman, R. A. Eldred, and T. A. Cahill. 1994. Spatial and seasonal trends in particle concentration and optical extinction in the United States. Journal of Geophysical Research 99:1347–70. doi:10.1029/93JD02916.
- Pitchford, M., W. Malm, B. Schichtel, B. N. Kumar, D. Lowenthal, and J. Hand. 2007. Revised algorithm for estimating light extinction from IMPROVE particle speciation data. Journal of the Air and Waste Management Association 57:1326–36. doi:10.3155/1047-3289.57.11.1326.
- Prenni, A. J., D. E. Day, A. R. Evanoski-Cole, B. C. Sive, A. Hecobian, Y. Zhou, K. A. Gebhart, J. L. Hand, A. P. Sullivan, Y. Li, M. I. Schurman, Y. Desyaterik, W. C. Malm, J. L. Collett Jr., and B. A. Schichtel. 2016. Oil and gas impacts on air quality in federal lands in the Bakken region: An overview of the Bakken Air Quality Study and first results. Atmos Chemical Physical 16:1401–16. doi:10.5194/acp-16-1401-2016.
- U.S. Environmental Protection Agency. 2003. Draft guidance for tracking progress under the Regional Haze Rule. Research Park Triangle, NC: U.S. Environmental Protection Agency, Office of Air Quality Planning and Standards. https://www3.epa.gov/ttnamti1/files/ambient/visible/tracking.pdf. (accessed April 17, 2018).
- U.S. Environmental Protection Agency. 2016a. Draft guidance on progress tracking metrics, long-term strategies, reasonable progress goals and other requirements for regional haze state implementation plans for the second implementation period. Research Park Triangle, NC: U.S. Environmental Protection Agency, Office of Air Quality Planning and Standards. https://www.epa.gov/sites/production/files/2016-07/documents/draft_regional_haze_guidance_july_2016.pdf. (accessed April 17, 2018).
- U.S. Environmental Protection Agency. 2016b. Technical Support Document (TSD) revised recommendations for visibility progress tracking metrics for the regional haze program. Research Park Triangle, NC: U.S. Environmental Protection Agency, Office of Air Quality Planning and Standards. https://www.epa.gov/sites/production/files/2016-07/documents/technical_support_document_for_draft_guidance_on_regional_haze.pdf. (accessed April 18, 2018).
- Watson, J. G., J. C. Chow, L.-W. A. Chen, and N. H. Frank. 2009. Methods to assess carbonaceous aerosol sampling artifacts for IMPROVE and other long-term networks. Journal of the Air and Waste Management Association 59:898–911.
- Zheng, C. W., J. Pan, and C. Y. Li. 2016. Global oceanic wind speed trends. Ocean & Coastal Management 129:15–24.