
ABSTRACT
The replacement of the Desert Research Institute (DRI) model 2001 with model 2015 thermal/optical analyzers (TOAs) results in continuity of the long-term organic carbon (OC) and elemental carbon (EC) database, and it adds optical information with no additional carbon analysis effort. The value of multiwavelength light attenuation is that light absorption due to black carbon (BC) can be separated from that of brown carbon (BrC), with subsequent attribution to known sources such as biomass burning and secondary organic aerosols. There is evidence of filter loading effects for the 25% of all samples with the highest EC concentrations based on the ratio of light attenuation to EC. Loading corrections similar to those used for the seven-wavelength aethalometer need to be investigated. On average, nonurban Interagency Monitoring of PROtected Visual Environments (IMPROVE) samples show higher BrC fractions of short-wavelength absorption than urban Chemical Speciation Network (CSN) samples, owing to greater influence from biomass burning and aged aerosols, as well as to higher primary BC contributions from engine exhaust at urban sites. Sequential samples taken during an Everglades National Park wildfire demonstrate the evolution from flaming to smoldering combustion, with the BrC fraction increasing as smoldering begins to dominate the fire event.
Implications: The inclusion of seven wavelengths in thermal/optical carbon analysis of speciated PM2.5 (particulate matter with an aerodynamic diameter ≤2.5 μm) samples allows contributions from biomass burning and secondary organic aerosols to be estimated. This separation is useful for evaluating control strategy effectiveness, identifying exceptional events, and determining natural visibility conditions.
Introduction
Recent research shows that both black carbon (BC) (U.S. Environmental Protection Agency [EPA] Citation2012) and brown carbon (BrC) (Andreae and Gelencser Citation2006) are important light-absorbing substances in the atmosphere that are associated with sources having potential impacts on health (Eklund et al. Citation2014; Grahame, Klemm, and Schlesinger Citation2014), visibility (Malm Citation2016), and the Earth’s radiation balance (Fiore, Naik, and Leibensperger Citation2015). Whereas BC absorbs electromagnetic radiation from the infrared (IR) to the near ultraviolet (UV), BrC absorbs little radiation at the longer wavelengths (λ) and much more at the shorter wavelengths, giving a yellow or brown appearance to suspended particulate matter (PM) filter samples. The term “brown carbon” is a simplification of the many different colors that are evident in deposits from different PM source emissions (see Eklund et al. [Citation2014] and Chow et al. [Citation2015] for photographic examples), indicating that the absorption spectrum across multiple wavelengths can indicate source contributions (Kirchstetter, Novakov, and Hobbs Citation2004). Whereas BC is attributed to elemental carbon (EC; the temperature-resistant component of soot that consists of small graphite-like aggregates) (Akhter, Chughtai, and Smith Citation1985), BrC has been found to be composed of organic compounds (Laskin, Laskin, and Nizkorodov Citation2015; Moise, Flores, and Rudich Citation2015). BrC has been associated with smoke from the smoldering phase of forest fires/biomass burning (Lack et al. Citation2013), residential and ceremonial wood burning (Chakrabarty et al. Citation2014; Rehman et al. Citation2011), humic-like substances (HULIS) (Park and Son Citation2017; Utry et al. Citation2013) often found in suspended dust, and secondary organic aerosols (SOAs) (Laskin et al. Citation2014; Lin et al. Citation2014; Slikboer et al. Citation2015; Zhao et al. Citation2015).
Seven-wavelength aethalometers (Drinovec et al. Citation2015), which measure attenuation through a quartz-fiber filter tape for radiation at 370, 470, 520, 590, 660, 880, and 950 nm wavelengths, have demonstrated the utility of this information for source apportionment (Favez et al. Citation2010; Liu et al. Citation2011; Massabo et al. Citation2015; Sandradewi et al. Citation2008; Sciare et al. Citation2011) and for radiative transfer related to global warming (Sreekanth, Niranjan, and Madhavan Citation2007). However, many monitoring sites lack such instrumentation, yet they provide quartz-fiber filter samples that are currently being characterized for organic carbon (OC) and EC by thermal/optical analysis. This is the case for measurements in the U.S. Interagency Monitoring of PROtected Visual Environments (IMPROVE) and Chemical Speciation Network (CSN) (Solomon et al. Citation2014), the two national long-term networks in the United States that measure PM2.5 (particulate matter with an aerodynamic diameter ≤2.5 µm) chemical composition in nonurban and urban areas. As of January 2016, both networks are reporting multiwavelength (i.e., 405, 445, 532, 635, 780, 808, and 980 nm) radiation attenuation along with OC/EC splits at each of these wavelengths (Chen et al. Citation2015; Chow et al. Citation2015). This additional information comes with no increased analysis cost for ongoing carbon measurements.
This paper takes a first look at a full year (2016) of multiwavelength thermal/optical carbon measurements from the IMPROVE and CSN measurements (~30,000 samples) to better understand their utility for air quality management. It examines measurement reproducibility and filter loading effects; the separation of BrC from BC using multiwavelength filter transmittance; transmittance attenuation for source samples; seasonal and spatial patterns; and BC and BrC evolution during a wildfire event.
Methodology
Multiwavelength thermal/optical analysis
The commonly applied IMPROVE_A thermal/optical protocol for PM2.5 samples reports OC, EC, and seven thermally separated carbon fractions (Chow et al. Citation2007, Citation1993, Citation2011) for approximately 300 nonurban IMPROVE sites since 1986 and urban CSN sites since 2006. The IMPROVE_A protocol uses stepped heating of a 0.5-cm2 punch from each 25-mm quartz-fiber filter sample in a helium (He) atmosphere for OC, and in a He/oxygen (O2) atmosphere for EC. Three such punches can be taken from each filter, allowing for replicate analysis to estimate precision. As some of the OC is pyrolyzed in the inert He, light reflectance (R) and transmittance (T) from a red laser is monitored to determine filter darkening by pyrolysis, with EC determined by the carbon detected after R returns to its initial value (Huntzicker et al. Citation1982).
Different thermal/optical analysis approaches provide different values for OC and EC (Watson, Chow, and Chen Citation2005); therefore, these fractions are defined by the specific carbon analysis protocol. Some of the variables affecting the OC/EC split are instrument specific, but many of them are procedural. Chow et al. (Citation2011) outline the quality control (QC) and quality assurance (QA) measures needed to maintain consistency, which include testing of the inert He carrier gas for O2 intrusion; calibrating the thermocouple temperature detector in situ; injecting a carbon-containing gas for every sample to evaluate detector variability; conducting external systems and performance audits; and executing periodic internal performance tests using known standards and replicates across multiple instruments.
As OC and EC by thermal/optical analysis are operationally defined, consistent measurement methods are needed to assess long-term trends (Chen et al. Citation2012;; EPA Citation2012; Hand et al. Citation2014; Murphy et al. Citation2011) that indicate pollution control effectiveness and track progress toward natural visibility conditions. As of January 2016, the Desert Research Institute (DRI) model 2001 thermal/optical analyzer (TOA; Atmoslytics, Calabasas, CA) was replaced with the DRI model 2015 multiwavelength TOA (Magee Scientific, Berkeley, CA) after extensive testing and replicate analysis between both instruments (Chen et al. Citation2015; Chow et al. Citation2015). Although the control hardware and software differ between these instruments, the sample presentation, heating, and optical detection portions are identical, except that the 633 nm helium-neon (He-Ne) laser was replaced with a 635 nm laser diode. As part of the hardware upgrade, six additional diode lasers were added to obtain R and T measurements at wavelengths extending from 405 to 980 nm. R and T values are available every second throughout the analysis, which offers an opportunity to better understand the carbon evolution and pyrolysis processes taking place. Current outputs include OC and EC determined by each of the seven lasers returning to its initial values for both R and T, as well as estimates of R and T attenuation by the aerosol deposit at each wavelength.
Aerosol radiation absorption calculations
The model 2015 modulates the lasers throughout the analysis and averages the background-corrected photodiode signals every second. The resulting signals are reported as the magnitude of wavelength-specific laser reflectance and transmittance ( and
, respectively). Depending on the optical properties of the sample, laser intensity, response of the photodiode, and light path between the lasers and detectors,
and
may vary between instruments. A set of optical transfer standards is used to calibrate the optical signals of each TOA, relating
and
signals to absolute filter reflectance and transmittance (
and
, respectively) (Chow et al. Citation2015). Radiation attenuation of an aerosol deposition on a filter (
), including scattering and absorption within the filter, is determined by the Beer-Lambert law:
where i and f indicate measured before and after thermal carbon analysis, respectively. Assuming all carbon has been removed by thermal heating,
approximates a carbon-free blank filter.
is used to calculate the attenuation coefficient (bATN):
where A is the filter deposit area and V is the volume of sampled air (both IMPROVE and CSN use 25-mm quartz-fiber filters with 3.53 cm2 deposit area and 33.12 m3 sample volume for each 24-hr duration sample). bATN has the unit of inverse megameters (Mm−1), as V/A can be interpreted as the length of a cylindrical air column drawn through the filter, analogous to a sight path between an observer and a target (Watson Citation2002). The term bATN is used to distinguish the filter-based measurement from the fundamental aerosol light absorption coefficient, bABS, owing to multiple scattering, particle loading, and interference of nonabsorbing particles (Chow et al. Citation2010). Comparison studies demonstrate that bATN on quartz-fiber filters are about twice the actual bABS (Weingartner et al. Citation2003), but the two measures are highly correlated. The bATN wavelength dependence is often described as :
where the absorption Ångström exponent (AAE) is close to 1 for BC but takes on larger values (AAE of >1 to 15) for different-colored PM deposits such as BrC (Eklund et al. Citation2014). Two wavelengths in the near-ultraviolet (UV) and visible ranges can be used to determine AAE (eq 3). Using a fitting coefficient, the AAE can also be approximated with multiple data points fit from all seven wavelengths (Moosmüller, Chakrabarty, and Arnott Citation2009):
where C is the fitting coefficient. With the attenuation being measured, the contributions of light attenuation to both BC and BrC for each sample can be calculated using a simplified two-component model (Chen et al. Citation2015; Hadley, Corrigan, and Kirchstetter Citation2008; Sandradewi et al. Citation2008):
where qBC and qBrC are fitting coefficients. Assuming AAEBC equals 1, eq 5 can be simplified as:
For each potential AAEBrC between 1.5 and 15, the fitting coefficients (i.e., qBC and qBrC) are determined by least squares minimization between the measured and calculated values (Bevington Citation1969). The overall best fit corresponding to the lowest mean squared error (MSE) is selected as the effective AAEBrC. A screenshot of the fitting program in model 2015 and an example of the model fit with minimum MSE are shown in Figures S1 and S2.
Using these fitting coefficients, the bATN due to BC and BrC are calculated at each wavelength (eq 6). The fraction of light attenuation due to BC versus BrC provides qualitative insight into the composition of the carbon loaded on each filter. Lack and Langridge (Citation2013) note that AAEs for internally mixed BC can vary from 0.55 to 1.7. Assuming an AAE of 1 may lead to uncertainties in estimating BC and BrC absorption at short wavelengths. With this range of AAEs for BC, BrC contributions greater than ~20% of total absorption for a given wavelength can be detected. It is likely that the variability of BC AAEs in typical ambient samples is smaller than these extremes. Without knowing the actual attenuation coefficients (bATN) due to BC and BrC, a theoretical determination of their uncertainties is unattainable (Zotter et al. Citation2017).
The bATN precision is determined from replicate measurements as the average fractional difference between original and replicate analyses. For this study, the bATN uncertainty is calculated from fractional precision times measured bATN and the lower quantifiable limits (LQLs), which are set at the larger of 3 times standard deviation of field blank samples or instrumental detection limits.
IMPROVE and CSN carbon measurements from the beginning of January through the end of 2016 are examined here. To distinguish optical characteristics between nonurban and urban environments, the six urban IMPROVE sites (i.e., Atlanta, Georgia; Birmingham, Alabama; Detroit, Michigan; Fresno, California; Phoenix, Arizona; and Pittsburgh, Pennsylvania) with 832 samples used to ensure long-term comparability between the two networks were excluded from the analysis. For the six collocated CSN sites, only data from the primary samplers were retained (i.e., excluded 336 collocated samples). As a result, the following data analysis includes 17,390 samples from 153 IMPROVE sites and 12,222 samples from 142 CSN sites. The monthly distribution of sample numbers is shown in Table S1.
Data evaluation
Replicate analysis
IMPROVE and CSN samples were analyzed on 13 model 2015 TOAs. As part of normal QC procedures, at least 10% of the samples were randomly selected for replicate analysis (i.e., two separate punches are taken from the same sample and analyzed on different carbon instruments). Consistency in replicate analysis was examined for total carbon (TC) and seven carbon fractions, the wavelength dependence of optical pyrolysis (OP; used to correct OC/EC split), and laser attenuation at different wavelengths (ATNλ in eq 1). Comparing results between the two punches gives information regarding consistency and equivalence between the instruments. Nonuniform sample deposits can cause variability, and these were flagged during analysis when there was a visible indication.
There were 1867 replicate pairs for IMPROVE and 1612 for CSN during 2016. By comparing values for each pair, an indication of the interinstrument comparability of carbon fractions and filter light attenuation at each wavelength can be obtained. High correlation coefficients (r) were found for TC (r = 1.00) and for OC carbon fractions (OC1–OC4; OC evolved at 140, 280, 480, and 580 °C in a He atmosphere), ranging from 0.93 to 1.00 for IMPROVE and from 0.96 to 0.98 for CSN (Table S2). High correlations (r = 0.99) were also found for low-temperature EC1 (EC evolved at 580 °C in He/O2 atmosphere), but with lower correlations (0.90 < r < 0.91) found for EC2 (740 °C) attributed to the many near-detection-limit (0.011 µg/m3) EC2 concentrations. With recent advances in diesel engines, ambient EC2 concentrations (Watson et al. Citation1994) have decreased, with low levels (averaging 0.03–0.06 µg/m3) found in both networks. Correlation coefficients for high-temperature (840 °C) EC3 from the IMPROVE replicates are not meaningful because most EC3 concentrations are below the LQL.
Replicate pair correlations for optical pyrolysis by reflectance (OPR) were lower than those for optical pyrolysis by transmittance (OPT) at most wavelengths (Table S3). However, the OP(λ) corrections to OC(λ) and EC(λ) were much less for OPR than that for OPT. The lower correlations for OPR reflect the lower relative concentrations. Chow et al. (Citation2004) demonstrate that organic vapors adsorbed within quartz-fiber filters (Watson et al. Citation2009) pyrolyze and evolve after stepped heating of the aerosol deposit, which is the main reason for the differences between EC determined by reflectance (ECR) and transmittance (ECT). Because OP formed from OC in the aerosol deposit evolves sooner than OP from adsorbed vapors within the filter, the reflectance signal used to determine OPR returns to its original value before the transmittance signal, which is dominated by within-filter pyrolysis. As a result, ECR is higher than ECT. The ratio of average OPR to OPT ranged from 63% to 75% for IMPROVE and from 24% to 41% for CSN samples. Samples from the urban CSN network are expected to exhibit higher levels of organic vapor adsorption owing to proximity to primary emissions, resulting in enhanced pyrolysis within the filter and yields higher OPT values. The following analysis uses OPR to calculate EC concentrations, where ECR = EC1 + EC2 + EC3 − OPR (Chow et al. Citation2007).
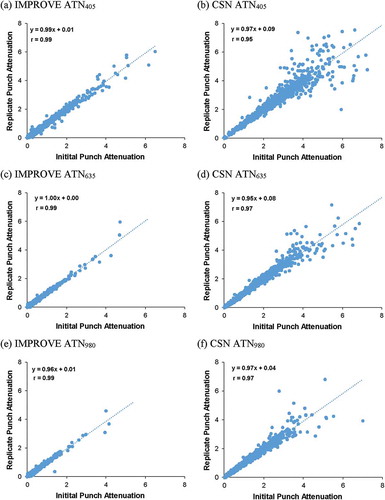
Scatterplots of the paired attenuations at 405, 635, and 980 nm for both networks are shown in . Correlations for replicate attenuation measurements range from 0.98 to 0.99 for IMPROVE samples and from 0.95 to 0.98 for CSN samples, indicating consistency among instruments (Table S3). Somewhat higher (<4%) replicate pair correlations are found for IMPROVE compared with CSN samples. With the exception of the larger deviations found for the CSN ATN405 samples, most deviations from linearity are found for ATNλ >4. This is likely due to lower transmittance signal-to-noise ratios for more heavily loaded samples as well as the effects of filter loading and multiple scattering within the filter.
Figure 1. Comparison of replicate and initial filter light attenuation at 405 nm (a and b), 635 nm (c and d), and 980 nm (e and f) for the 2016 IMPROVE (left) and CSN (right) samples.
Filter loading effects on attenuation
As filter loadings of light-absorbing aerosol increases, the attenuation response to additional loading decreases after some threshold. The loading effect is more pronounced at shorter wavelengths owing to higher BC absorption as well as the presence of BrC. As AAE can be calculated using the ratio of attenuation coefficients at different wavelengths (eq 3), the AAE will be affected by these saturation effects at high EC concentrations.
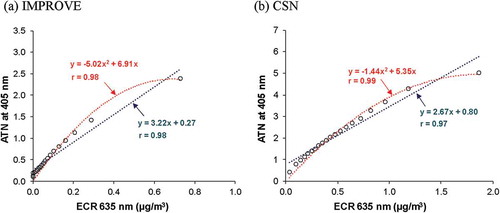
The relationship between ATN405 and EC is first examined to assess the threshold of filter loading levels. A good correlation (r = ~0.9) is observed, but the density of data points obscures the saturation effect (Figure S3). To simplify, average attenuation at 405 nm (ATN405) and average EC at 635 nm (EC635) is plotted at 5th percentile intervals of EC concentration (e.g., 0th–5th percentiles, 5th–10th percentiles, etc.) in , which reveals a gradual reduction in ATN405 as EC concentrations increase. A quadratic relationship (Arnott et al. Citation2005) between ATN405 and EC635 provides a better fit to the data.
Figure 2. Attenuation at 405 nm (ATN405) versus elemental carbon by reflectance (ECR) at 635 nm (i.e., EC635) averaged over each 5th percentile range of ECR for (a) IMPROVE and (b) CSN samples.
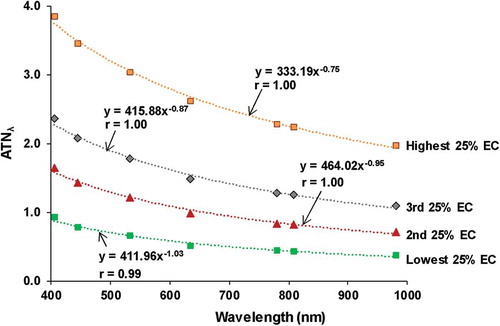
As shown in eqs 3 and 4, attenuation is assumed to be proportional to λ−AAE. Assuming an AAE of 1 (typical of BC), the product of attenuation multiplied by wavelength (λ) as a function of λ should be a horizontal line with a slope of 0 for BC-dominated samples (eq 6; Chen et al. Citation2015). Figure S4 shows that EC concentration slopes are close to 0 through the lower 75th percentile of data and then become increasingly positive at high EC concentrations (e.g., EC >0.65 µg/m3 at the highest 10th and 25th percentiles). These increasing slopes are associated with lower laser response due to saturation effects. Therefore, the fractional contribution of BrC to light attenuation and AAE represents a lower bound of the actual values for high EC concentrations. shows attenuation versus wavelength with power-law fits to the data for each 25th percentile range of EC. The exponents (representing AAEs) in these equations decrease from 1.03 to 0.75 from the lowest to the highest 25% of the EC concentrations, respectively. This indicates filter loading effects unless there is some fundamental change in the attenuation characteristic of the aerosol as EC concentrations increase. Loading corrections similar to those applied to the aethalometer (Jimenez et al. Citation2007; Virkkula et al. Citation2007) can be investigated to increase attenuation accuracy at high EC concentrations.
Figure 3. Power-law fit of ATN versus wavelength for each 25th percentile of EC concentrations by reflectance (ECR) for the 2016 CSN samples.
Results
BC and BrC in source samples
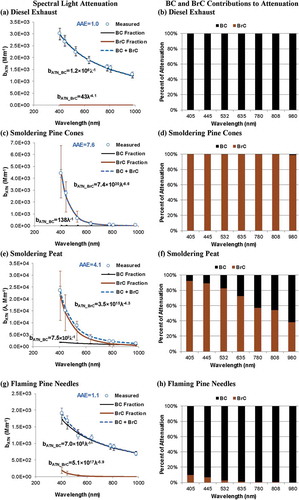
shows spectral attenuation and contributions from BC and BrC for different source samples (Chow et al. Citation2015). For the diesel exhaust sample (, ), light attenuation is nearly 100% contributed by BC at all wavelengths. An AAE equal to 1 can be derived from Mie theory for BC particles in the Rayleigh scattering region (Moosmüller and Arnott Citation2009). However, depending on BC particle size distribution and the presence of BrC, AAEs can deviate from 1 for larger particles (Bond Citation2001; Gyawali et al. Citation2009). Similar pattern (Figure S5a, b) are found for vehicle exhaust–dominated samples in a roadway tunnel (Wang et al. Citation2017). For smoldering samples (i.e., smoldering pine cones in , ; peat burning in , ; and prescribed burning in Figure S5c, d; Malamakal et al. Citation2013), light attenuation is dominated by BrC at all wavelengths with AAEs in the range of 2.9–7.6. The flaming pine needle sample (, ) shows that BC contributes to ≥90% light attenuation, with an AAE of 1.1. The aged Yosemite Rim Fire (Navarro et al. 2016) sample (Figure S5e, f; collected in Reno, Nevada) is dominated by BC, with an AAE of 1.8. The amounts of BC and BrC in these biomass burning samples depend on both the fuels and combustion conditions, with nonflaming emissions being the major BrC contributors. Ambient samples from the IMPROVE and CSN networks affected by biomass burning are expected to represent emissions from both flaming and smoldering, with the resulting mixture of BC and BrC.
Figure 4. Spectral light attenuation and contributions from BC and BrC for source samples from diesel engine exhaust (a and b), smoldering pine cone smoke (c and d), smoldering Florida peat (e and f), and flaming pine needle smoke (g and h). The left panels depict the decomposition of total light attenuation by BC and BrC using the two-component model (eq 6), and the right panels show the percent contribution of BC and BrC to total attenuation at each wavelength. The diesel sample was collected from the exhaust of a diesel generator under idling conditions, and the pine cone, peat, and pine needle smoke samples were collected in a chamber experiment from their diluted combustion plumes (Chow et al. Citation2015). Error bars represent uncertainties derived from replicate analyses and lower quantifiable limits.
summarizes the AAE, bATN, and BrC contributions to light attenuation at 635 nm for source and source-dominated samples. Three AAEs are compared for (1) least squares power-law fit through all 7 λs (eq 4); (2) λ ratios at 405 and 980 nm (eq 3); and (3) λ ratios at 405 and 635 nm (eq 3). The AAEs by the 2-λ (405 and 980 nm) method differ from the 7-λ method by <12%. The AAEs by the 2-λ (405 and 635 nm) differ from the 7-λ fit by ~15% for flaming-dominated samples, but by as much as 50% for smoldering samples. Figure S6 compares the three methods for a prescribed burning sample. The data points below and above 635 nm have different power-law relationships, with AAEs ranging from 2.16 to 2.94, indicating deviations from the simple power-law model.
Table 1. Summary of absorption Ångström exponents (AAEs) calculated by different methods along with light attenuation coefficients (bATN) and contributions of BrC to attenuation (percent bATN_BrC) at 635 nm for the 16 source and source-dominated samples.
Andreae and Gelencser (Citation2006) observed that although the power-law relationship was adequate to describe the spectral dependence of absorption for atmospheric aerosols, there is no theoretical justification for this relationship. The fact that many source and ambient samples deviate from the power-law relationship warrants further investigation of using AAE to describe aerosol spectral light attenuation (Lack and Langridge Citation2013). For this study, the AAEs derived from the 2-λ (405 and 635 nm) method are used to represent the power-law dependence because it fits better at the shorter wavelengths, the region where BrC strongly absorbs light. The AAE serves as an indicator of higher light attenuation at shorter wavelengths than that caused by BC (AAE ≈ 1). AAE is not used to derive the contributions of BC and BrC to light attenuation, which is based on the two-component model (eq 6). The differences in AAEs and BrC contributions to attenuation are indicative of source contributions. For diesel exhaust, the AAEs are close to 1 and the BrC contribution to attenuation is negligible. The smoldering pine cone and peat samples have higher AAEs (>3), with BrC contributing >70% of the attenuation at 635 nm. In contrast, the flaming pine needle samples have AAEs close to 1, with minor BrC contributions to 635 nm attenuation. Samples with mixed smoldering and flaming have AAEs and BrC contributions between the two extremes, depending on the fuels, combustion, and aging conditions.
Comparison of BC, BrC, and AAEs for IMPROVE and CSN samples
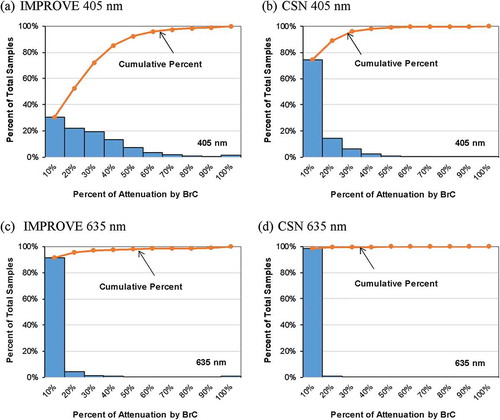
Using the two-component model (eq 6) to separate BC and BrC contributions to light attenuation, shows that urban CSN samples exhibit a distinct annual pattern, with the lowest BrC contributions in summer (June, July, and August) and highest in winter (December, January, and February). The wintertime BrC at urban CSN sites probably results from residential wood combustion. The IMPROVE sites show the highest BrC percent contribution in December and lowest in June. Although more data exploration is necessary, the network differences indicate more influence from wildland fires and aged aerosols (including SOAs) for IMPROVE samples. There is growing evidence of nighttime SOA formation aloft during winter (Young et al. Citation2016) that may affect nonurban concentrations. shows the wavelength dependency of network-averaged percent BrC contributions to light attenuation for IMPROVE and CSN. As expected, both networks show a steep increase in the BrC influence as wavelength decreases. This is due to the enhanced light attenuation of BrC at shorter wavelengths. The 12-month average attenuation due to BrC at 405 nm is 6.7% for CSN and 21.9% for IMPROVE. At all wavelengths, IMPROVE samples have higher fractional BrC contributions than CSN, consistent with higher contributions from biomass burning and SOAs at nonurban sites, and larger primary BC contributions from traffic at urban sites. shows the frequency distribution of percent attenuation from BrC at 405 and 635 nm. For IMPROVE, 69.4% and 8.6% of total samples have >10% attenuation contributed by BrC at 405 and 635 nm, respectively, whereas the corresponding percentages are 25.5% and 1.4% for CSN. Although these percentages have uncertainties from measurement and apportionment, the fact that <10% of the samples have >10% BrC attenuation contributions at 635 nm indicates that the 635 nm absorption measurement is a fair indicator of BC.
Figure 5. Monthly average percentage of total filter light attenuation by BrC. The IMPROVE averages exclude the network’s six urban sites and the CSN samples exclude collocated samples for the 2016 data (number of samples included in each monthly average are shown in Table S1).
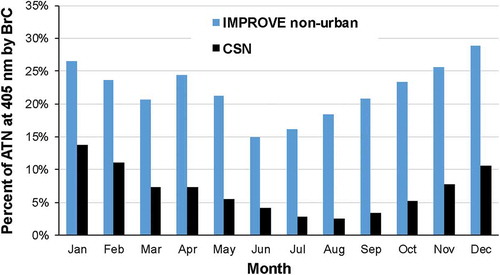
Figure 6. Network-averaged percent attenuation of BrC contribution to light attenuation at different wavelengths for the 2016 IMPROVE and CSN samples. The wavelength ratios at 405 and 635 nm are used to derive the power-law fit of bATN.
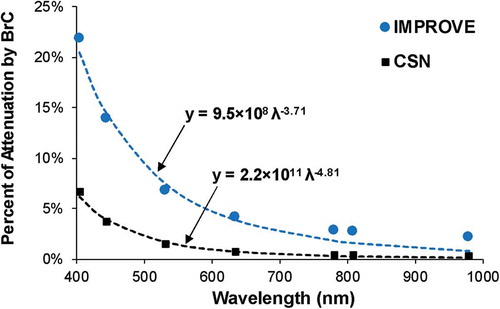
Figure 7. Frequency distributions as a function of percent attenuation by BrC at (a) 405 nm for IMPROVE, (b) 405 nm for CSN, (c) 635 nm for IMPROVE, and (d) 635 nm for CSN.
Monthly network-averaged AAEs (derived from the wavelength ratios at 405 and 635 nm; eq 3) for the two networks are shown in Figure S7. Monthly AAE variations for the CSN samples, in the range of 1.0–1.3, is consistent with the dominance of light attenuation by BC with influence by BrC at shorter wavelengths. Higher AAEs (1.8–2.3) for the IMPROVE samples support the concept of increased relative contributions from biomass burning and aged aerosols in rural environments.
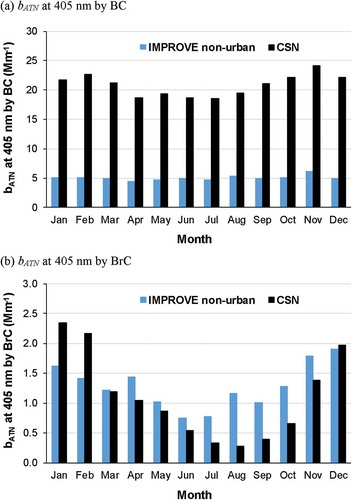
Monthly average bATN at 405 nm by BC (eq 6) in shows that BC light attenuation is about 4 times as high at the CSN sites compared with the nonurban IMPROVE sites. Both networks have little variation in BC bATN over the annual cycle. shows a sharp decrease in bATN by BrC for CSN samples from winter to summer, indicative of residential wood combustion during wintertime. The bATN by BrC for IMPROVE samples show a similar pattern, although to a lesser degree. This pattern does not agree with the wildfire pattern shown in Figure S8 (National Oceanic and Atmospheric Administration [NOAA] 2017), indicating that wildfire emission records are not sufficient to determine burning influences at IMPROVE and CSN sites. The much higher total light attenuation for the CSN network is mainly due to increased BC, largely contributed by mobile sources, compared with IMPROVE.
Figure 8. Monthly average bATN values at 405 nm by (a) BC and (b) BrC for IMPROVE and CSN networks (number of samples included in each monthly average are shown in Table S1).
Temporal variations of BC and BrC at urban versus nonurban sites
Two examples of nearby urban CSN and nonurban IMPROVE time series were examined. These types of comparisons can be made at other urban versus nonurban or rural sites for areas with potential contributions from residential wood combustion, wildfires, and SOAs. Such analyses could be of use for excluding high PM2.5 levels owing to exceptional events (EPA Citation2011) and for determining natural visibility conditions related to the Regional Haze Rule (EPA Citation2003).
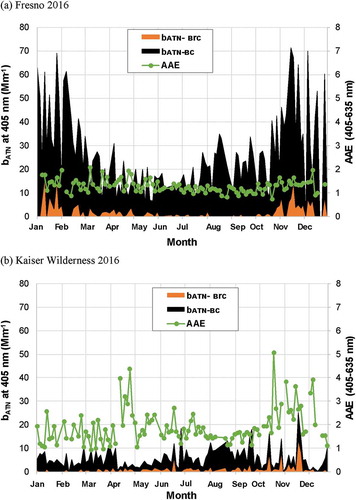
Fresno and Kaiser Wilderness, California
The Fresno CSN site is located in California’s Central Valley at an elevation of 96 m above mean sea level (MSL). Particulate air pollution has been studied extensively in Fresno and California’s San Joaquin Valley (Reynolds et al. Citation2012). The Kaiser Wilderness IMPROVE site is in the Sierra Nevada mountain range at 2598 m above MSL and is 73 km northeast of the Fresno site. At the Fresno site (), both BC and BrC peak in the winter and AAEs are close to 1 during most of the year except for winter. At the Kaiser Wilderness site (), both BC and BrC are higher from spring through fall. Average AAEs are near 2 for much of the year and show some peaks in April and October. The October peaks may be due to smoke from a 2100-acre wildfire that started 36 km south of the Kaiser site on (month/day/year) 10/11/2016. An increased fraction of BrC is also apparent from October through November.
Figure 9. Time series of bATN at 405 nm by BC and BrC along with AAEs at (a) Fresno and (b) Kaiser Wilderness, California.
Bronx, New York; and Mohawk Mountain, Connecticut
The Bronx CSN site is compared with the Mohawk Mountain IMPROVE site located 123 km northeast of the Bronx site at 505 m above MSL. Neither site in shows distinct seasonal patterns in BC or BrC. The Mohawk Mountain site shows higher fractional contributions from BrC to bATN at 405 nm than does the Bronx site (22% vs. 0.8%). The Mohawk Mountain site also shows higher average AAEs than the Bronx site (1.8 vs. 0.91). Whereas BrC contributions are apparent from November to February at Fresno (), BrC is detected at the Bronx site () occasionally in April to May. BrC levels at the Mohawk Mountain site () are also more apparent throughout the year as compared with those found at the Kaiser Wilderness site ().
Figure 10. Time series of bATN at 405 nm by BC and BrC along with AAEs at (a) Bronx, New York; and (b) Mohawk Mountain, Connecticut.
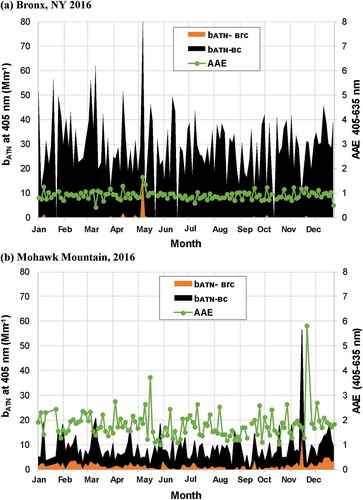
A long-lasting brush fire (named the Flat Rock fire), mostly spreading at ground level, affected the forest near Mohawk Mountain during the fall of 2016 (Hladky Citation2016). Large spikes in attenuation from BC and BrC were observed on 11/14/2016, when fire crews back burned 100 acres. The 24-hr average OC concentration was 20.66 μg/m3, whereas the hourly PM2.5 concentrations from a beta-attenuation monitor reached 230 μg/m3, and hourly carbon monoxide (CO) levels spiked. These data indicate that the 11/14/2016, peak in bATN () was due to a wildfire, and the long-lasting nature of the fire may have contributed to other less extreme rises in bATN during fall 2016 at the Mohawk Mountain site.
Evolution of a wildfire event
The Long Pine Key wildfire in the Everglades National Park was discovered on 4/10/2016, and was 100% contained on 4/17/2016, with a burned area of ~3800 acres (National Park Service [NPS] Citation2017). The IMPROVE Everglades site is located within the fire perimeter, and the filter samples captured the influence of the wildfire. shows time series of OC and EC concentrations, as well as the variations in bATN and AAE, over the period of 3/22/2016–6/20/2016. The spectral light attenuation and BC and BrC contributions for three filter samples collected before, during, and after the fire at the IMPROVE Everglades site are shown in . Before the fire, OC and EC concentrations were low, and light attenuation was dominated by BC, with AAE close to 1.5. shows that the filter collected on 3/31/2016, before the fire was lightly loaded with OC and EC concentrations of 0.4 and 0.01 µg/m3, respectively. Increased levels of OC and EC, as well as bATN, were observed on 4/6/2016 (before the fire was reported on 4/10/2016) and possibly related to the starting of the fire ().
Figure 11. Time series of (a) OC and EC concentrations and (b) light attenuation by BC and BrC along with AAEs at the Everglades National Park IMPROVE site during 3/22/2016–6/20/2016, including the Long Pine Key wildfire period of 4/10/2016–4/17/2016. The inset in panel a shows the same OC and EC data with y-axis zoomed to show lower concentrations.
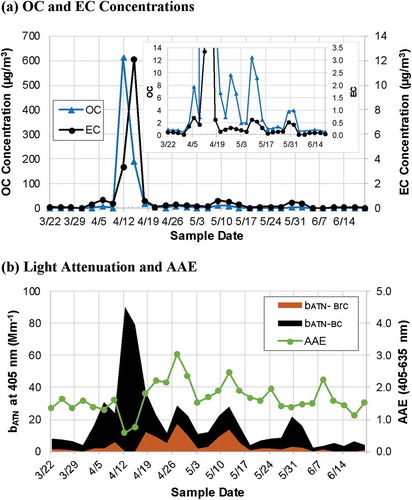
Figure 12. Spectral light attenuation contributions from BC and BrC before (a and b), during (c and d), and after (e and f) the Long Pine Key wildfire in the Everglades National Park. The left panels depict the decomposition of total light absorption by BC and BrC using the two-component model, and the right panels show the percent contributions of BC and BrC to total attenuation at each wavelength. The corresponding filter samples (one or two punches removed for carbon analysis) are also shown. Error bars represent uncertainties derived from replicate analyses and lower quantifiable limits.
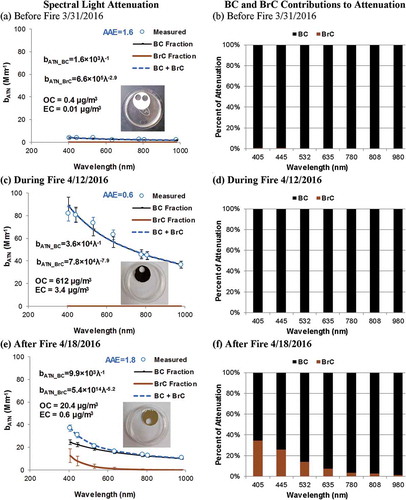
During the fire, OC and EC concentrations and bATN increased by over an order of magnitude. For the sample collected on 4/12/2016 (, ), the OC and EC concentrations were 612 and 3.4 µg/m3, respectively. The power-law did not fit the spectral attenuation curve well, likely due to filter loading effects particularly at shorter wavelengths, resulting in an underestimated AAE of 0.6. The attenuation was dominated by BC with some BrC contributions, as indicated by the black particle deposit with a yellow edge on the filter. The fire was likely in flaming phase during that period, similar to that collected from the laboratory chamber experiment (shown in , ).
After the fire was contained on 4/17/2016, OC and EC concentrations as well as bATN decreased. The sample collected on 4/18/2016 (, ) showed OC and EC concentrations of 20.4 and 0.6 µg/m3, respectively. The AAE was 1.8 and BrC contributions were 34% of the total attenuation at 405 nm. The heavy loading and dark yellow color of the filter deposit indicate that there was still smoldering smoke in the area even though the fire was considered to be contained. OC and EC concentrations (inset of ) as well as bATN by BC and BrC () remained higher than the pre-fire levels for over a month until early June. The AAEs and BrC contributions to light attenuation at 405 nm were higher right after containment of the fire (4/17/2016) and gradually decreased, indicating decreasing level of smoldering smoke. This case study illustrates the application of wavelength-dependent attenuation and variations in AAEs, in addition to OC and EC concentrations, in revealing the evolution of the impacts of biomass burning smoke on PM2.5 composition and optical properties.
Conclusion
The replacement of the DRI model 2001 with model 2015 multiwavelength thermal/optical analyzers results in continuity of the long-term OC and EC database, but it adds additional optical information to infer pollution sources. The value of multiwavelength light attenuation through the quartz-fiber filter samples demonstrates that BC can be separated from BrC, with subsequent attribution to known sources such as biomass burning and secondary organic aerosols. Source and source-dominated samples show distinct differences in AAE and BrC contributions to light attenuation. Replicate analyses of the 2016 IMPROVE and CSN samples show agreement for the total carbon (TC), OC, EC, all of the OC fractions, and EC1. High-temperature EC2 was less than detection limits for many samples, consistent with reductions in diesel emissions, which dominated the EC2 fraction in the past. High correlations of attenuation by different instruments in replicate analyses demonstrate high precision in attenuation measurement.
There is evidence of filter loading effects based on the ratio of light attenuation to EC for the 25% of all samples with the highest EC concentrations, and loading corrections similar to those used for the seven-wavelength aethalometer need to be investigated and applied. These high loadings are most evident at the urban sites that normally experience higher BC concentrations.
The simple exponential power law does not provide a good least squares fit to the seven wavelengths, indicating that the AAE is insufficient to define the shape of the attenuation versus wavelength curve. The AAEs by the 2-λ (405 and 635 nm) ratio method differed from the 7-λ least squares fit by ~15% for flaming-dominated samples, but by as much as 50% for smoldering samples. It may be that the shape of the transmittance attenuation curve contains more information about the sources than is available from the constant AAE assumption.
On average, nonurban IMPROVE samples show higher BrC fraction absorption than urban CSN samples, owing to greater influence from biomass burning and aged aerosols, as well as to higher primary BC contributions from engine exhaust at urban sites. Sequential samples taken during an Everglades National Park wildfire demonstrate the evolution from flaming to smoldering, with the BrC fraction increasing as smoldering begins to dominate the fire event.
Pairing of urban with nearby nonurban samples holds the possibility of separating local from regional events related to OC and EC concentrations, especially for biomass burning and secondary aerosol formation. Such information would be useful for determining if high PM2.5 concentrations are due to exceptional events that can be excluded from attainment designations. As the multiwavelength data become available over the coming years, separate trends can be established for engine exhaust and biomass burning. These data should prove useful for estimating natural visibility conditions during naturally occurring wildfires.
Supplemental Information for Separation of Brown Carbon from Black Carbon for IMPROVE and CSN PM2.5 samples
Download PDF (304.4 KB)Supplemental Document
Download PDF (651.2 KB)Supplemental data for this paper can be accessed on the publisher’s website.
Additional information
Funding
Notes on contributors
Judith C. Chow
Judith C. Chow is a research professor who holds the Ansari Chair in Entrepreneurialism and Science at the Desert Research Institute.
John G. Watson
John G. Watson is a research professor at the Desert Research Institute.
Mark C. Green
Mark C. Green is a research professor at the Desert Research Institute.
Xiaoliang Wang
Xiaoliang Wang is a research professor at the Desert Research Institute.
L.-W. Antony Chen
L.-W. Antony Chen is an assistant professor at the University of Nevada, Las Vegas.
Dana L. Trimble
Dana L. Trimble is an associate research scientist at the Desert Research Institute.
Paul M. Cropper
Paul M. Cropper is a postdoctoral fellow at the Desert Research Institute.
Steven D. Kohl
Steven D. Kohl is an associate research chemist at the Desert Research Institute.
Steven B. Gronstal
Steven B. Gronstal is a doctoral candidate at the Desert Research Institute and the University of Nevada, Reno.
Related Research Data
References
- Akhter, M. S., A. R. Chughtai, and D. M. Smith. 1985. The structure of hexane soot I. Spectroscopic studies. Applied Spectroscopy 39:143–53. doi:10.1366/0003702854249114.
- Andreae, M. O., and A. Gelencser. 2006. Black carbon or brown carbon? The nature of light-absorbing carbonaceous aerosols. Atmospheric Chemistry and Physics 6:3131–48. doi:10.5194/acp-6-3131-2006.
- Arnott, W. P., K. Hamasha, H. Moosmüller, P. J. Sheridan, and J. A. Ogren. 2005. Towards aerosol light-absorption measurements with a 7-wavelength aethalometer: Evaluation with a photoacoustic instrument and 3-wavelength nephelometer. Aerosol Science and Technology 39:17–29. doi:10.1080/027868290901972.
- Bevington, P. R. 1969. Data reduction and error analysis for the physical sciences. New York, NY: McGraw Hill.
- Bond, T. C. 2001. Spectral dependence of visible light absorption by carbonaceous particles emitted from coal combustion. Geophysical Research Letters 28:4075–78. doi:10.1029/2001GL013652.
- Chakrabarty, R. K., S. Pervez, J. C. Chow, S. Dewangan, J. A. Robles, G. X. Tian, and J. G. Watson. 2014. Funeral pyres in south Asia: Large-scale brown carbon emissions and associated warming. Environmental Science and Technology Letters 1:44–48. doi:10.1021/ez4000669.
- Chen, L.-W. A., J. C. Chow, X. L. Wang, J. A. Robles, B. J. Sumlin, D. H. Lowenthal, R. Zimmermann, and J. G. Watson. 2015. Multi-wavelength optical measurement to enhance thermal/optical analysis for carbonaceous aerosol. Atmospheric Measurement Techniques 8:451–61. doi:10.5194/amt-8-451-2015.
- Chen, L.-W. A., J. C. Chow, J. G. Watson, and B. A. Schichtel. 2012. Consistency of long-term elemental carbon trends from thermal and optical measurements in the IMPROVE network. Atmospheric Measurement Techniques 5:2329–38. doi:10.5194/amt-5-2329-2012.
- Chow, J. C., X. L. Wang, B. J. Sumlin, S. B. Gronstal, L.-W. A. Chen, D. L. Trimble, S. D. Kohl, S. R. Mayorga, G. M. Riggio, P. R. Hurbain, et al. 2015. Optical calibration and equivalence of a multiwavelength thermal/optical carbon analyzer. Aerosol and Air Quality Research 15:1145–59. doi:10.4209/aaqr.2015.02.0106.
- Chow, J. C., J. G. Watson, L.-W. A. Chen, W. P. Arnott, H. Moosmüller, and K. K. Fung. 2004. Equivalence of elemental carbon by Thermal/Optical Reflectance and Transmittance with different temperature protocols. Environmental Science and Technology 38:4414–22. doi:10.1021/es034936u.
- Chow, J. C., J. G. Watson, L.-W. A. Chen, M.-C. O. Chang, N. F. Robinson, D. L. Trimble, and S. D. Kohl. 2007. The IMPROVE: A temperature protocol for thermal/optical carbon analysis: Maintaining consistency with a long-term database. Journal of the Air and Waste Management Association 57:1014–23. doi:10.3155/1047-3289.57.9.1014.
- Chow, J. C., J. G. Watson, M. C. Green, and N. H. Frank. 2010. Filter light attenuation as a surrogate for elemental carbon. Journal of the Air and Waste Management Association 60:1365–75. doi:10.3155/1047-3289.60.11.1365.
- Chow, J. C., J. G. Watson, L. C. Pritchett, W. R. Pierson, C. A. Frazier, and R. G. Purcell. 1993. The DRI Thermal/Optical Reflectance carbon analysis system: Description, evaluation and applications in U.S. air quality studies. Atmospheric Environment. Part A. General Topics 27A:1185–201. doi:10.1016/0960-1686(93)90245-T.
- Chow, J. C., J. G. Watson, J. Robles, X. L. Wang, L.-W. A. Chen, D. L. Trimble, S. D. Kohl, R. J. Tropp, and K. K. Fung. 2011. Quality assurance and quality control for thermal/optical analysis of aerosol samples for organic and elemental carbon. Analytical and Bioanalytical Chemistry 401:3141–52. doi:10.1007/s00216-011-5103-3.
- Drinovec, L., G. Močnik, P. Zotter, A. S. H. Prévôt, C. Ruckstuhl, E. Coz, M. Rupakheti, J. Sciare, T. Müller, A. Wiedensohler, and A. D. A. Hansen. 2015. The “dual-spot” aethalometer: An improved measurement of aerosol black carbon with real-time loading compensation. Atmospheric Measurement Techniques 8:1965–79. doi:10.5194/amt-8-1965-2015.
- Eklund, A. G., J. C. Chow, D. S. Greenbaum, G. M. Hidy, M. T. Kleinman, J. G. Watson, and R. E. Wyzga. 2014. Public health and components of particulate matter: The changing assessment of black carbon-Critical review discussion. Journal of the Air and Waste Management Association 64:1221–31. doi:10.1080/10962247.2014.960218.
- Favez, O., I. El Haddad, C. Piot, A. Boréave, E. Abidi, N. Marchand, J.-L. Jaffrezo, J.-L. Besombes, M.-B. Personnaz, J. Sciare, H. Wortham, C. George, and B. D’Anna. 2010. Intercomparison of source apportionment models for the estimation of wood burning aerosols during wintertime in an Alpine city (Grenoble, France). Atmospheric Chemistry and Physics 10:5295–314. doi:10.5194/acp-10-5295-2010.
- Fiore, A. M., V. Naik, and E. M. Leibensperger. 2015. Critical review: Air quality and climate connections. Journal of the Air and Waste Management Association 65:645–85. doi:10.1080/10962247.2015.1040526.
- Grahame, T. J., R. J. Klemm, and R. B. Schlesinger. 2014. Public health and components of particulate matter: The changing assessment of black carbon: Critical Review. Journal of the Air and Waste Management Association 64:620–60. doi:10.1080/10962247.2014.912692.
- Gyawali, M., W. P. Arnott, K. Lewis, and H. Moosmüller. 2009. In situ aerosol optics in Reno, NV, USA during and after the summer 2008 California wildfires and the influence of absorbing and non-absorbing organic coatings on spectral light absorption. Atmospheric Chemistry and Physics 9:8007–15. doi:10.5194/acp-9-8007-2009.
- Hadley, O. L., C. E. Corrigan, and T. W. Kirchstetter. 2008. Modified thermal-optical analysis using spectral absorption selectivity to distinguish black carbon from pyrolized organic carbon. Environmental Science and Technology 42:8459–64. doi:10.1021/es800448n.
- Hand, J. L., B. A. Schichtel, W. C. Malm, S. Copeland, J. V. Molenar, N. H. Frank, and M. L. Pitchford. 2014. Widespread reductions in haze across the United States from the early 1990s through 2011. Atmospheric Environment 94:671–79. doi:10.1016/j.atmosenv.2014.05.062.
- Hladky, G. B. 2016. Slow-burning forest fire in Cornwall continues to smolder across bone-dry woodlands. Hartford, CT: Hartford Courant. http://www.courant.com/news/connecticut/hc-ct-forest-fire-update-20161114-story.html. (accessed July 31, 2017).
- Huntzicker, J. J., R. L. Johnson, J. J. Shah, and R. A. Cary. 1982. Analysis of organic and elemental carbon in ambient aerosols by a thermal-optical method. In Particulate carbon: Atmospheric life cycle, ed. G. T. Wolff and R. L. Klimisch, 79–88. New York, NY: Plenum Press.
- Jimenez, J., C. S. Claiborn, T. Larson, T. Gould, T. W. Kirchstetter, and L. Gundel. 2007. Loading effect correction for real-time aethalometer measurements of fresh diesel soot. Journal of the Air and Waste Management Association 57:868–73. doi:10.3155/1047-3289.57.7.868.
- Kirchstetter, T. W., T. Novakov, and P. V. Hobbs. 2004. Evidence that the spectral dependence of light absorption by aerosols is affected by organic carbon. Journal of Geophysical Research: Atmospheres 109:D21208. doi:10.1029/2004JD004999.
- Lack, D. A., R. Bahreni, J. M. Langridge, J. B. Gilman, and A. M. Middlebrook. 2013. Brown carbon absorption linked to organic mass tracers in biomass burning particles. Atmospheric Chemistry and Physics 13:2415–22. doi:10.5194/acp-13-2415-2013.
- Lack, D. A., and J. M. Langridge. 2013. On the attribution of black and brown carbon light absorption using the Angstrom exponent. Atmospheric Chemistry and Physics 13:10535–43. doi:10.5194/acp-13-10535-2013.
- Laskin, A., J. Laskin, and S. A. Nizkorodov. 2015. Chemistry of atmospheric brown carbon. Chemical Reviews 115:4335–82. doi:10.1021/cr5006167.
- Laskin, J., A. Laskin, S. A. Nizkorodov, P. Roach, P. Eckert, M. K. Gilles, B. B. Wang, H. J. Lee, and Q. C. Hu. 2014. Molecular selectivity of brown carbon chromophores. Environmental Science and Technology 48:12047–55. doi:10.1021/es503432r.
- Lin, Y. H., S. H. Budisulistiorini, K. Chu, R. A. Siejack, H. Zhang, M. Riva, Z. Zhang, A. Gold, K. E. Kautzman, and J. D. Surratt. 2014. Light-absorbing oligomer formation in secondary organic aerosol from reactive uptake of isoprene epoxydiols. Environmental Science and Technology 48:12012–21. doi:10.1021/es503142b.
- Liu, D., J. Allan, B. Corris, M. Flynn, E. Andrews, J. Ogren, K. Beswick, K. Bower, R. Burgess, T. Choularton, J. Dorsey, W. Morgan, P. I. Williams, and H. Coe. 2011. Carbonaceous aerosols contributed by traffic and solid fuel burning at a polluted rural site in Northwestern England. Atmospheric Chemistry and Physics 11:1603–19. doi:10.5194/acp-11-1603-2011.
- Malamakal, T., L.-W. A. Chen, X. L. Wang, M. C. Green, S. Gronstal, J. C. Chow, and J. G. Watson. 2013. Prescribed burn smoke impact in the Lake Tahoe Basin: Model simulation and field verification. International Journal of Environment and Pollution 52:225–43. doi:10.1504/IJEP.2013.058457.
- Malm, W. C. 2016. Visibility: The seeing of near and distant landscape features. Amsterdam, The Netherlands: Elsevier.
- Massabo, D., L. Caponi, V. Bernardoni, M. C. Bove, P. Brotto, G. Calzolai, F. Cassola, M. Chiari, M. E. Fedi, P. Fermo, M. Giannoni, F. Lucarelli, S. Nava, A. Piazzalunga, G. Valli, R. Vecchi, and P. Prati. 2015. Multi-wavelength optical determination of black and brown carbon in atmospheric aerosols. Atmospheric Environment 108:1–12. doi:10.1016/j.atmosenv.2015.02.058.
- Moise, T., J. M. Flores, and Y. Rudich. 2015. Optical properties of secondary organic aerosols and their changes by chemical processes. Chemical Reviews 115:4400–39. doi:10.1021/cr5005259.
- Moosmüller, H., and W. P. Arnott. 2009. Particle optics in the Rayleigh regime. Journal of the Air and Waste Management Association 59:1028–31. doi:10.3155/1047-3289.59.9.1028.
- Moosmüller, H., R. K. Chakrabarty, and W. P. Arnott. 2009. Aerosol light absorption and its measurement: A review. Journal of Quantitative Spectroscopy and Radiative Transfer 110:844–78. doi:10.1016/j.jqsrt.2009.02.035.
- Murphy, D. M., J. C. Chow, E. M. Leibensperger, W. C. Malm, M. L. Pitchford, B. A. Schichtel, J. G. Watson, and W. H. White. 2011. Decreases in elemental carbon and fine particle mass in the United States. Atmospheric Chemistry and Physics 11:4679–86. doi:10.5194/acp-11-4679-2011. National Oceanic and Atmospheric Administration. 2017. U.S. wildfires. Asheville, NC: National Oceanic and Atmospheric Administration. https://www.ncdc.noaa.gov/societal-impacts/wildfires/month/0?params[]=acres¶ms[]=fires. (accessed July 31, 2017).
- National Park Service. 2017. Everglades National Park: Current fire activity. Washington, DC: National Park Service. https://www.nps.gov/ever/learn/management/currentfireactivities.htm. (accessed July 31, 2017).
- Navarro, K. M., R. Cisneros, S. M. O’Neill, D. Schweizer, N. K. Larkin, and J. R. Balmes. 2016. Air-quality impacts and intake fraction of PM2.5 during the 2013 Rim megafire. Environmental Science and Technology 50:11965–73. doi:10.1021/acs.est.6602252.
- Park, S. S., and S. C. Son. 2017. Relationship between carbonaceous components and aerosol light absorption during winter at an urban site of Gwangju, Korea. Atmospheric Research 185:73–83. doi:10.1016/j.atmosres.2016.11.005.
- Rehman, I. H., T. Ahmed, P. S. Praveen, A. Kar, and V. Ramanathan. 2011. Black carbon emissions from biomass and fossil fuels in rural India. Atmospheric Chemistry and Physics 11:7289–99. doi:10.5194/acp-11-7289-2011.
- Reynolds, S., C. L. Blanchard, D. E. Lehrman, S. Reid, R. A. Harley, M. Kleeman, T. E. Stoeckenius, R. Morris, J. G. Watson, and J. C. Chow. 2012. Synthesis of CCOS and CRPAQS study findings. Fresno, CA: San Joaquin Valley Unified Air Pollution Control District. https://www.researchgate.net/publication/316170523_Synthesis_of_CCOS_and_CRPAQS_study_findings. (accessed July 31, 2017).
- Sandradewi, J., A. S. H. Prevot, S. Szidat, N. Perron, M. R. Alfarra, V. A. Lanz, E. Weingartner, and U. Baltensperger. 2008. Using aerosol light absorption measurements for the quantitative determination of wood burning and traffic emission contributions to particulate matter. Environmental Science and Technology 42:3316–23. doi:10.1021/es702253m.
- Sciare, J., O. D’ Argouges, R. Sarda-Esteve, C. Gaimoz, C. Dolgorouky, N. Bonnaire, O. Favez, B. Bonsang, and V. Gros. 2011. Large contribution of water-insoluble secondary organic aerosols in the region of Paris (France) during wintertime. Journal of Geophysical Research: Atmospheres 116:D22203. doi:10.1029/2011JD015756.
- Slikboer, S., L. Grandy, S. L. Blair, S. A. Nizkorodov, R. W. Smith, and H. A. Al-Abadleh. 2015. Formation of light absorbing soluble secondary organics and insoluble polymeric particles from the dark reaction of catechol and guaiacol with Fe(III). Environmental Science and Technology 49:7793–801. doi:10.1021/acs.est.5b01032.
- Solomon, P. A., D. Crumpler, J. B. Flanagan, R. K. M. Jayanty, E. E. Rickman, and C. E. McDade. 2014. US national PM2.5 chemical speciation monitoring networks-CSN and IMPROVE: Description of networks. Journal of the Air and Waste Management Association 64:1410–38. doi:10.1080/10962247.2014.956904.
- Sreekanth, V., K. Niranjan, and B. L. Madhavan. 2007. Radiative forcing of black carbon over eastern India. Geophysical Research Letters 34:L17818. doi:10.1029/2007GL030377.
- U.S. Environmental Protection Agency. 2003. Guidance for estimating natural visibility conditions under the regional haze program. Research Triangle Park, NC: U.S. Environmental Protection Agency.
- U.S. Environmental Protection Agency. 2011. Treatment of data influenced by exceptional events. Research Triangle Park, NC: U.S. Environmental Protection Agency. http://www.epa.gov/ttn/analysis/exevents.htm. (accessed July 31, 2017).
- U.S. Environmental Protection Agency. 2012. Report to congress on black carbon. Washington, DC: U.S. Environmental Protection Agency. http://www.epa.gov/blackcarbon. (accessed July 31, 2017).
- Utry, N., T. Ajtai, A. Filep, M. D. Pinter, A. Hoffer, Z. Bozoki, and G. Szabo. 2013. Mass specific optical absorption coefficient of HULIS aerosol measured by a four-wavelength photoacoustic spectrometer at NIR, VIS and UV wavelengths. Atmospheric Environment 69:321–24. doi:10.1016/j.atmosenv.2013.01.003.
- Virkkula, A., T. Makela, R. Hillamo, and T. Yli-Tuomi. 2007. A simple procedure for correcting loading effects of aethalometer data. Journal of the Air and Waste Management Association 57:1214–22. doi:10.3155/1047-3289.57.10.1214.
- Wang, X. L., A. Khlystov, K. F. Ho, D. Campbell, J. C. Chow, S. D. Kohl, J. G. Watson, S. C. Lee, L.-W. A. Chen, M. G. Lu, et al. 2017. Real-world vehicle emission characterization for the Shing Mun tunnel in Hong Kong and Ft. McHenry Tunnel in the U.S. Reno, NV: Desert Research Institute, for the Health Effects Institute, for the Health Effects Institute.
- Watson, J. G. 2002. Visibility: Science and regulation—2002 Critical review. Journal of the Air and Waste Management Association 52:628–713. doi:10.1080/10473289.2002.10470813.
- Watson, J. G., J. C. Chow, and L.-W. A. Chen. 2005. Summary of organic and elemental carbon/black carbon analysis methods and intercomparisons. Aerosol and Air Quality Research 5:65–102.
- Watson, J. G., J. C. Chow, L.-W. A. Chen, and N. H. Frank. 2009. Methods to assess carbonaceous aerosol sampling artifacts for IMPROVE and other long-term networks. Journal of the Air and Waste Management Association 59:898–911. doi:10.3155/1047-3289.59.8.898.
- Watson, J. G., J. C. Chow, D. H. Lowenthal, L. C. Pritchett, C. A. Frazier, G. R. Neuroth, and R. Robbins. 1994. Differences in the carbon composition of source profiles for diesel- and gasoline-powered vehicles. Atmospheric Environment 28:2493–505. doi:10.1016/1352-2310(94)90400-6.
- Weingartner, E., H. Saathoff, M. Schnaiter, N. Streit, B. Bitnar, and U. Baltensperger. 2003. Absorption of light by soot particles: Determination of the absorption coefficient by means of aethalometers. Journal of Aerosol Science 34:1445–63. doi:10.1016/S0021-8502(03)00359-8.
- Young, D. E., H. Kim, C. Parworth, S. Zhou, X. L. Zhang, C. D. Cappa, R. Seco, S. Kim, and Q. Zhang. 2016. Influences of emission sources and meteorology on aerosol chemistry in a polluted urban environment: Results from DISCOVER-AQ California. Atmospheric Chemistry and Physics 16:5427–51. doi:10.5194/acp-16-5427-2016.
- Zhao, R., A. K. Y. Lee, L. Huang, X. Li, F. Yang, and J. P. D. Abbatt. 2015. Photochemical processing of aqueous atmospheric brown carbon. Atmospheric Chemistry and Physics 15:6087–100. doi:10.5194/acp-15-6087-2015.
- Zotter, P., H. Herich, M. Gysel, I. El-Haddad, Y. Zhang, G. Močnik, C. Hüglin, U. Baltensperger, S. Szidat, and A. S. H. Prévôt. 2017. Evaluation of the absorption angstrom ngstrom exponents for traffic and wood burning in the aethalometer-based source apportionment using radiocarbon measurements of ambient aerosol. Atmospheric Chemistry and Physics 17:4229–49. doi:10.5194/acp-17-4229-2017.