
ABSTRACT
Air quality can be affected by weather and thus is sensitive to a changing climate. Wildfire (influenced by weather), consecutive high temperature summer days, and other extreme events are projected to become more severe and frequent with climate change. These may create challenging conditions for managing air quality despite policy targets to reduce precursor and pollutant emissions. Although extreme events are becoming more intense and interest in climate adaptation is increasing among public health practitioners, little attention in scholarly literature and policy covers climate adaptation for air quality governance. Understanding the management and managers’ perspectives at the local level provides insight about the needs for climate adaptation, including their adaptation status, perspectives, responsibilities, and roles. This study explores local manager perspectives and experiences of managing air quality within a changing climate as one puzzle piece to understand the gap in climate adaptation within the air quality sector. A broader goal is to contribute to the discussion of developing a multi-jurisdictional vision for reducing the impacts of air quality in a changing climate. In 2016 local air quality district managers in California were invited to participate in an online survey of 39 questions focused on extreme event impacts on air quality. The questionnaire focused on present air quality threats and extreme event challenges, adaptation status and strategies, adaptive capacities, perceived barriers to adaptation, and jurisdictional responsibilities and roles. Over 85 percent of the 35 local air districts in California participated in the survey, which represents 80 percent of the state’s population. High awareness and knowledge of climate change among local managers indicates they are ready to adopt and take action on policies that would support climate adaptation, but barriers reported suggests they may need policies and adequate funding to take action and make necessary changes.
Implications: Downscaled global climate models project an increasing severity and frequency of extreme events. In the southwestern United States, these include wildfire, heat events, and dry periods, among others, all of which can place an extra burden on air quality managers and emitters to achieve air quality standards even as they reduce emissions. Despite climate change presenting increasing challenges to meet air quality standards, in the southwestern United States, policy and action to mitigate these impacts have been surprisingly absent. California presents a valuable case study on the topic because of its historic leadership in air quality management for the United States and also because of its initiatives in combating climate change. Yet still we found that adaptation has not been incorporated into air quality management thus far, but local managers seem sufficiently knowledgeable and willing.
Introduction
Poor air quality threatens public health, and climate change is projected to worsen air quality through several mechanisms (Fann et al. Citation2016; Fiore, Naik, and Leibensperger Citation2015; Jacob and Winner Citation2009; Rasmussen et al. Citation2013; Silva et al. Citation2017). Climate change places an extra burden on air quality managers and emitters, as increasing temperatures, seasonal shifts, extreme events, stagnation cycles, and more sporadic rainfall are expected to make their emission reduction efforts less effective at improving air quality. This has been referred to as the climate penalty (Jacob and Winner Citation2009; Mickley Citation2007; Rasmussen et al. Citation2013). These adverse changes are projected to occur against a backdrop of declining emissions, making the signal difficult to distinguish and thus arguably more socially difficult to mitigate than more visual and direct impacts of climate change. However, if not mitigated, these changes in air quality will have public health implications when communities are exposed to higher pollution levels and more frequent poor air quality episodes. These changes can also result in penalties for regions and states that fail to meet the National Ambient Air Quality Standards (NAAQS).
Adaptation in the air quality sector
Adaptation, preparing for and mitigating the impacts of climate change, in every resource management sector requires multijurisdictional coordination and collaboration (Nalau, Preston, and Maloney Citation2015; NRC Citation2010). We employ the definition of climate adaptation used by the Fifth Assessment Report of the International Panel on Climate Change (IPCC):
The process of adjustment to actual or expected climate and its effects. In human systems, adaptation seeks to moderate or avoid harm or exploit beneficial opportunities. In some natural systems, human intervention may facilitate adjustment to expected climate and its effects. (IPCC 2014, 118, emphasis added)
Adaptation is in clear distinction from climate mitigation, which is the term used to refer to efforts to re-balance the atmospheric greenhouse gas concentrations and thereby limiting climate change. Climate mitigation includes reduction of greenhouse gases, carbon capture, and other related activities. These efforts are a necessary part of any governmental and larger societal effort to reduce climate change impacts from gaining momentum (National Research Council [NRC] 2010).
Air quality management is commonly the lead entity overseeing climate mitigation activities in the United States because of the strong focus on greenhouse gas (GHG) emission reduction efforts. Until a decade ago, there was a social taboo among scientists and policymakers against exploring adaptation because strong supporters of GHG emission reduction argued that adaptation was giving up and lazily accepting climate change for the long term (Piekle et al. Citation2007). More recently, adaptation generally has become more accepted. Society will need both mitigation and adaptation because of the slow progress of mitigation and the physical time delay in which benefits of GHG emission reduction will manifest.
Some attribute any effort that reduces the risk of climate change—through either emission reduction or adaptive interventions—as “adaptation” (Stakhiv Citation1993). However, as noted earlier, for this paper, we are using the IPCC (Citation2014) definition, in which adaptation consists of protective efforts that are taken in direct reaction to projected or actual changing climate. As an example, past NOx control strategies to reduce ozone in Southern California, though effective, were implemented not with justification of preventing climate change impacts, but instead directly related to achieve attainment levels in present time. Therefore, these efforts would not be construed as adaptation, despite the clear co-benefit.
Although extreme events are becoming more intense (Fischer and Knutti Citation2015) and interest in climate adaptation is increasing among public health practitioners (Araos et al. Citation2016), little attention in scientific literature and public policy covers climate adaptation for public health (Hosking and Campbell-Lendrum Citation2012; Verner et al. Citation2016) and even less covers air quality governance. Local or regional government entities, communities, and household residents are commonly assumed to be critical actors in moving adaptation forward, given the tangible, often immediate impacts at the local level (Measham et al. Citation2011; Moser and Pike Citation2015; Næss et al. Citation2005; Nalau, Preston, and Maloney Citation2015). Different responsibilities are needed at different levels of organization (Amundsen, Berglund, and Westskog Citation2010; Armitage Citation2007; Pahl-Wostl Citation2009). Awareness and capacity at the local level can be essential for implementing adaptation strategies. Bottom-up research, gauging the communities and governance systems at the local level, can improve understanding the local-level managers need for adaptation, including their adaptation status, perspectives, responsibilities, and roles (Mastrandrea et al. Citation2010; Radhakrishnan et al. Citation2017). In this paper we explore the local manager perspectives of managing air quality within a changing climate in order to contribute to the broader discussion of developing a multijurisdictional vision for reducing the impacts of air quality in a changing climate.
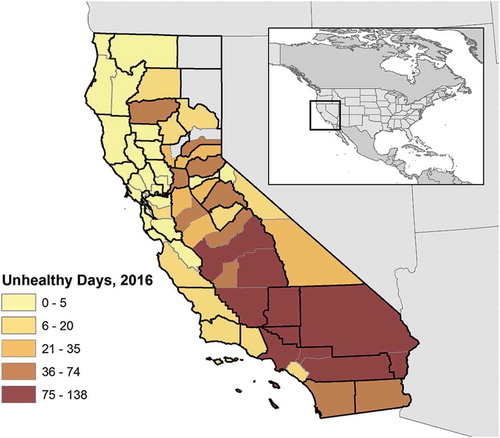
California has been a national leader, not only in addressing greenhouse gas emissions, but also in having historically reduced air pollution problems (Bachman Citation2007). Yet some regions of the state continue to have some of the worst air quality in the country (ALA Citation2017). shows the large number of unhealthy air days experienced in very populous regions of the State.
Figure 1. Number of unhealthy days summed by county in the state of California reported during the year 2016. Air districts outlined in black. Summed days includes those surpassing an Air Quality Index (AQI) score of 100. According to the EPA (Citation2018), “When AQI values are above 100, air quality is considered to be unhealthy—at first for certain sensitive groups of people, then for everyone as AQI values get higher.” AQI values are derived from monitoring records for the major pollutants across the United States. The EPA converts raw measures into an AQI value for each pollutant and then the highest of these values for each location is recorded as that day’s AQI value for that location (EPA Citation2018). Source data: U.S. EPA AQI gathered in July 2017 by authors.
As noted in the preceding, many air quality managers are taking the lead on climate change mitigation through programs and policies to reduce greenhouse gas emissions. However, far less attention has been paid to preparing for the impacts that a changing climate will have on meeting air quality goals. Without adequate adaptation in air quality management, the public could experience higher levels of pollution than anticipated and local air districts could be increasingly penalized as meeting air quality standards becomes more challenging. This raises important questions, including “Who is responsible for adapting to climate change?,” “What are the roles, responsibilities, authorities, and impediments of organizations involved in air quality management?,” and “What are the options for addressing the climate penalty and who will financially support the implementation?”
In order to begin to answer these larger questions, this paper examines experiences and perspectives of local air quality managers. This examination helps to establish a baseline of what type of air quality problems that climate change could worsen across California and how local-level managers are to preparing for these threats, focusing on extreme events. This paper examines these questions using data collected through a survey of California air districts. Bottom-up research, synthesizing information from the managers working at the local level, is useful for documenting attitudes, perspectives, and current challenges, of which policymakers and other stakeholders may not be cognizant (Dilling et al. Citation2017; Timberlake and Schultz Citation2017). Specifically, we examine the following questions:
What are the primary pollutant and extreme event problems across districts?
How have extreme events affected air quality to date?
What challenges do managers perceive as hindering their climate adaptation progress?
What options are available for air districts to avoid or reduce the effects of a changing climate (and meet their standards)? What is the consequence of not meeting these standards?
How do air districts perceive their role in adapting to climate change?
In the following sections we review the current governance structure for air quality management and how climate change is projected to affect air quality. We then examine the perspectives of local air districts, gathered in a survey conducted in 2016.
Air quality planning and climate change
California has been a national leader in air quality regulation and management. The state’s air quality policies began in the 1940s when Los Angeles’s smog became a major problem. California’s air quality challenges cover many regions of the state, though these vary across its diverse geography. The South Coast has a high density of population and thus high transportation emissions, coupled with high temperatures and sunlight exposure creating conditions for ozone development. The Sacramento and San Joaquin Central Valley’s industrial agricultural practices combined with its valley geography and extreme dry heat create conditions for dangerous particulate matter and ozone concentrations. Of the top 10 locations with the poorest air quality in the United States, 5 are in California (American Lung Association [ALA] Citation2017).
The Clean Air Act established the National Ambient Air Quality Standards (NAAQS), which created health-based air quality standards for six pollutants: ozone (O3), particulate matter (PM), carbon monoxide (CO), nitrogen dioxide, sulfur dioxide, and lead. Using data collected through monitoring stations around the country, the U.S. EPA determines whether regions meet the NAAQS for each pollutant. States are the delegated jurisdiction to oversee the air quality, and some states (such as California) have regionally delegated districts to oversee some aspects of air quality more locally. California’s air districts are shown in .
If a region is out of attainment with an air quality standard, the air district is required to develop and adopt a plan to meet the standard. The time allowed for meeting a standard is based on the severity of a region’s air quality problem. Regions with worse air quality are given more time to meet a standard. Failure to meet standards on the regulated timeline can result in penalties or stricter requirements for air districts. Actions to reduce emissions fall under the jurisdiction of air districts, but also state and federal regulators who have authority for certain sectors.
In determining whether a region meets the NAAQS, air districts can invoke the Exceptional Events Rule, which allows them to flag poor air quality events that are attributable to events outside of their control, which do not regularly occur. Examples of such events include volcanic activity, high wind dust storms, stratospheric ozone intrusions, and wildfires. The Exceptional Events Rule allows for districts to flag air quality data affected by extreme events and apply for exclusion of these data so that they are not included in attainment decisions. In cases in which the event meets the federal criteria (“not reasonably controllable or preventable,” and “an event caused by human activity that is unlikely to recur at a particular location or a natural event,” among others), the federal government can approve the exclusion. Thus, the Exceptional Events Rule can provide a reasonable option for districts to avoid penalties for events outside of their control.
As noted in the preceding, California is home to some of the most polluted regions in the country ALA Citation2017). Climate change models show that failure to meet GHG emission reduction targets will result in changes in average conditions, including increasing average temperatures, and an increase in the frequency of extreme events that will have a negative effect on air quality in California. Ozone, because of its relationship to high summer temperatures, is expected to increase in some areas in the face of climate change because of increasing summer temperatures. Winter inversions, which trap pollutants near ground level, are projected to increase with climate change as average winter temperatures increase (Iacobellis et al. Citation2009). Together, these changing climate conditions will reduce the effectiveness of planned emission reductions, which is known as the climate penalty(Rasmussen et al., Citation2013).
Extreme events, in particular, could lead to acute episodes of poor air quality. For example, wildfire modeling projects an increase in the frequency and extent of wildfires in California as a result of increasing temperatures shifting seasons, earlier and reduced snow melt and runoff, and lower soil moisture (Gergel et al. Citation2017; Westerling Citation2016). One potential adaptive action could be that air districts increasingly rely on the application of the Exceptional Events Rule as extreme events occur with greater frequency. This would allow districts to avoid penalties of substandard air quality, but would result in higher community exposures to poor air quality.
Methods
The primary source of data for this analysis is a survey of air districts in California conducted between June 15, 2016, and December 15, 2016. The survey was designed to collect information on how air districts perceive the threat of climate change to air quality, current practices, and the status of adaptation activities (for full questionnaire see Supplemental Information, Appendix A). Analysis of the survey responses and associated interviews provide insight into the awareness, perception, and actions of air districts in the face of current and future conditions. Responses also illuminate barriers and challenges air districts face in preparing for changing climate conditions.
We designed the survey to resemble a similar survey instrument employed to understand extreme event impacts on water quality management in drinking water utilities in California (Ekstrom, Bedsworth, and Fencl Citation2017) and previous local-level resource manager surveys (Bedsworth Citation2009; Finzi-Hart et al. Citation2012; Tribbia and Moser Citation2008). In addition, we tailored survey questions based on informational interviews with air quality managers and reviewing of literature on existing pollutant public health thresholds as they are affected by extreme weather and climatic events. This survey was given exempt status by the Human Subjects Internal Review Board of UC Davis in 2016. We distributed the survey questionnaire online through Qualtrics on June 15, 2016, with a series of three reminders.
California has 35 air districts (). To increase the likelihood of a response to the survey, we invited two people from the state’s larger air districts to respond to the survey. This recommendation was made by a key informant, and the size of a district was determined by the number of employees. As a result, we received duplicate responses from six districts. Where we received more than one response, we selected the survey with the higher completion rate for inclusion in the analysis. If both had the same completion rate, we included the responses from the respondent with a longer tenure with the district. Results are presented with district level as the unit of analysis, in summary form to prevent the disclosure of identifying information. Because of the necessarily small sample size, we generally present response counts instead of percentages.
To assist with analysis of the survey results, we also included district characteristics in our analysis. This included attainment status and demographic characteristics for each district. Attainment status of districts was compiled from the EPA Green Book, using status records by county between the years 2014 through 2016. The documentation of each pollutant’s attainment status was noted on a 0 to 5 ordinal scale (attainment, marginal, moderate, serious, severe, extreme), and we also created a summary table noting the overall status of each district (all pollutants in attainment, some in nonattainment) based on the same EPA Green Book data tables (EPA Citation2017).
Results
In this section we report the response rate, followed by the summarized survey responses either overall or by size and/or attainment status. Additional summary statistics and cross-tabulations of responses and district attributes are provided in Appendix B of the Supplemental Information.
Response rate
Out of the 53 contacts at the 35 air districts in California, completed surveys were received from 36 respondents who met our threshold for inclusion, which was that they answer at least one of the substantive questions (i.e., beyond the basic questions describing the respondent’s experience and the district). Of these 36 responses, 24 were control officers or deputy control officers and 30 respondents had worked in air quality for more than 10 years. Most respondent air districts have 10 or fewer employees and 3 had over 50 employees. After accounting for duplicate responses, we received responses from 30 of the 35 districts, representing 85% of air districts in the state that cover 80% of the state’s population. In terms of attainment status based on the EPA Green Book (Citation2017), 13 of the 30 respondents were from districts in full attainment and 17 were from districts for which some nonattainment was determined. To maintain confidentiality, results are presented by attainment status and size of district based on number of employees. Results highlighting any single district are omitted if they include any identifying attributes.
Current conditions
Air pollutants of concern
When respondents filled in responses to the question “What are the major air pollutants of concern?” the most frequently noted pollutant was particulate matter (22 districts), followed closely by ozone (18 districts) ().
Table 1. Major pollutants reported by respondents from the open-ended question: “What are the major air pollutants of concern?”
To get at the sources of the pollutants, the survey followed with a multiple choice question “What is the biggest source of air pollution in your district?” Options listed included agriculture; refineries; wildfire; dust (suspended particles), transport of pollutants from neighboring regions; other large industrial sources (please specify); and other (please specify). The most frequently selected option was other, of which 10 of the 12 wrote in mobile sources, followed second highest by wildfire and then, third, transport of pollutants from neighboring regions. When asked about the severity of threat each pollutant presents to air districts, 23 district respondents reported ozone as somewhat or more serious of a problem, followed by both PM2.5 and PM10 ().
Table 2. Response summary for the question: “In considering your district’s jurisdiction, how serious of a problem are the following air pollutants?” Pollutant options listed include those shown in the row headers; N = 30 respondents from unique districts.
Weather events that affect air quality—wildfire, drought, inversions
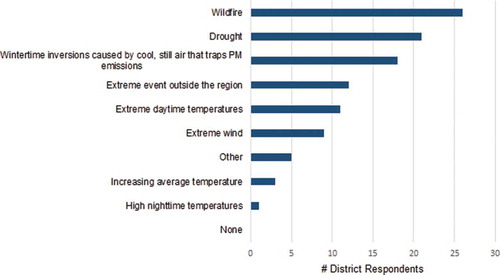
Previous experience with weather-related events that affect air quality in a region can inform how a district might approach impacts from climate change in the future. The top weather-related events noted to affect districts’ air quality were wildfire, drought, and wintertime inversions (). More than 37% (11) reported a dramatic increase to bad air quality alert days during the recent wildfires, and 47% (14) reported a slight increase. All respondents marked at least one weather event as affecting their district’s air, and zero marked the option “None. My district’s air quality is not sensitive to weather or environmental events” (). Other specified options described by respondents included wind (summer winds and wintertime stagnation), water diversions, thunderstorms, and high temperature inversions.
Figure 2. Responses to question about the weather and environmental events that affect the air quality in the respondents’ districts. “Which types of weather or environmental events currently affect your district’s air quality? Select all that apply.”
Air pollutants of concern and extreme event triggers
To examine more specifically how air pollutants are affected by or triggered by weather and other environmental events, the survey asked participants about the severity of air quality issues their district experiences, followed by a question that asked what type of extreme events affect the pollutants they identified as being a “slightly serious problem, somewhat, very serious, or extremely serious” problem. Responses show that wildfire is perceived to be the environmental event that triggers pollutant problems across the most air districts. Twenty-seven air districts reported wildfire as affecting PM2.5 in their districts, followed closely by fire affecting PM10 (24) and ozone (23). Twenty-one indicated that extreme daytime heat is a concern for ozone. Toxics were most frequently reported as not being affected by weather or environmental events ().
Table 3. Response counts to the question “Please indicate which weather or environmental events, if any, worsen or trigger each air quality issue in your district’s jurisdiction. Select all that apply.” The options provided are listed as column headings. Cells contain raw counts of co-occurring responses based on the row count totals; N = 30, but respondents selected all that apply.
Perceptions of risks of climate change
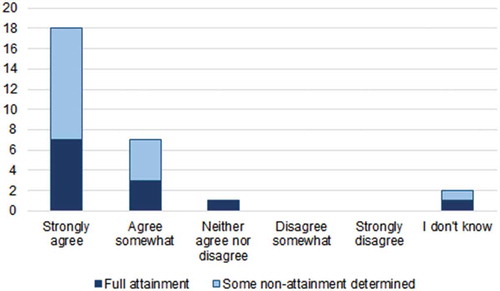
In asking a series of four questions related to the perceptions of climate change and the risks it poses on a local and global level, we found responses fairly consistent across the questions (). The majority “strongly agree” that global climate is changing (18), and just slightly less so that California’s climate is changing (16). No statistically significant relationship existed between the perspectives on climate change and the air district’s attainment status.
Figure 3. Survey respondents’ perceptions and perspectives on climate change based on their reported level of agreement with the following statement: “Climate change poses risks to air quality globally.” Counts based on responses from unique air districts (N = 28), organized by attainment status. “Full attainment” indicates those districts that were in attainment of all pollutant standards for the years 2014 through 2016. “Some non-attainment’ refers to districts that were determined to have nonattainment status for one or more regulated pollutant during the years 2014 and 2016 (based on records from EPA Green Book 2017).
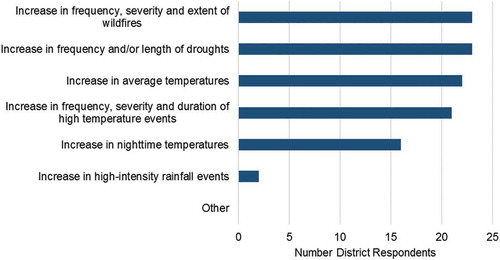
Survey participants were then asked about their perception of future risks from climate change on air quality. Not surprisingly, but still valuable, responses were consistent with risks that are currently identified as affecting air quality. Most frequently reported future risks were increases in background pollutant levels, followed closely by increased transport of pollutants from neighboring jurisdictions (). These results are notable because both risks are beyond the current local control/jurisdiction of the air quality management district and thus rely on governance of the state air resources board and the U.S. EPA.
Figure 4. Responses to the question “Which of the following impacts of climate change do you expect to threaten or improve your district’s air quality and its management in the next 50 years? Select all climate impacts that apply.? Select all that apply.”
As additional indicators of perceptions around the threat of climate change and what management challenges are expected in the future, the survey then asked whether air district managers expect to see an increase in the number of exceptional events. As discussed in the introduction section, in 2007 the EPA developed the Exceptional Event Rule, which allows air districts to request air quality measurements that are affected by extreme events such as wildfire be left out of attainment decisions. The rule was intended to reduce the risk of penalties resulting from nonattainment status for local air districts when catastrophic events beyond their control occur. Many of these are weather and climate related, such as large wildfires and stratospheric ozone intrusions (USEPA 2016). The response to this question of expecting increasing exceptional events in the future signals their perspective about the possible burden that climate change will bring to their work. Of the 19 respondents who answered “yes” they expect an increase in the number of exceptional events in their air district in the future, 13 of them selected climate change as an expected cause, followed by population growth (9) and then changes in land management (7), other (7), and the least common cause noted was development patterns (4). Those who selected “other” wrote in causes associated with wildfires (n = 5), changes in pollutant standards (3), and high wind events (1) ().
Table 4. Responses to the question: “Do you foresee the number of exceptional events that your air district applies for increasing in the future?”
Current capacity
Evaluating the current capacity to incorporate climate projections as part of long-term planning, we asked survey participants questions about whether they currently model air quality for planning and whether this includes forecasting. Of the 30 districts that responded to the question, 13 (43%) respondents reported that their district models air quality. In a follow-up question about time horizon over which they model, most reported to model at the near-term time scale (daily, weekly, and/or monthly), and few model at the decadal scale (2) and beyond (3). Those with full attainment status for all federal pollutant standards tended to model air quality in their districts less often (4 out of 15) compared to those with nonattainment status (9 out of 17) ().
Table 5. District responses on whether they model air quality cross tabulated with summarized level of attainment status. Full attainment refers to those districts that meet the National Ambient Air Quality Standards (NAAQS). “Full attainment not achieved” refers to districts that fail to meet the NAAQS for one or more pollutant for the years 2014 through 2016.
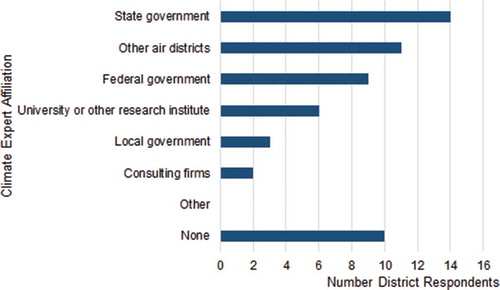
Of those districts that do model, most are looking at a time frame of less than 10 years, and only 2 respondent districts report to address changing future climate conditions. However, five districts account for extreme weather and environmental events in their modeling. More than half are communicating with climate experts (16 of the 26 who responded to this question)—primarily in the state or federal government or at academic institutions. Many (11 out of 26 who responded to the question) reported also to be working with other air districts for climate expertise (). The larger systems reported communicating with climate experts from a higher variety of organizations than smaller systems (Supplemental Information, Appendix B).
Figure 5. Responses of unique districts (N = 26) to the multiple-choice question of “Do you communicate with climate experts?”
Strategies in use to address extreme events
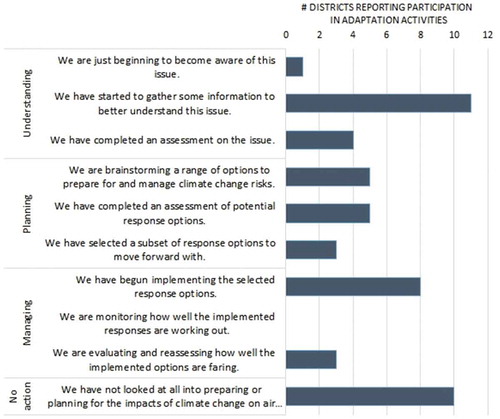
Next the survey examined actions taken by districts to prepare for climate change impacts on air quality. 10 out of 26 district respondents reported to have not looked at all into preparing or planning for the impacts of climate change on air quality. However, 11 districts reported having actively sought to define the problem of how climate change could affect their air quality and responsibilities. Few reported participating in activities of planning for adaptation ().
Figure 6. Districts reporting participation activities related to climate adaptation (question allowed for multiple selections other than “no action”). Survey question: “In terms of preparing for climate change impacts on air quality, select all of the statements below which best describe your district’s activities to date.”
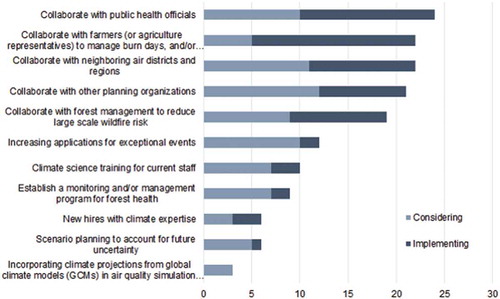
The specific strategies reported that are in use to address climate impacts fall broadly into three categories (): regulatory or rules, behavioral changes, and coordination with other organizations to limit sources of emissions. Regulatory/rules includes exceptional events applications or programs to limit emissions, such as wood burning bans. As noted earlier, a majority anticipate applying for additional exceptional event waivers in the future. Most anticipate that this increase will be attributable to climate change. Behavior change strategies are those programs to encourage limited exposure to pollution and/or to encourage behavior to limit emissions. Districts reported several strategies most frequently as “under consideration,” including collaborating with other planning organizations, establishing programs for forest health, climate science training for new staff, and scenario planning to account for future uncertainty.
Figure 7. Responses of unique districts for the following question: “If any, we’d like to know what strategies you are considering or implementing to manage climate impacts. Select all that apply” (N = 27).
Barriers and needs for climate adaptation
The final section asked respondents about barriers they encountered in preparing and/or adapting to climate change. Identifying the barriers is an increasingly common way to understand the needs of organizations and individuals for how to facilitate and support climate adaptation processes at any level of governance (Bedsworth and Hanak Citation2010; Biesbroek et al. Citation2013; Eisenack et al. Citation2014; Moser and Ekstrom Citation2010). The most frequently reported big hurdles “in efforts to prepare for the impacts of climate change” were related to available financial resources. Twenty district respondents report the lack of funding from state, regional, or federal agencies to implement a plan as a barrier to adaptation, followed closely by the 19 districts reporting the need for funding to prepare a plan to adapt. Insufficient staff (14 districts) and current pressing issues are all-consuming (13 districts) and were also reported by at least half the districts as big hurdles. Other hurdles to a smaller degree reported by respondents were lack of leadership (), no legal mandate, and a lack of public demand for adaptation ().
Figure 8. Responses (by district count) to the question “Have any of the following institutional, financial and other issues been a hurdle in your efforts to prepare for the impacts of climate change?”
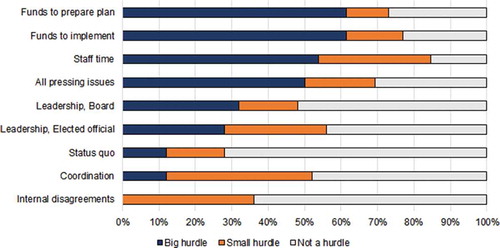
Figure 9. Responses by district count to the question “Have any of the following scientific or planning issues been a hurdle in your efforts to prepare for the impacts of climate change?”
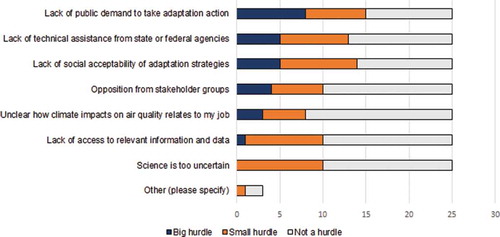
In terms of the scientific and planning barriers, district respondents noted the lack of public demand and lack of social acceptability most frequently. Those with full attainment reported that lack of public demand for adaptation was more of a hurdle on average than those with some nonattainment status. This may indicate that areas where air quality is better do not have the level of concern and awareness among the public for climate adaptation action within the air quality sector. Thirteen districts reported the need for technical assistance to adapt. It is notable that respondents did not mark “science is too uncertain” as a big hurdle to adaptation (). Similarly, only one district marked “lack of access to relevant information and data,” which aligns with the high awareness and perceived risk of climate change.
The reported severity of barriers also showed some possible relationships based on the advancement of the district’s adaptation process. Across all barriers to adaptation, those district respondents in the early stages of adaptation processes (in understanding or planning stages) marked funding as a larger hurdle on average than those not yet working on any adaptation and those reporting in the advanced “management” stage. Those district respondents that reported having not done any adaptation to date marked on average the lack of funding for preparing adaptation efforts as the biggest hurdle, closely followed by the lack of funding for implementing a plan, all pressing issues taking priority, and the lack of staff capacity.
In regards to the need for technical assistance, we also asked respondents about their trusted sources of information. Districts reported that the most common sources of information used to inform their work are colleagues at work, state agencies (respondents specifically identified the California Air Resources Board most often, which is the state’s primary air quality management agency), colleagues in other air districts, and professional conferences or meetings. These could be the trusted conduit for providing training and other information needs as they become available.
Discussion
Based on the survey results, we find awareness is high among California air quality district respondents of the current and future risks to air quality as a result of extreme weather and environmental events. The majority are taking steps to collect information to better understand the issue. Responses indicate that the major hurdles to climate adaptation are not scientific uncertainty, legal pressures to maintain status quo, or internal disagreements about the importance of climate change impacts. Instead, the most frequently reported barriers were related to financial issues. Training and guidance to incorporate projected climate change in planning (20, 62%) and to develop adaptation strategies (16, 50%) were reported by at least half the districts.
Next, we discuss the responses and implications across awareness, perceptions, and actions, highlighting the needs for changes in governance to support adaptation progress, given that leadership at the state level and leadership at the federal level were the most frequently noted barriers to climate adaptation reported by surveyed air district managers.
Awareness
Based on the survey responses, we find that the high awareness and knowledge of climate change among local managers indicates they seem to be ready to adopt and take action on policies that would support climate adaptation, but need higher up leadership and funding to make necessary changes. The survey responses found that, by far, the most frequently reported pollutants of concern are PM2.5 and ozone, and for both of these, studies show projected increases with climate change (Fann et al. Citation2015; Fang et al. Citation2013; Silva et al. Citation2013; Dawson et al. Citation2014). However, it is important to note that the projected changes of PM2.5 differ by geographic region and include more uncertainty than projected changes in ozone because of the diverse sources and contributions to PM formation (see Mahmud, Hixson, and Kleeman [Citation2012] for California-focused modelling and Kinney [Citation2018] for a recent literature review). Respondents also indicated that both ozone and PM are likely to be worsened by projected climate changes of increasing summer heat, more frequent and larger wildfires, and warmer winters (leading to more inversion conditions to trap particulate matter). Respondent districts noted that extreme events affecting air quality presently are wildfire, drought, and winter inversions; again, these are connected to PM2.5 and ozone.
Risk perceptions
In terms of perceptions and concerns, nearly all respondents agree to some degree that climate change is happening and poses risks to local air quality. More than half expect exceptional event applications to increase in the future, largely from climate change. The technical capacity and expertise appears high for many districts. Fourteen districts reported having close communication with climate experts at the state. However, at the other end of the spectrum, many (n = 10) report having no communication with climate experts, indicating that there could be a large disparity among districts. Additionally, nearly half of the respondent districts report having air quality models of their region, though currently most are not used or suited to long-term forecasts or projections.
Actions
In terms of air districts’ advancement in the adaptation process, most respondents indicated little or no progress beyond the planning stages. Ongoing activities that districts are actively involved in include mostly what they are already implementing to manage and cope with present air quality standards.
Districts most frequently report future risks to air quality as those that are outside the local air district’s jurisdictional control, such as transboundary pollution, cross-sector interactions, or extreme events such as wildfire. This indicates the need for improved collaboration and accountability, because leaving the burden of the local district to deal with the emissions caused by outside entities is neither fair nor prudent, but if not addressed will result in harmful public health impacts. Extending accountability, where possible, to emitters or jurisdictions overseeing the responsible emitters, within California or even neighboring states, could provide an incentive for pollutant reduction. Similarly, international agreements could support accountability across national boundaries, as has historically been effective in the case of reducing acid rain through the Geneva Convention on Long-Range Transboundary Air Pollution (Young Citation2001).
In September 2016, the U.S. EPA amended the Exceptional Events Rule, which some have argued relaxes requirements for districts to demonstrate the direct impact of an event on the district’s attainment status. While this relieves the local air districts from penalities for events that are not within their control, it does not designate accountability. The burden is then passed down to residents affecting public health and effectively creating a larger loophole for air quality management, especially as climate change increases extreme events. This approach could be considered maladaptation, which is a pathway or strategy that increases the climate change risks in the future (Christian-Smith, Levy, and Gleick Citation2014; Wise et al. Citation2014). Coupling this with the responses showing that air districts expect to use this Exceptional Event Rule as a climate change adaptation strategy highlights the need to evaluate this revision and the rule more generally for how it could be used in the face of advancing climate change.
Conclusion
In the near term, even in the absence of current leadership and support at the federal level for climate adaptation, opportunities exist at the state level to help move climate adaptation from awareness into action to support preparing air quality management. Based on findings from the districts in California, regional managers seem knowledgeable and inclined to incorporate climate adaptation into their planning. This presents a window of opportunity that could be useful for designing and demonstrating a pathway forward to support adaptation into the future. We note that the results found in California may not be consistent with experiences, perceptions, and capacities of other state’s air quality management programs. As noted earlier, California has a long history of addressing air quality challenges, has a progressive greenhouse mitigation program, and has a relatively advanced policy in climate adaptation. Together, this likely shapes and explains the receptivity and advancement of adaptation among local districts in this state. In addition, the physical impacts of how climate change could affect air quality differ geographically (Tai Citation2012), as does the degree of climate expertise, policy and technical resources, policies governing air quality and climate, and risk perceptions of climate change. Therefore, we do not extend the survey results and conclusions presented here beyond California.
As adaptation efforts initiate for air quality management, challenges will arise of how to balance long- versus short-term goals and how to incorporate the needs of different sectors when the climate adaptation strategies may unintentionally conflict or otherwise interfere with one another. This institutional interplay is not a new phenomenon, and experience shows that it can cause unintended consequences if not addressed early on (Young Citation2002). This is a key challenge for adapting proactively and purposefully to climate change—how to develop holistically across sectors (Ampaire et al. Citation2017). These cross-sectoral challenges overlay with the technical, financial, political, and legal barriers organizations and government agencies face, internally, in undertaking adaptation. While these internal challenges are critical to overcome, they are often exacerbations of existing issues that organizations face absent a changing climate. However, as we move forward in adaptation pathways, the deeper need remains largely untouched so far: how to ensure climate adaptation efforts advance in a way that is effective and holistic and that will yield results that are beneficial in the long and short term and across sectors.
Supplemental Material Survey
Download MS Word (33.4 KB)Supplemental Information
Download MS Word (48.1 KB)Acknowledgment
We thank the survey respondents for participating in the study. We appreciate the California Air Pollution Control Officers Association for contributing insights about air quality management and Dr. Mark Lubell, Meghan Klasic, and several air districts for valuable survey help.
Supplementary material
Supplemental data for this paper can be accessed on the publisher’s website.
Additional information
Funding
Notes on contributors
Julia A. Ekstrom
Julia Ekstrom is the Climate Adaptation Program Director of the Policy Institute for Energy, Environment, and the Economy at the University of California (UC) Davis.
Louise Bedsworth
Louise Bedsworth is a fellow at the Policy Institute for Energy, Environment, and the Economy at UC Davis. She is the Deputy Director of the Office for Planning and Research in the Office of California Governor Edmund G. Brown.
Related Research Data
References
- American Lung Association (ALA). 2017. State of the Air 2017. http://www.lung.org/ (accessed May 15, 2017).
- Ampaire, E.L., L. Jassogne, H. Providence, M. Acosta, J. Twyman, L. Winowiecki. et al. 2017. Institutional challenges to climate change adaptation: A case study on policy action gaps in Uganda. Environ. Sci. Policy 75:81–90. doi:10.1016/j.envsci.2017.05.013.
- Amundsen, H., F. Berglund, and H. Westskog. 2010. Overcoming barriers to climate change adaptation—A question of multilevel governance? Environ. Plann. C: Govt. and Policy 28:276–289. doi:10.1068/c0941.
- Araos, M., S.E. Austin, L. Berrang-Ford, and J. D. Ford. 2016. Public health adaptation to climate change in large cities: A global baseline. Int. J. Health Serv. 46:53–78. doi:10.1177/0020731415621458.
- Armitage, D. 2007. Governance and the commons in a multi-level.World Int. J. Commons 2:7. doi:10.18352/ijc.28.
- Bachman, J. 2007. Will the circle be unbroken: A history of the US National Ambient Air Quality Standards. J. Air Waste Manage Assoc. 57:652–697. doi:10.3155/1047-3289.57.6.652.
- Bedsworth, L. 2009. Preparing for climate change: A perspective from local public health officers in California. Environ. Health Perspect. 117:617–623. doi:10.1289/ehp.0800114.
- Bedsworth, L.W., and E. Hanak. 2010. Adaptation to climate change. J. Am. Plann. Assoc. 76:477–495. doi:10.1080/01944363.2010.502047.
- Biesbroek, G.R., J. E. M. Klostermann, J. A. Catrien, and P. Kabat. 2013. On the nature of barriers to climate change adaptation. Reg. Environ. Change 13:1119–1129. doi:10.1007/s10113-013-0421-y.
- Christian-Smith, J., M.C. Levy, and P. H. Gleick. 2014. Maladaptation to drought: A case report from California, USA. Sustainability Sci. 10:491–501. doi:10.1007/s11625-014-0269-1.
- Dawson, J.P., B.J. Bloomer, D.A. Winner, and C.P. Weaver 2014. Understanding the Meteorological Drivers of U.S. particulate matter concentrations in a changing climate. Bull. Am. Meteorol. Soc. 95:521–532. doi: 10.1175/BAMS-D-12-00181.1.
- Dilling, L., E. Pizzi, J. Berggren, A. Ravikumar, and K. Andersson. 2017. Drivers of adaptation: Responses to weather- and climate-related hazards in 60 local governments in the Intermountain Western U.S. Environ. Plann. A49(11):2628 –2648.
- Eisenack, K., S. C. Moser, E. Hoffmann, R. J. T. Klein, C. Oberlack, A. Pechan. et al. 2014. Explaining and overcoming barriers to climate change adaptation. Nat. Clim. Change 4:867–872. doi:10.1038/nclimate2350.
- Ekstrom, J.A., L. Bedsworth, and A. Fencl. 2017. Gauging climate preparedness to inform adaptation needs: Local level adaptation in drinking water quality in CA, USA. Clim. Change 140:467–481. doi:10.1007/s10584-016-1870-3.
- Fang, Y., V. Naik, L. W. Horowitz, and D. L. Mauzerall. 2013. Air pollution and associated human mortality: The role of air pollutant emissions, climate change and methane concentration increases from the preindustrial period to present. Atmos. Chem. Phys. 13 (3):1377–1394. doi:10.5194/acp-13-1377-2013.
- Fann, N., T. Brennan, P. Dolwick, J. L. Gamble, V. Ilacqua, L. Kolb, C. G. Nolte, T. L. Spero, and L. Ziska. 2016. Chapter 3: Air quality impacts, Rep. In The impacts of climate change on human health in the United States: A scientific assessment, 69–98. Washington, D. C.: U.S.Global Change Res. Program. doi:10.7930/J0GQ6VP6.
- Fann, N.T., C. G. Nolte, P. Dolwick, T. Spero, A. Curry Brown. et al. 2015. The geographic distribution and economic value of climate change-related ozone health impacts in the United States in 2030. J. Air Waste Manage. Assoc. 65 (5):570–580. doi:10.1080/10962247.2014.996270.
- Finzi-Hart, J. A., P. M. Grifman, S. C. Moser, A. Abeles, M. R. Myers, S. C. Schlosser, and J. A. Ekstrom. 2012. Rising to the challenge: Results of the 2011 California coastal adaptation needs assessment. USC Sea Grant Technical Report-01-2012.
- Fiore, A.M., V. Naik, and E. M. Leibensperger. 2015. Air quality and climate connections. J. Air Waste Manage. Assoc. 65:645–685. doi:10.1080/10962247.2015.1040526.
- Fischer, E.M., and R. Knutti. 2015. Anthropogenic contribution to global occurrence of heavy-precipitation and high-temperature extremes. Nat. Clim. Change 5:560–564. doi:10.1038/nclimate2617.
- Gergel, D.R., B. Nijssen, J. T. Abatzoglou, D. P. Lettenmaier, and M. R. Stumbaugh. 2017. Effects of climate change on snowpack and fire potential in the western USA. Clim. Change 141:287–299. doi:10.1007/s10584-017-1899-y.
- Hosking, J., and D. Campbell-Lendrum. 2012. How well does climate change and human health research match the demands of policymakers? A scoping review. Environ. Health Perspect. 120:1076–1082. doi:10.1289/ehp.1104093.
- Iacobellis, S., J.R. Norris, M. Kanamitsu, M. Tyree, and D. Cayan. August, 2009. Climate variability and California low-level temperature inversions. Report of the California Climate Change Center. CEC-500-2009-020-F. Sacramento, CA.http://www.energy.ca.gov/2009publications/CEC-500-2009-020/CEC-500-2009-020-F.PDF (accessed December 5, 2017).
- Jacob, D. J., and D.A. Winner. 2009. Effect of climate change on air quality. Atmos. Environ. 43:51–63. doi:10.1016/j.atmosenv.2008.09.051.
- Kinney, P. 2018. Interaction of climate change, air pollution, and human health. Curr. Environ. Health Rep 5(1), 179–186 doi:10.1007/s40572-018-0188-x.
- Mahmud, A., M. Hixson, and M. J. Kleeman. 2012. Quantifying population exposure to airborne particulate matter during extreme events in California due to climate change. Atmos. Chem. Phys. 12:7453–7463. doi:10.5194/acp-12-7453-2012.
- Mastrandrea, M.D., N.E. Heller, T.L. Root, and S. H. Schneider. 2010. Bridging the gap: Linking climate-impacts research with adaptation planning and management. Clim. Change 100:87–101. doi:10.1007/s10584-010-9827-4.
- Measham, T.G., B.L. Preston, T.F. Smith, C. Brooke, R. Gorddard, G. Withycombe. et al. 2011. Adapting to climate change through local municipal planning: Barriers and challenges. Mitigation and Adapt. Strategies for Global Change 16:889–909. doi:10.1007/s11027-011-9301-2.
- Mickley, L.J. 2007. A future short of breath? Possible effects of climate change on smog. Environ.: Sci. Policy for Sustainable Dev. 49:32–43.
- Moser, S.C., and C. Pike. 2015. Community engagement on adaptation: Meeting a growing capacity need. UrbanClim . 14:111–115. doi:10.1016/j.uclim.2015.06.006.
- Moser, S.C., and J. A. Ekstrom. 2010. A framework to diagnose barriers to climate change adaptation. Proc. Nat. Acad. Sci. USA 107:22026–22031. doi:10.1073/pnas.1007887107.
- Næss, L.O., G. Bang, S. Eriksen, and J. Vevatne. 2005. Institutional adaptation to climate change: Flood responses at the municipal level in Norway. Global Environ. Change 15:125–138. doi:10.1016/j.gloenvcha.2004.10.003.
- Nalau, J., B. L. Preston, and M. C. Maloney. 2015. Is adaptation a local responsibility? Environment Sciences Policy 48:89–98. doi:10.1016/j.envsci.2014.12.011.
- National Research Council (NRC). 2010. America’s climate choices: Adapting to the impacts of climate change. Washington, DC: National Academies Press.
- Pahl-Wostl, C. 2009. A conceptual framework for analysing adaptive capacity and multi-level learning processes in resource governance regimes. Global Environ. Change 19:354–365. doi:10.1016/j.gloenvcha.2009.06.001.
- Pieke, R., G. Prins, S. Rayner, and D. Sarewitz. 2007. Lifting the taboo on adaptation. Nature 445:597–598. doi:10.1038/445597a.
- IPCC, R.K. Pachauri and L.A. Meyer. 2014. Annex II: Glossary [Mach, K.J., S. Planton and C. von Stechow (eds.)]. In Climate Change 2014: Synthesis Report. Contribution of working groups I, II and III to the fifth assessment report of the intergovernmental panel on climate change, eds. Core Writing Team,117–130. Geneva, Switzerland: IPCC
- Radhakrishnan, M., A. Pathirana, R. Ashley, and C. Zevenbergen. 2017. Structuring climate adaptation through multiple perspectives: Framework and case study on flood risk management. Water 9:1–20. doi:10.3390/w9020129.
- Rasmussen, D. J., J. Hu, A. Mahmud, and M. J. Kleeman. 2013. The Ozone–Climate Penalty: Past, present, and future. Environ. Sci. Technol. 47:14258–14266. doi:10.1021/es403446m.
- Silva, R. A., J. West, J.-F. Lamarque, D. T. Shindell, W. J. Collins, G. Faluvegi, et al. 2017. Future global mortality from changes in air pollution attributable to climate change. Nat. Clim. Change. doi:10.1038/nclimate3354.
- Silva, R.A., J.J. West, Y. Zhang, S.C. Anenberg, J. Lamarque, Collins Shindell, W. Dalsoren, S. Faluvegi, and G. Folberth. 2013. Global premature mortality due to anthropogenic outdoor air pollution and the contribution of past climate change Environ. Res. Lett. 8: 034005.
- Stakhiv, E. Z. 1993. Evaluation of IPCC Adaptation Strategies. Institute for Water Resources. Fort Belvoir: United States Army Corps of Engineers.
- Tai, P. 2012. Impact of Climate Change on Fine Particulate Matter(PM2.5) Air Quality. Doctoral dissertation, Harvard University
- Timberlake, T.J., and C.A. Schultz. 2017. Policy, practice, and partnerships for climate change adaptation on US national forests. Clim. Change. doi:10.1007/s10584-017-2031-z.
- Tribbia, J., and S. C. Moser. 2008. More than information: What coastal managers need to plan for climate change. Environ. Sci. Policy 11:315–328. doi:10.1016/j.envsci.2008.01.003.
- U.S. Environmental Protection Agency (EPA). 2018. Air Quality Index Basics. https://airnow.gov/ (accessed February 26, 2018).
- U.S. Environmental Protection Agency, (EPA). 2017. Nonattainment areas for criteria pollutants (Green Book).https://www.epa.gov/green-book (accessed July 15, 2017).
- Verner, G., S. Schütte, J. Knop, O. Sankoh, and R. Sauerborn. 2016. Health in climate change research from 1990 to 2014: positive trend, but still underperforming. Glob. Health Action 9:30723; doi:10.3402/gha.v9.30723.
- Westerling, A.L. 2016. Increasing western US forest wildfire activity: Sensitivity to changes in the timing of spring. Philos. Trans. R Social Lond B Biol. Sci. 371. doi:10.1098/rstb.2015.0178.
- Wise, R.M., I. Faze, M. Stafford Smith, S.E. Park, H.C. Eakin, E. Van Garderen. et al. 2014. Reconceptualising adaptation to climate change as part of pathways of change and response. Global Environ. Change 28:325–336. doi:10.1016/j.gloenvcha.2013.12.002.
- Young, O.R. 2001. Inferences and indices: Evaluating the effectiveness of international environmental regimes. Environ. GlobalPolitics 1:99–121. doi:10.1162/152638001570651.
- Young, O.R. 2002. The institutional dimensions of environmental change: Fit, interplay, and scale. Cambridge, MA: MIT Press.