
ABSTRACT
Solid or sludgy hydrocarbon waste is a by-product of oil and gas exploration and production. One commonly used method of disposing of this waste is landfarming. Landfarming involves spreading hydrocarbon waste on soils, tilling it into the soil, and allowing it to biodegrade. We used a dynamic flux chamber to measure fluxes of methane, a suite of 54 nonmethane hydrocarbons, and light alcohols from an active and a remediated landfarm in eastern Utah. Fluxes from the remediated landfarm were not different from a polytetrafluoroethylene (PTFE) sheet or from undisturbed soils in the region. Fluxes of methane, total nonmethane hydrocarbons, and alcohols from the landfarm in active use were 1.41 (0.37, 4.19) (mean and 95% confidence limits), 197.90 (114.72, 370.46), and 4.17 (0.03, 15.89) mg m−2 hr−1, respectively. Hydrocarbon fluxes were dominated by alkanes, especially those with six or more carbons. A 2-ha landfarm with fluxes of the magnitude we observed in this study would emit 95.3 (54.3, 179.7) kg day−1 of total hydrocarbons, including 11.2 (4.3, 33.9) kg day−1 of BTEX (benzene, toluene, ethylbenzene, and xylenes).
Implications: Solid and sludgy hydrocarbon waste from the oil and gas industry is often disposed of by landfarming, in which wastes are tilled into soil and allowed to decompose. We show that a land farm in Utah emitted a variety of organic compounds into the atmosphere, including hazardous air pollutants and compounds that form ozone. We calculate that a 2-ha landfarm facility would emit 95.0 ± 66.0 kg day−1 of total hydrocarbons, including 11.1 ± 1.5 kg day−1 of BTEX (benzene, toluene, ethylbenzene, and xylenes).
Introduction
The climate and air quality impacts of oil and gas development have been studied extensively (Ahmadov et al. Citation2015; Field et al. Citation2015; Helmig et al. Citation2014; Lyman and Tran Citation2015; McDuffie et al. Citation2016; Oltmans et al. Citation2014; Prenni et al. Citation2016; Warneke et al. Citation2014). Field-wide and basin-wide measurements of emissions from the oil and gas sector are usually higher than emissions predicted by official inventories (Ahmadov et al. Citation2015; Brandt et al. Citation2014; Karion et al. Citation2013). One reason for this discrepancy could be that some oil- and gas-related emission sources are not included in current inventories (Brandt et al. Citation2014; Caulton et al. Citation2014). One source category that has been excluded from oil and gas inventories is waste disposal (WRAP Citation2015), including produced water and solid waste. Very few measurements of emissions related to oil and gas waste disposal have been collected (Pardue and Valsaraj Citation2000; Thoma Citation2009).
Solid and sludgy hydrocarbon waste from the oil and gas industry is often disposed of in landfarms. Landfarms are sites where hydrocarbon-contaminated waste from the oil and gas industry is applied to and mixed with surface soil as a method of bioremediation (Gurska et al. Citation2009). Oil and gas solid waste disposed of at landfarms may include drilling waste, solid material accumulated in liquid storage tanks, or other materials. Often, fertilizers or other additives are used to amend landfarm soils (Callaham et al. Citation2002) and the soil is periodically tilled (Ausma et al. Citation2001) to promote decomposition of hydrocarbons. Volatile hydrocarbons tend to be emitted from landfarms into the atmosphere, rather than being degraded (Hejazi, Husain, and Khan Citation2003). Emissions from landfarms decrease rapidly after application of solid waste as the supply of volatiles becomes depleted (Ausma et al. Citation2002; Pardue and Valsaraj Citation2000). Tilling increases emissions of hydrocarbons from landfarm soils (Ausma, Edwards, and Gillespie Citation2003; Ausma et al. Citation2001). Emissions from landfarms have been modeled by Pardue and Valsaraj (Citation2000), Dupont (Citation1986), and Thibodeaux and Hwang (Citation1982).
We report in the following on measurements of organic compound emissions from a landfarm facility in the Uinta Basin of eastern Utah. We present information about the magnitude, distribution and speciation of measured emissions.
Methods
Study location
We measured fluxes from a landfarm facility in the Uinta Basin during fall 2014, spring 2015, and spring 2016 (21 total flux chamber measurements). The facility consisted of two landfarms—one that had been remediated and another that was actively receiving oil and gas solid waste. The remediated landfarm did not receive any applications of clean soil or other additives after disuse. It contained some natural vegetation. The operator did not disclose the date of the last waste application to the remediated landfarm. For comparison with the landfarms, we measured fluxes from undisturbed soils in oil- and gas-producing areas throughout eastern Utah.
Flux chamber
We measured fluxes with a polycarbonate dynamic flux chamber, which was constructed according to the design of Eklund (Citation1992), except that (1) we used a mixing fan with a polyethylene blade to ensure that air inside the chamber was well mixed, and (2) instead of using purified sweep gas, the chamber pulled in ambient air from a 1.2-cm hole in one side. We determined flux as
where F is the soil–air flux (mg m−2 h−1), ΔC is the difference in concentrations of the compound of interest inside versus outside the chamber (mg m−3), FR is the flow rate (m3 hr−1), and S is the surface area covered by the chamber (m2) (Denmead Citation2008). We sampled air inside and outside the chamber using PFA tubing with PTFE filters to avoid particle contamination. The flow rate through the chamber was 10 sL min−1 (standard conditions of 25°C and 1 atm). Each flux measurement was collected over 60 min.
Additional discussion about the chamber method, including possible interferences from nearby emission sources and the results of several different quality control experiments, is available from Lyman et al. (Citation2017) and Lyman et al. (Citation2018)
Methane and carbon dioxide
We measured methane and carbon dioxide with a Los Gatos Research (LGR) Ultra-Portable Greenhouse Gas Analyzer. Flux detection limits were 0.06 and 18.9 mg m−2 h−1 for methane and carbon dioxide (3 times the standard deviation of blanks). We checked the LGR analyzer against National Institute of Standards and Technology (NIST)-traceable compressed gas calibration standards daily. Calibration standard recovery was 98 (97, 99)% (mean (lower confidence limit, upper confidence limit)) for methane and 98 (96, 100)% for carbon dioxide.
Nonmethane hydrocarbons
We collected whole-air samples from inside and outside the chamber with silonite-coated 6-L stainless steel canisters. We analyzed the canisters for 54 nonmethane hydrocarbons (NMHC), methanol, ethanol, and isopropanol using a method similar to guidance provided by the U.S. Environmental Protection Agency for photochemical assessment monitoring stations (Epa Citation1998). We used stainless-steel Alicat mass flow controllers to regulate flow into the canisters. We used cold-trap dehydration (Wang and Austin Citation2006) with an Entech 7200 preconcentrator and a 7016D autosampler to preconcentrate samples. We analyzed samples with two Shimadzu GC-2010 gas chromatographs, a flame ionization detector (for C2 and C3 NMHC), and a mass spectrometer (for all other compounds). Compounds were separated with a Restek rtx1-ms column (all compounds; 60 m, 0.32 mm inner diameter [ID]), a Restek Alumina BOND/Na2SO4 column (C2 and C3 NMHC; 50 m, 0.32 mm ID), and another Restek rtx1-ms column (all other compounds; 30 m, 0.25 mm ID). Calibration checks had an average recovery of 104.6 (103, 104)%. Duplicate samples were −2 (−3, 0)% different. Flux detection limits for individual NMHC were 0.05 (0.04, 0.06) mg m−2 hr−1.
We measured fluxes from a 3-mmpolytetrafluoroethylene (PTFE) sheet as a blank (n = 8). Methane, carbon dioxide, and individual NMHC fluxes from the PTFE sheet were 0.02 (−0.01, 0.04), 16 (−31, 109), and 0.01 (0.00, 0.02), respectively.
Meteorology
We used a New Mountain NM150WX to measure temperature, relative humidity, wind conditions, and barometric pressure at 6 m above ground. We used a Campbell CS300 to measure solar radiation and a Campbell CS655 to measure soil moisture.
Statistical analysis
We calculated 95% confidence limits in R using bootstrapping and the BCa method (DiCiccio and Efron Citation1996). We present results as bootstrapped means, with lower and upper confidence limits in parentheses.
Results and discussion
Methane, total NMHC, and alcohol fluxes from the remediated landfarm were −0.54 (−2.41, 0.10), −0.10 (−0.78, 0.34), and −0.03 (−0.63, 0.31) mg m−2 hr−1, respectively. In a Student’s t-test (α = 0.05), these values were not different from fluxes from a 3-mm-thick PTFE sheet (n = 8) and from undisturbed soils in eastern Utah (n = 28). Undisturbed soils had methane and total NMHC fluxes of −0.06 (−0.09, −0.02) and 0.50 (−0.05, 1.05) mg m−2 hr−1, respectively (Lyman et al. Citation2017).
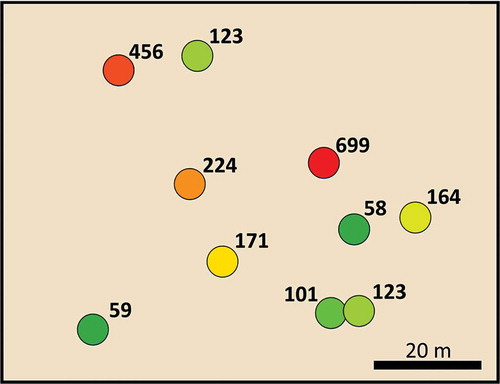
Fluxes from the active landfarm were extremely spatially variable. Some measurements were collected on soils that were black with visible oil, while others were collected on soils that were indistinguishable in color from natural soil. shows the distribution of total NMHC fluxes from the active landfarm.
Figure 1. Map showing the location of measured total NMHC (TNMHC) fluxes from the active landfarm (circle coloration is by quantile). Flux magnitude, in units of mg m−2 hr−1, is shown for each measurement location. The shape of the landfarm has been stylized and the orientation changed to protect the identity of the owner. The scale and the measurement positions relative to each other are accurate.
shows summary statistics for measurements from the active landfarm. The highest measured fluxes were of carbon dioxide, likely indicating that soil bacteria were actively decomposing organic compounds that were added to the soil. Carbon dioxide flux was well correlated with TNMHC flux (r2 = 0.72), but poorly correlated with methane flux (r2 = 0.13). TNMHC fluxes from the active landfarm were correlated with solar radiation (r2 = 0.40) and with air temperature inside the chamber (r2 = 0.25), but not with any other of the meteorological variables measured, including ambient air temperature (r2 = 0.01) and soil temperature (r2 = 0.01). Air temperature inside the chamber (26.8 (23.2, 30.3) °C) was higher than air temperature outside (16.5 (14.0, 19.1) °C), and air temperature inside the chamber was correlated with solar radiation (r2 = 0.37). It may be that higher temperature inside the chamber led to increased volatilization of NMHC from the soil (Eklund Citation1992).
Table 1. Summary of fluxes measured from the active landfarm.
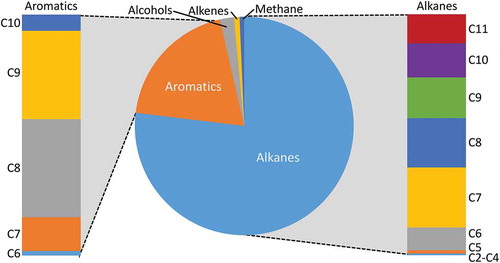
shows the speciation of measured organic compound fluxes. Alkanes made up 77% of the total organic compound flux from the active landfarm, and aromatics accounted for 20%, while methane accounted for only 1%. Methane fluxes from the active landfarm were not significantly higher than at the remediated landfarm (p = 0.37) and were very low compared to total NMHC. Light alkane fluxes were also relatively low, with C1–C5 alkanes comprising only 2% of the average total organic compound flux. Also, benzene and toluene (C6 and C7 aromatics in ), comprised a minority of the aromatic flux, which was dominated by C8 and C9 aromatics.
Figure 2. Fractions of emission flux from an active landfarm that were due to alkanes, aromatics, alkenes, alcohols, and methane. Fractions of alkane and aromatic emissions are also broken down by carbon number.
The NMHC flux speciation from the active landfarm is in contrast to the speciation of crude oil in the Uinta Basin (ERT Citation2015). Excluding compounds in crude oil with more than 11 carbons (since our analytical system only measured C2–C11 NMHC), the percent of NMHC flux from the active landfarm that was C3–C4 compounds was only 48% as much as that in crude oil, while the percent of flux that was C6–C8 compounds was 3.4 times greater than in crude oil, and the percent of flux that was C10–C11 compounds was roughly equivalent to the makeup of crude oil. The underrepresentation of light compounds in the flux relative to the composition of crude oil was likely due to the fact that these compounds rapidly volatilize, and the solid waste/soil mixtures we sampled had likely already been depleted of these compounds before we sampled them. We expect that the overrepresentation of C6–C8 compounds in the flux relative to crude oil was due to the fact that these compounds are of intermediate volatility—they survive in oily waste long enough to still be there when we sampled, but they are volatile enough that they were actively emitting from the waste at the time of sampling. As the number of carbon atoms increases, NMHC become less and less volatile and are more likely to remain in the soil and eventually be decomposed (Hejazi, Husain, and Khan Citation2003).
Landfarms in the Uinta Basin commonly cover 1–3 ha. Assuming the fluxes shown in occur over the area of a 2-ha landfarm, that landfarm would emit 95.3 (54.3, 179.7) kg day−1 of total NMHC. Fluxes of methanol, benzene, and total BTEX (benzene, toluene, ethylbenzene, and xylenes) would be 0.10 (−0.25, 0.36), 0.4 (0.12, 0.84), and 11.2 (4.3, 33.9) kg day−1, respectively. For comparison, extrapolation of measurements by Pardue and Valsaraj (Citation2000) at active landfarms in Louisiana over a 2-ha area would result in total BTEX emissions of 3.2 (1.8, 6.9) kg day−1.
It is impossible to accurately scale up our measurements to the level of the entire Uinta Basin, since the total acreage of landfarms in the Basin is not known, we didn’t collect any measurements in summer or winter when fluxes could be higher or lower, we only sampled at one facility, the measurements we collected showed high variability, etc. If we make the assumption that the measurements we collected at this facility are representative of other seasons, we calculate annual emissions of total NMHC of 35 tonnes, or annual BTEX emissions of 4 tonnes. Emissions are highest immediately after oil and gas solid waste is exposed to the atmosphere (Ausma et al. Citation2002; Pardue and Valsaraj Citation2000), and for safety reasons we were not able to sample waste as it was being applied to the landfarm. Thus, we expect that our measurements significantly underestimate true landfarm emissions at this facility.
Conclusion
We measured fluxes of methane, NMHC, and alcohols at a facility that contained a remediated and an active landfarm. Fluxes from the remediated landfarm were low and similar to undisturbed soils in the region, indicating that most of the added volatile organic compounds had decomposed or volatilized. Fluxes from the active landfarm were spatially variable. Fluxes were dominated by alkanes, especially compounds with 6 or more carbons. Fluxes of aromatics were dominated by compounds with 8 and 9 carbons. Total organic compound flux from the active landfarm was 216.3 (126.8, 391.7) mg m−2 h−1. We estimate that a 2 ha landfarm would emit at least an average of 95.3 (54.3, 179.7) kg day−1 of total NMHC, including 11.2 (4.3, 33.9) kg day−1 of BTEX compounds.
Additional information
Funding
Notes on contributors
Seth N. Lyman
Seth Lyman and Marc Mansfield are scientists affiliated with the Utah State University (USU) Bingham Research Center. Seth is a research associate professor in USU’s Department of Chemistry and Biochemistry, and Marc is a research professor in the same department.
References
- Ahmadov, R., S. McKeen, M. Trainer, R. Banta, A. Brewer, S. Brown, P.M. Edwards, J.A. de Gouw, G.J. Frost, J. Gilman, D. Helmig, B. Johnson, A. Karion, A. Koss, A. Langford, B. Lerner, J. Olson, S. Oltmans, J. Peischl, G. Petron, Y. Pichugina, J.M. Roberts, T. Ryerson, R. Schnell, C. Senff, C. Sweeney, C. Thompson, P.R. Veres, C. Warneke, R. Wild, E.J. Williams, B. Yuan, and R. Zamora. 2015. Understanding high wintertime ozone pollution events in an oil- and natural gas-producing region of the western US. Atmos. Chem. Phys. 15:411–429. doi:10.5194/acp-15-411-2015 (accessed July 2017).
- Ausma, S., G.C. Edwards, C.R. Fitzgerald-Hubble, L. Halfpenny-Mitchell, T.J. Gillespie, and W.P. Mortimer. 2002. Volatile hydrocarbon emissions from a diesel fuel-contaminated soil bioremediation facility. J. Air Waste Manage. Assoc. 52:769–780. doi:10.1080/10473289.2002.10470819.
- Ausma, S., G.C. Edwards, and T.J. Gillespie. 2003. Laboratory-scale measurement of trace gas fluxes from landfarm soils. J. Environ. Qual. 32:8–22. doi:10.2134/jeq2003.8000.
- Ausma, S., G.C. Edwards, E.K. Wong, T.J. Gillespie, C.R. Fitzgerald-Hubble, L. Halfpenny-Mitchell, and W.P. Mortimer. 2001. A micrometeorological technique to monitor total hydrocarbon emissions from landfarms to the atmosphere. J. Environ. Qual. 30:776–785. doi:10.2134/jeq2001.303776x.
- Brandt, A., G. Heath, E. Kort, F. O’Sullivan, G. Pétron, S. Jordaan, P. Tans, J. Wilcox, A. Gopstein, and D. Arent. 2014. Methane leaks from North American natural gas systems. Science 343:733–735. doi:10.1126/science.1247045.
- Callaham, M.A., A.J. Stewart, C. Alarcón, and S.J. McMillen. 2002. Effects of earthworm (Eisenia fetida) and wheat (Triticum aestivum) straw additions on selected properties of petroleum-contaminated soils. Environ. Toxicol. Chem. 21:1658–1663. doi:10.1002/etc.v21:8.
- Caulton, D.R., P.B. Shepson, R.L. Santoro, J.P. Sparks, R.W. Howarth, A.R. Ingraffea, M.O. Cambaliza, C. Sweeney, A. Karion, and K.J. Davis. 2014. Toward a better understanding and quantification of methane emissions from shale gas development. Proc. Natl. Acad. Sci. U. S. A. 111:6237–6242. doi:10.1073/pnas.1316546111.
- Denmead, O. 2008. Approaches to measuring fluxes of methane and nitrous oxide between landscapes and the atmosphere. Plant and Soil 309:5–24. doi:10.1007/s11104-008-9599-z.
- DiCiccio, T.J., and B. Efron. 1996. Bootstrap confidence intervals. Statistical Science 11, 189–212.
- Dupont, R. 1986. Evaluation of air emission release rate model predictions of hazardous organics from land treatment facilities. Environ. Prog. 5:197–206. doi:10.1002/(ISSN)1547-5921.
- Eklund, B. 1992. Practical guidance for flux chamber measurements of fugitive volatile organic emission rates. J. Air Waste Manage. Assoc. 42:1583–1591. doi:10.1080/10473289.1992.10467102.
- Epa, U.S. 1998. Technical assistance document for sampling and analysis of ozone precursors. Research Triangle Park, NC: United States Environmental Protection Agency. http://www.epa.gov/ttn/amtic/files/ambient/pams/newtad.pdf (accessed July 2017).
- ERT. 2015. Characterization of waxy crude deposition in pipelines: Final report to utah science, technology and research initiative energy research triangle. Salt Lake City, UT: University of Utah, Utah State University, Brigham Young University. https://binghamresearch.usu.edu/files/reports/Utah%20Energy%20Research%20Triangle%20Project%20Final%20Report%20March%202015.pdf (accessed July 2017).
- Field, R.A., J. Soltis, M.C. McCarthy, S. Murphy, and D.C. Montague. 2015. Influence of oil and gas field operations on spatial and temporal distributions of atmospheric non-methane hydrocarbons and their effect on ozone formation in winter. Atmos. Chem. Phys. 15:3527–3542. doi:10.5194/acp-15-3527-2015.
- Gurska, J., W. Wang, K.E. Gerhardt, A.M. Khalid, D.M. Isherwood, X.-D. Huang, B.R. Glick, and B.M. Greenberg. 2009. Three year field test of a plant growth promoting rhizobacteria enhanced phytoremediation system at a land farm for treatment of hydrocarbon waste. Environ. Sci. Technol. 43:4472–4479. doi:10.1021/es801540h.
- Hejazi, R.F., T. Husain, and F.I. Khan. 2003. Landfarming operation of oily sludge in arid region—Human health risk assessment. J. Hazard. Mater. 99:287–302. doi:10.1016/S0304-3894(03)00062-1.
- Helmig, D., C.R. Thompson, J. Evans, P. Boylan, J. Hueber, and J.H. Park. 2014. Highly elevated atmospheric levels of volatile organic compounds in the Uintah Basin, Utah. Environ. Sci. Technol. 48:4707–4715. doi:10.1021/es405046r.
- Karion, A., C. Sweeney, G. Petron, G. Frost, R.M. Hardesty, J. Kofler, B.R. Miller, T. Newberger, S. Wolter, R. Banta, A. Brewer, E. Dlugokencky, P. Lang, S.A. Montzka, R. Schnell, P. Tans, M. Trainer, R. Zamora, and S. Conley. 2013. Methane emissions estimate from airborne measurements over a western United States natural gas field. Geophys. Res. Let. 40:4393–4397. doi:10.1002/grl.50811.
- Lyman, S., and T. Tran. 2015. Inversion structure and winter ozone distribution in the Uintah Basin, Utah, USA. Atmos. Environ. 123:156–165. doi:10.1016/j.atmosenv.2015.10.067.
- Lyman, S.N., M.L. Mansfield, H.N.Q. Tran, J.D. Evans, C. Jones, T. O’Neil, R. Bowers, A. Smith, and C. Keslar. 2018. Emissions of organic compounds from produced water ponds I: Characteristics and speciation. Sci. Tot. Environ. 619–620:896–905. doi:10.1016/j.scitotenv.2017.11.161.
- Lyman, S.N., C. Watkins, C.P. Jones, M.L. Mansfield, M. McKinley, D. Kenney, and J. Evans. 2017. Hydrocarbon and carbon dioxied fluxes from natural gas well pad soils and surrounding soils in eastern Utah. Environ. Sci. Technol. 51:11625–11633. doi:10.1021/acs.est.7b03408.
- McDuffie, E.E., P. M. Edwards, J.B. Gilman, B.M. Lerner, W.P. Dubé, M. Trainer, D.E. Wolfe, W. M. Angevine, J. deGouw, and E.J. Williams. 2016. Influence of oil and gas emissions on summertime ozone in the Colorado Northern Front Range. J. Geophys. Res. Atmos. 121:8712–8729. doi:10.1002/2016JD025265.
- Oltmans, S., R. Schnell, B. Johnson, G. Pétron, T. Mefford, and R. Neely, III. 2014. Anatomy of wintertime ozone associated with oil and natural gas extraction activity in Wyoming and Utah. Elementa: Science of the Anthropocene. 2:000024.
- Pardue, J.H., and K. Valsaraj. 2000. Assessment of air emissions at the US liquids exploration and production land treatment facility. Baton Rouge, LA: Louisiana State University.
- Prenni, A., D. Day, A. Evanoski-Cole, B. Sive, A. Hecobian, Y. Zhou, K. Gebhart, J. Hand, A. Sullivan, and Y. Li. 2016. Oil and gas impacts on air quality in federal lands in the Bakken region: An overview of the Bakken Air Quality Study and first results. Atmos. Chem. Phys. 16:1401–1416. doi:10.5194/acp-16-1401-2016.
- Thibodeaux, L., and S. Hwang. 1982. Landfarming of petroleum wastes—Modeling the air emission problem. This natural treatment process has vapor emission problems that may be reduced dramatically by subsurface injection. Environ. Prog. 1:42–46. doi:10.1002/(ISSN)1547-5921.
- Thoma, E. 2009. Measurement of emisisons from produced water ponds: Upstream oil and gas study #1. Cincinnati, OH: U.S. Environmental Protection Agency. http://nepis.epa.gov/Adobe/PDF/P100EACG.pdf (accessed July 2017).
- Wang, D., and C. Austin. 2006. Determination of complex mixtures of volatile organic compounds in ambient air: Canister methodology. Anal. Bioanal. Chem. 386:1099–1120. doi:10.1007/s00216-006-0466-6.
- Warneke, C., F. Geiger, P.M. Edwards, W. Dube, G. Petron, J. Kofler, A. Zahn, S.S. Brown, M. Graus, J.B. Gilman, B.M. Lerner, J. Peischl, T.B. Ryerson, J.A. de Gouw, and J.M. Roberts. 2014. Volatile organic compound emissions from the oil and natural gas industry in the Uintah Basin, Utah: Oil and gas well pad emissions compared to ambient air composition. Atmos. Chem. Phys. 14:10977–10988. doi:10.5194/acp-14-10977-2014.
- WRAP. 2015. Oil/Gas emissions workgroup: Phase III Inventory. https://www.wrapair2.org/phaseiii.aspx (accessed July 2017).