
ABSTRACT
Aeolian dust episodes (ADEs) have been an emergency disaster in the Kaoping River Valley during the rainy season (May-September), which can severely deteriorate ambient particulate air quality in the region surrounding the Kaoping River. Thus, this study aims to characterize the metallic fingerprint of Aeolian dust (AD) and investigate the effects of ADEs on ambient particulate air quality along the Kaoping River Valley. Four manual sampling sites adjacent to the riverside were selected to collect fine (PM2.5) and coarse (PM2.5–10) aerosol samples during and after the ADEs in the periods of six events. A total of 13 metallic elements were analyzed using an inductively coupled plasma-atomic emission spectrometer. With metallic elements analysis and nonparametric statistical methods of Wilcoxon rank-sum test and Kruskal-Wallis test, this study successfully derived the metallic indicators of ADEs. The mass ratios of crustal elements (Fe, Ca, or Al) to reference element (Cd) obtained during the ADEs were much higher than those obtained after the ADEs. High mass ratios of Fe/Cd, Ca/Cd, and Al/Cd in PM2.5-10 were observed on the influenced areas of ADEs. Among them, (Fe/Cd)2.5-10 was proven as the best indicator which can be applied to effectively validate the existence of ADEs and evaluate their influences on ambient air quality. Moreover, PM2.5 concentrations during the ADEs were 3-3.6 fold higher than those after the ADEs. PM2.5 should be a contributor to AD, even though the mass ratios of PM2.5/PM10 ranged from 0.05 to 0.20 during the ADEs. Our findings provide valuable information regarding the characteristics of the AD during the ADEs in the Kaoping River.
Implications: Indicators of (Fe/Cd)2.5-10 are approximately applied to observe the effects of ADEs. Local governments could realize the mechanisms of S- and NW-type aeolian dust episodes (ADEs). They can cause deterioration in different ways for the regional air quality surrounding Kaoping River Valley. Residents who have been living in the influenced areas can take precautions to prevent damage from aeolian dust. Strategies for curbing ADEs must reduce the area of bare lands by artificial measures in the long period of the sunny days during the rainy season. Future research should examine physical conditions of topsoils and other chemical composition in aeolian dust.
Introduction
More than 90% of atmospheric particulate matters (PMs) in nature are derived from arid and semi-arid areas under various weather conditions. Suspended PMs in the atmosphere play a vital role on the physical, chemical, and optical effects, such as ambient air quality, atmospheric visibility, and radiative forcing (Claiborn et al. Citation2011; Tsai et al. Citation2010; Wang et al. Citation2015). Poor atmospheric visibility is highly related to PMs, resulting from the extinction of visible light by fine particles (Cheng et al. Citation2015). Moreover, such natural fugitive dust could also cause health problems if fine particles existed in connection with coarse particles suspended in the air. Previous studies reported that trace elements in the dust closely associate with the propagation of cardiovascular and respiratory diseases, which have been recognized as an important risk factor for health in human and animal tests (Kuo et al. Citation2014; Paramasivam, Ramasamy, and Suresh Citation2015). Metallic contaminants in the dust influence human health when it is transported to densely populated area.
In East Asia, Asian continental dust originating from deserts in central Asia and northwestern China could travel eastward to Korea Peninsula, to the Japan Islands, and even to the western coast of the American continent (Lin et al. Citation2005; Tsai et al. Citation2014). While such particles move southward with airflow, they commonly increase the daily PM10 concentrations as high as 3–6 times and severely deteriorate the ambient air quality only in northern Taiwan during the drought season (November–April) while northeastern monsoons blow (Lin and Yeh Citation2007; Tsai et al. Citation2014). However, another type of natural dust, aeolian dust (AD), which occasionally occurred and originated from the arid riverbed in southern Taiwan has frequently been recorded by the Taiwan EPA only during the rainy season (May–October) (Lin and Yeh Citation2007; Taiwan EPA Citation2008). The occurrence of AD could cause the hourly PM10 concentrations to rise as high as 8–15 times (Kuo et al. Citation2014; Lin and Yeh Citation2007). AD is sedimentary deposit produced from the finest (silt-sized) fraction of planetary regolith that is carried in suspension and distributed by atmospheric activity (Ruff et al. Citation2014). The physical characteristics of AD are similar to Asian continental dust, but their formation mechanisms and emission sources are entirely different.
On Taiwan Island, major rivers flow westward or eastward since the Central Mountain Range extends from the north to the south and covers approximately two-thirds of the entire island. The extreme steepness of the riverbed in the upstream sector of the rivers causes a huge amount of sediment yields of fine silt that accumulates in the downstream catchment of the rivers, leading to the formation of large areas of bare lands. Once alluvium soils contain less than 1.22% moisture content, they can be blown and form AD in the air (Taiwan EPA Citation2008). Taiwan EPA (Citation2008) reported that up to 19% of PM10 was attributed to AD in Taiwan and the mass ratios of PM2.5–10/PM10 could be an index to classify primary sources, such as AD or mechanical activities (Kuo et al. Citation2009; Li et al. Citation2015). Accordingly, AD episodes (ADEs) occur mostly during the drought season (October–April) on Taiwan Island (Chen et al. Citation2015; Kuo et al. Citation2009; Taiwan EPA Citation2008).
However, Kaoping River, with the largest catchment of approximately 3,257 km2, is the only river flowing southward on Taiwan Island. The Water Resources Agency (Citation2013) reported that nearly 254 Mm3 of sands was eroded by heavy rains induced by Typhoon Morakot in 2009. Water flows carried a massive amount of alluvial soils to the downstream reaches of the Kaoping River. In fact, alluvial soils on the surface of bare lands along the Kaoping River Valley can become dry in a few days due to strong solar radiation in southern Taiwan, which makes dry alluvial soils become the potential sources of AD during the ADEs in the rainy season. Both thermal convection and sea winds as dynamic weather phenomena usually occurred at approximately noon along the Kaoping River Valley. Instant winds can immediately blow great amounts of dust from alluvium soils on the surface of bare lands along the Kaoping River. Additionally, typhoons commonly occur during the rainy season, and air blown from the outflow circulations can enter at the estuary of the Kaoping River while typhoons pass through the offshore of northeastern or southeastern Taiwan. As long as wind speeds reach a threshold speed, the AD occurs and can travel along the river course of the Kaoping River. During the ADEs, very poor air quality is observed, and atmospheric visibility can drop down to less than 500 m (Yuan et al. Citation2006).
Accordingly, this study aims to characterize the metallic fingerprint of the AD and investigate the effects of ADEs on ambient particulate air quality along the Kaoping River. With metallic elements analysis and nonparametric statistical methods, the indicators of ADEs were determined. Moreover, the mechanisms of AD generated from dried alluvium soils covering the surface of bare lands along the Kaoping River were also studied.
Experimental methods
Data collection during and after aeolian dust episodes
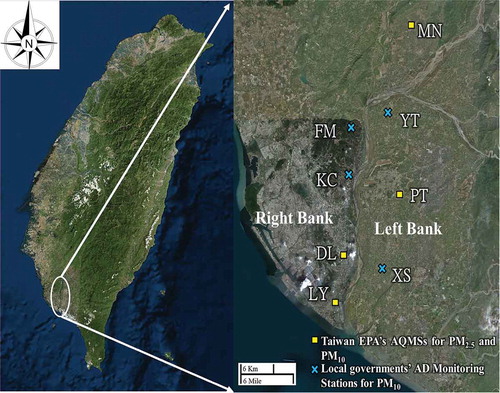
The Taiwan EPA (Citation2008) reported two definitive criteria for ADEs: (1) an average hourly PM10 concentration higher than 150 μg/m3 and (2) a mass ratio of PM2.5 to PM10 (PM2.5/PM10) lower than 0.3. When PM measurements at automatic air quality monitoring stations (AQMSs) met these criteria, highly PM concentrations were recognized as ADEs. Daily and hourly averages of PM2.5, PM10, wind direction, and wind speed were obtained from four of the Taiwan EPA’s air quality monitoring stations (AQMSs: Meinong [MN], Pingtung [PT], Daliao [DL], Linyuan [LY]) and four AD monitoring stations established by local governments (i.e., Kaoping River Weir Management Center [Site KC], Fo-Guang-Shan Buddha Memorial Center [Site FM], Yutian Elementary School [Site YT], and Xinsing Elementary School [Site XS]) distributed throughout 22 townships in Kaohsiung City and Pingtung County along the Kaoping River. The data were collected during six ADEs, on July 2, 24, and 30, August 6 and 21, and October 6, 2013. These days of July 2, 24, and 30, and August 6, 2013, could be classified as S-type ADEs and the days of August 21 and October 6, 2013, would be regarded as NW-type ADEs based on the prevailing wind directions. The locations of the four AQMSs and four AD monitoring stations are shown in . Only four AQMSs were capable of monitoring PM2.5 concentrations for regional ambient air quality, but all stations could monitor PM10 concentrations. The measured PM fractions and brief descriptions of all the stations are provided in .
Table 1. The measured PMs fraction and brief information on the monitoring stations located along the Kaoping River.
Figure 1. Location of AD monitoring stations for PM10 (i.e., manual sampling sites, including XS: Xinsing Elementary School; YT: Yutian Elementary School; FM: Fo-Guang-Shan Buddha Memorial Center; KC: Kaoping River Weir Management Center) and AQMSs for PM2.5 and PM10 (LY: Linyuan Station; DL: Daliao Station; PT: Pingtung Station; MN: Meinong Station) distributed along the Kaoping River in southern Taiwan.
Ambient particulate matter sampling sites and modes
In this study, four manual samplers of PM2.5 and PM2.5–10 were employed at the AD monitoring stations (i.e., Sites KC, FM, YT, and XS) for examining the metallic characteristics of the ADEs. Both Site KC and Site FM were located on the right bank of the Kaoping River. Site KC was located on the rooftop of the Kaoping River Weir Management Center, 5 m and 150 m from the Kaoping River and Road No. 21, respectively. Its location was directly influenced by potential sources of the AD and vehicular exhaust. Site FM was established behind hills on the roof of Fo-Guang-Shan Buddha Memorial Center. Site FM was possibly influenced by vehicular exhaust because it was very close to a parking lot. Additionally, Site YT and Site XS were located on the rooftop of a four-story building at Yutian and Xinsing Elementary Schools, respectively, on the left bank of the Kaoping River. Moreover, Site YT was located in Ligang Township and was surrounded by an extensive fluvial basin where two upstream branches of the Kaoping River converge. The ADEs directly influenced ambient air quality at Site YT when the northwestern winds blew substantial amounts of the AD. Site XS was surrounded by houses and farmlands where the farmers burned agricultural debris after harvesting. The wind field at Site XS was usually unstable because of interference from the houses.
PM2.5 and PM2.5–10 were simultaneously collected on two separate quartz fiber filters by using a high-volume sampler (Tisch, model TE-6070D) equipped with a cascade impactor for PM2.5–10 and PM2.5 (Tisch, model 231), which was certificated by the U.S. EPA. PM2.5 was collected on the bottom filter, whereas PM2.5–10 was collected on the top filter. PM10 concentrations were determined by summing the PM2.5–10 and PM2.5 concentrations. Previous studies have adopted this method for measuring both PM2.5 and PM2.5–10 for chemical analysis and have reported that this method was effective for simultaneously measuring PM2.5 and PM2.5–10 (Kuo et al. Citation2013, Citation2009). All atmospheric PM samples were collected at a volumetric flow rate of 1.2 m3/min, according to the standard NIEA A102.12A method. The ADE samples were manually collected simultaneously at the four manual sampling sites on July 2, 24, and 30 and August 6, 2013, for S-type episodes and on August 21 and October 6, 2013, for NW-type episodes. The sampling of the AD was conducted in two sequential phases. Phase one was 3–4 hours in duration and was conducted during the ADEs, whereas phase two was initiated after the ADEs and ended at 8:00 a.m. on the following day.
Collection of alluvium soils from the surface of bare lands along the Kaoping River
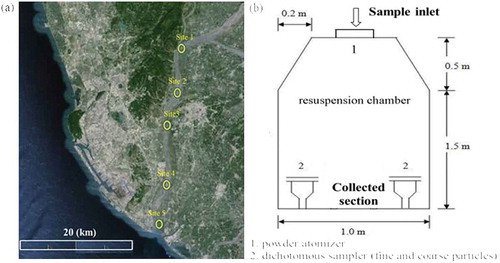
To examine the metallic elements of alluvium soils, we reached the bare lands in the middle of riverbed when the water levels dropped as low as 5 cm above the surface of soils. A total of 30 samples at five representative sites shown in were collected at 0.5 cm beneath the surface of bare lands of the Kaoping River following the standard method NIEA S103.61, where prevailing winds can lift the dried soils to the air. After the collection processes, the samples acquired at the same site were thoroughly mixed and then sieved with a Tyler 400 mesh (dp < 38 μm) to produce a sieved alluvium soil samples weighing more than 5 g. Finally, each sample was reduced to a weight of 5 g and then resuspended using a dry powder atomizer in a resuspension chamber (1 × 1 × 2 m) as shown in , simulating the resuspended alluvium soils in the air. The samples of alluvium soils were divided into two fractions of PM2.5 and PM2.5–10 using a virtual impactor with a 10-μm separator at the inlet of the dichotomous sample set in a resuspension chamber. Subsequently, further chemical analyses were conducted to investigate the metallic elements in the soil samples (Tsai et al. Citation2010; Yuan et al. Citation2006).
Figure 2. (a) Location of sites for collecting alluvium soils along Kaoping River. (b) Resuspension chamber used for collecting resuspended fine (PM2.5) and coarse (PM2.5–10) particles.
Metallic element analysis of particulate matter samples
Following the standard NIEA A307.10C method of the chemical analysis of the metallic element in PMs, one-quarter of each quartz fiber filter was cut and then digested by using a microwave digestion method. During digestion, the quartz fiber filters were mixed with a digestive solution containing 5.55% HNO3 and 16.75% HCl at 150–200°C for 2 hr, and the solution was then diluted to 50 mL with distilled deionized water (D.I. H2O). The metallic elements of PM2.5–10 and PM2.5, including Na, Ca, Al, Fe, Mg, K, Zn, Cr, Ti, Mn, Cd, Ni, and Pb, were analyzed using an inductively coupled plasma–atomic emission spectrometer (ICP-AES; Perkin Elmer 2400 SeriesⅡ). The sampling and analytical procedures have been described in our previous studies (Li et al. Citation2013; Citation2015; Yuan et al. Citation2006).
To guarantee the analytical quality, a quality assurance and quality control program was executed for chemical analysis. At least 10% of the samples were spiked with a known amount of metallic elements to determine their recovery rates, which varied between 96% and 103%. In addition, duplicate analysis results demonstrated that the relative percentage differences ranged from 3% to 4% for all metallic elements. The determination coefficient of the calibration curve for each element was required to be higher than 0.995, and the check blank had to be less than twice the method detection limit for each metallic element. Moreover, background contamination was routinely monitored through operational blanks (i.e., unexposed filters), which were processed simultaneously with the field samples.
Weather Research and Forecasting (WRF) model
The Weather Research and Forecasting model (WRF version 3.7) is a proposed meteorological model developed by the National Oceanic and Atmospheric Administration (NOAA)/Earth System Research Laboratory (ESRL), which was used to simulate the wind fields during and after the ADE in the studied area in this study. The WRF model provides a user-friendly environment for massively parallel computation by the improved characteristics of nonhydrostatic air flow fields and offers various choices for physical parameterizations (Sun et al. Citation2016). Accordingly, the WRF model was applied to classify the clustered ADEs in this study.
Nonparametric statistics methods
Data with nonnormal distributions can be analyzed through nonparametric statistical methods. This type of statistics uses data that are frequently ordinal, meaning that they do not depend on numbers, but rather on order. If data are unavailable for other related parameters (e.g., mean, sample size, standard deviation), nonparametric statistics is more suitable than parametric statistics is for analyzing measured samples. Thus, for the present study, the measured parameters of the ADE samples collected in the periods during and after the ADEs were compared using the Wilcoxon rank-sum test. This test was applied to compare two independent parameters for which the measurements were the least ordinal. If the ranks of two sample groups are significantly independent, then the test statistic identifies a significant difference. The Kruskal–Wallis test assesses significant differences in a continuous dependent variable by grouping independent variables (variables with three or more groups). It is assumed that the distribution of each group is not normal and that the variance in the scores differs significantly for each group. Accordingly, the Kruskal–Wallis test was employed to compare the metals in the alluvium soils on the surface of the Kaoping River (Kuo et al. Citation2010; Taiwan EPA Citation2008). IBM SPSS 19.0 software was used to perform the statistical analyses in this study.
Results and discussion
Types of aeolian dust episodes
In the present study, in total, six ADEs occurred on the Kaoping River according to the hourly average PM10 concentrations and meteorological conditions recorded by the four AD monitoring stations (i.e., KC, FM, YT, and XS) during the rainy season in 2013. The ADEs were divided into two typical types: S-type episodes affected by southern winds (July 2, 24, and 30 and August 6, 2013) and NW-type episodes affected by northwestern winds (August 21 and October 6, 2013), which are presented in (a–p: S-type ADEs; q–x: NW-type ADEs). A comparison of the data retrieved from the AD monitoring stations revealed that Site KC, which was adjacent to exposed areas, was adequate for observing the influence of the ADEs under the prevailing southern winds. The hourly maximum PM10 concentrations climbed to 777 μg/m3 on July 2, 338 μg/m3 on July 24, 690 μg/m3 on July 30, and 511 μg/m3 on August 6 within 3–4 hr. However, the hourly average PM10 concentrations were 35.6 ± 26.6 μg/m3 at Site KC during the rainy season in 2013. The PM10 concentration was higher during the ADEs than on regular days, by as much as 9–22 times. These results evidenced that AD was the leading cause of deteriorating ambient air quality along the Kaoping River.
Figure 3. Wind direction and hourly PM10 concentrations of (a)–(d), (e)–(h), (i)–(j), and (m)–(p) were measured on July 2, 24, and 30 and August 6, 2013, in the S-type ADEs; (q)–(t) and (u)–(x) were recorded on August 21 and October 6, 2013, in the NW-type ADEs. The lines of each circular layer illustrate different PM10 concentrations, which gradually increase from the inner circle to the outer circle, whereas the dots represent the wind directions and PM10 concentrations.
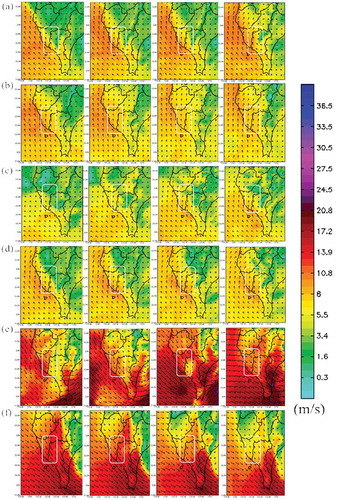
Previous studies have reported that topographical features varied the wind field over river valleys (Li et al. Citation2015; Lin et al. Citation2005; McGowan and Clark Citation2008). The PM10 concentration levels and their spatial distribution differed significantly at the AD monitoring stations along the Kaoping River. displays that the significant differences detected in PM10 concentrations at four AQMSs between the S- and NW-type ADEs. The two types of ADEs were classified by their prevalent wind directions, while the PM10 concentrations drastically increased accordingly. Hourly surface wind fields with S- and NW-type ADEs were simulated as shown in and ), respectively. These figures explained why the ADEs were divided into S- and NW-type ADEs along the Kaoping River in this study. The S-type ADEs could be attributed to thermal convections induced by the southwestern monsoon based on the results of simulated wind fields (Tsai et al. Citation2010). Particularly, the NW-type ADEs occurred when two typhoons passed northern Taiwan in 2013, as recorded by the TCWB. When typhoons Trami and Fitow were approaching the open seas near northern Taiwan, their outflow anticlockwise circulated, as illustrated in Figure S1, entering the estuary of the Kaoping River. During the period of Typhoon Fitow on October 6, PM10 concentrations escalated to 920 μg/m3 at Site YT and 287 μg/m3 at Site XS, respectively. The PM10 concentrations measured at the left bank sites were much higher than those measured at the right bank sites during the NW-type episodes. These results indicated that the NW-type episodes mainly influenced the left bank of the Kaoping River. Overall, both S- and NW-type ADEs commonly resulted in high PM10 concentrations.
Figure 4. Simulated hourly surface wind fields on July 2, 24, and 31 and August 6 during the S-type ADE periods (a–d) and on August 21 and October 6 during the NW-type ADE periods (e–f).
Roles of PM2.5 and PM2.5–10 during aeolian dust episodes
This study adopted the PM2.5 and PM10 concentrations measured by the Taiwan EPA’s AQMSs (i.e., LY, DL, PT, and MN) for further interpreting the impact of ADEs. The manual AD stations (i.e., KC, FM, YT, and XS) monitored only PM10 concentrations. The monthly average PM10 and PM2.5 concentrations during 2007–2013 and the daily PM10 and PM2.5 concentrations during the ADEs are summarized in Figures S2 and S3, respectively. As demonstrated therein, PM2.5 and PM10 concentrations were much lower in the rainy season than in the drought season. Comparison of PM10 and PM2.5 between the ADEs and regular days in 2007–2013 revealed that PM10 concentrations during the ADEs were 3.49–5.52 times higher than those on regular days at all stations except the LY station located at the estuary of Kaoping River because of its good air dispersion conditions, while PM2.5 showed no significant increase during the ADEs. Moreover, the data obtained from the DL, PT, and MN stations revealed that the daily average PM10 concentrations at these stations were mostly less than 50 μg/m3 on regular days in the rainy season. There were no other major PM10 emission sources to influence ambient particulate air quality on regular days. By contrast, the percentages of daily average PM10 concentrations over 125 μg/m3 caused by aeolian dust were 16.76%, 12.44%, and 9.52% at the DL, PT, and MN stations, respectively, in the rainy season. The results concluded that aeolian dust leads to the poor ambient air quality in the Kaoping River in the rainy season.
demonstrates a noticeable increase in PM10 concentrations at the four AQMSs influenced by AD along the Kaoping River. During all events, the PM10 concentrations measured at the most influenced stations increased drastically between 11:00 a.m. to 15:00 p.m. (local time). The resuspended AD had an influence on the DL, PT, and MN stations during S-type episodes, but none on the LY station because it was located on the upwind side. The hourly variation in the PM10 concentrations monitored at the DL, PT, and MN AQMSs demonstrated the varying levels of influence of the ADEs. Hence, the locations of most potential bare lands along the Kaoping River were moveable since heavy rains can rapidly vary their locations and area during the rainy season. Thus, ADEs in southern Taiwan were produced by a higher number of conditions than those in central Taiwan. and depict the MN station, which was located in the upstream reaches of the Kaoping River and was the most obviously influenced by the S-type ADEs (hourly PM10 concentrations up to 409 and 320 μg/m3). These results suggested that bare lands that are evenly spaced along the river are the main factor causing such drastic increases in PM10 concentrations for MN at noon. and demonstrate that the PT and DL stations, respectively located in the midstream and downstream areas of the Kaoping River, were partially affected by the S-type ADEs, whereas the MN station did not have a similar pattern. The drastic increase in the PM10 concentrations measured at middle river regions was attributed to the bare lands located at the estuary. Moreover, and illustrate that the highest PM10 concentrations were measured at the PT station on August 21 and October 6 during NW-type episodes. The Kaoping River flows southward, curving midstream near Site KC, where considerable amounts of fine sands are deposited, and then turns into regular bare lands. Therefore, in addition to the location of bare lands, various wind directions are key factors of ADEs in the rainy season (Lin and Yeh Citation2007; Wang et al. Citation2015; Wang and Ogawa Citation2015). If the areas of bare lands were reduced through artificial measures before the rainy season, the effects of ADEs would be decreased along the Kaoping River. The location of bare lands along the Kaoping River is a subject worth further exploring because they can induce high PM10 concentrations for receptor areas during ADEs.
Figure 5. Diurnal variations of PM10 were recorded at AQMSs on July 2, 24, and 31, August 6 and 21, and October 6, 2013, during the six ADEs (LY: Linyuan Station; DL: Daliao Station; PT: Pingtung Station; MN: Meinong Station).
In the present study, we selected representative AQMSs that were the most influenced by the ADEs to plot , which illustrates the diurnal variations in PM2.5, PM10, and PM2.5–10/PM10 during the ADEs. As shown in , the diurnal variations in PM2.5–10/PM10 during the ADEs (0.8–0.95) were mostly higher than those before the ADEs (<0.6) at the four AQMSs. The results indicated that PM2.5–10 was the dominant fraction of PM10 causing poor ambient air quality during the ADEs in the rainy season (Chen et al. Citation2015; Lim et al. Citation2018) and evidenced that ADEs originated from alluvium soils on the Kaoping River. However, the obtained PM2.5–10/PM10 values did not show a similar consistent pattern. Three possible explanations for this inconsistency follow: (1) The resuspended AD were persistently suspended in the air because of valley topography of Kaoping River. and show that the average PM2.5–10/PM10 values recorded at the MN station in S-type episodes were higher than 0.7, thus fulfilling a requirement of ADEs. The MN station is located near mountains, which interfered with the wind fields and caused the accumulation of AD in the air. (2) The influence of anthropogenic sources was dominant after the ADEs. , , and demonstrate that PM2.5/PM10 drastically increased, because the PT station is situated on the downwind side of the anthropogenic sources. (3) The influence of the persistent outflow of typhoons or potential areas on the AD is presented in and . Although the NW-type episodes were caused by both typhoons Fitow and Trami, they differed in the levels of influence at the PT station. Rainfall gradually decreases at the end of the rainy season, and the potential area of the AD increases simultaneously. Rainfall might be the primary factor contributing to the difference between and .
Figure 6. Variations of PM2.5, PM10, and ratios of PM2.5–10/PM10 recorded at some specific monitoring stations, the most influenced by aeolian dust, during and after the episodes (labels on the left corner represent ADE type–AQMS–sampling date).
Metallic composition of alluvium soils in Kaoping River
summarizes the mass of the metallic elements (μg/g) in PM2.5 and PM2.5–10 that were resuspended from the sampled alluvium soils. The contents of Pb, Zn, K, and As (p > 0.05) in the PMs in the upstream reaches were slightly higher than those in the PMs in the downstream reaches of the Kaoping River. The steel–iron industrial complexes (i.e., Linhai and Dafa industrial complexes) situated at the estuary on the right bank of the Kaoping River are mainly responsible for this occurrence. The particle-bound trace metals emitted from these industrial complexes can be transported by sea breezes and then deposited on the surface of alluvium soils in the upstream area of the Kaoping River finally (Tsai et al. Citation2010).
Table 2. Metallic contents of resuspended alluvium soils collected in the Kaoping River.
Previous studies have demonstrated that crustal elements (CEs: Fe, Ca, or Al) are the most abundant crustal metals in the background levels of surface alluvium soils (Kothai et al. Citation2008; Kuo et al. Citation2009; Hieu and Lee, Citation2007; Orozco et al. Citation2015). The crustal elements constituted the majority of metallic element in alluvium soils along the Kaoping River in this study, which was similar to the metallic elements found in the alluvium soils distributed along the Jhuoshuei River in central Taiwan (Chen et al. Citation2015; Kuo et al. Citation2009; Taiwan EPA Citation2008). As shown in , the contents of CEs in both resuspended samples of PM2.5 and PM2.5–10 differed nonsignificantly (p > 0.05) as sampled from the five alluvium soil sampling sites. They were also major compositions of metallic elements in the alluvium soils that originated from similar upstream parent rocks. The mass concentrations of CEs in PM2.5–10 were much higher than those in PM2.5. These results are consistent with the results mentioned in the section Roles of PM2.5 and PM2.5–10 during Aeolian Dust Episodes, which illustrates that the proportions of PM2.5–10 affected by the resuspended fluvial soils were much higher than those of PM2.5 at the AQMSs. Fe was the most abundant metal found in the resuspension experiment. Relatively high contents of Fe2.5, ranging from 3,000 to 4,000 μg/g, and Fe2.5–10, ranging from 6,500 to 9,800 μg/g, are not commonly observed in Earth crust (Kuo et al. Citation2009; Mead, Herckes, and Majestic Citation2013), but might be attributed to anthropogenic contributors, such as iron–steel manufacturing and smeltery works (Tsai et al. Citation2010; Orozco et al. Citation2015). Notably, the largest and most active integrated steel mills are located in Hsiaokang District, southern Kaohsiung, about 10 km away from the Kaoping River. Accordingly, Fe can be regarded as a unique metallic element in the Kaoping River, which significantly differs from other rivers where Al dominates (Yuan et al. Citation2006; Wang et al. Citation2015).
For the metallic element of Mn, significant differences (p < 0.05) were detected in the PM2.5 and PM2.5–10 of the alluvium soils. Mn was not evenly distributed along the Kaoping River because of the oxygen scavenging and deoxidizing roles of ferromanganese in steel manufacturing process (Colledge et al. Citation2015). Mn was possibly produced and emitted by the large-scale integrated steel mills in Taiwan located near the downstream reaches of Kaoping River. Thus, manganese compounds could have adhered to the surface of PM and then deposited on the Kaoping River through wet or/and dry deposition (Chen et al. Citation2015; Colledge et al. Citation2015; Li et al. Citation2015). Although comparatively high levels of Mn (100–650 μg/g) were observed in the alluvium soils along the Kaoping River, Mn is not a suitable element for evaluating the influence of ADEs. Mg2.5–10 also differed significantly (p < 0.05) among the five sites along the Kaoping River. The results revealed that the concentration of Mg2.5–10 in the downstream reaches was generally higher than that in the upstream reaches, indicating that a proportion of the Mg2.5–10 concentration originated from oceanic spray and the mixing of the river and seawater at the estuary of the Kaoping River (Paramasivam, Ramasamy, and Suresh Citation2015).
Previous studies have indicated that the trace metallic elements such as Pb, Zn, Ti, and As emitted from either metallurgical processes or human activities can be identified as anthropogenic particles (Kumar et al. 2012; Wu et al. Citation2011; Yang et al. Citation2016). These particles are useful markers for apportioning potential pollution sources and then evaluating the contributions of the sources. The metallic elements Pb and Zn are often considered markers associated with traffic sources, while Zn and Ni could be partly associated with motor vehicle emissions (Cao et al. Citation2009; Kothai et al. Citation2008). K was associated with particles emitted from coal combustion and biomass burning. Although moderate concentrations (10–100 μg/g) were presented in PM2.5 and PM2.5–10, the trace elements exhibited no significant difference (p > 0.05) in the alluvium soils samples. These results implied that the different industrial processes occurring near the banks of the Kaoping River emitted particles suspended in air, which then deposited through gravity on the surface of Kaoping River. Over a long period, they became minor components of the alluvium soils along the Kaoping River (Tsai et al. Citation2010). The contents of Cd and Cr in PM2.5 and PM2.5–10 were less than 10 μg/g and did not differ significantly among the sites (p > 0.05). Their mass contents approached the background elements of the alluvium soil samples which can be assigned to reference elements.
In brief, most metals in the resuspension of both PM2.5 and PM2.5–10 of the alluvium soil samples did not differ significantly among the sampling sites (p < 0.05), except for Ni2.5, Mn2.5, Mn2.5–10, and Mg2.5–10. It can be concluded that the constituents of metals in alluvium soils had no distinctive difference from the upstream to downstream reaches. Tsai et al. (Citation2010) indicated that sea–land breezes as a prevailing weather condition in the insular climate usually carry the air pollutants emitted from the industrial complexes located in southern Kaohsiung, thus affecting air ambient quality along the Kaoping River. Hence, the sea–land breezes are effects of the insular climate and account for the homogeneous distribution of the metal contents in alluvium soils.
Concentration variations and enrichment factors of metals in PM2.5 and PM2.5–10
As mentioned in the Section of Metallic Composition of Alluvium Soils in Kaoping River and illustrated in and , we have not ascertained the roles of different PM sizes in AD after the ADEs in this study. Thus, we integrated the mass concentrations of PM2.5, PM2.5–10, PM10, and PM2.5/PM10 from the manual samples at the AD monitoring stations for the periods during and after the ADEs, as shown in . The mean mass concentrations of PM2.5, PM2.5–10, and PM10 were much higher during the ADEs than those after the ADEs. Moreover, a significant difference (p < 0.05) was detected in the concentrations during and after the ADEs. The mean PM2.5 concentrations during the S- and NW-type ADEs were 3.6 times and 3.3 times higher than those after the S- and NW-type ADEs, respectively. By contrast, the mean PM2.5–10 concentrations during the S- and NW-type ADEs were approximately 15.3 and 8.83 times higher, respectively, than those after the S- and NW-type ADEs. Furthermore, the mass ratios of PM2.5/PM10 values after the S- and NW-type ADEs were 1.96 times and 1.39 times higher, respectively, than those during the S- and NW-type ADEs. These results evidenced that the proportion of PM2.5 in PM10 at the manual sampling sites increased after the ADEs, whereas PM2.5–10 concentrations along the Kaoping River increased during the ADEs. Chen et al. (Citation2015) reported that AD promoted the formation of fine particle aggregations, thereby causing a higher proportion of PM2.5 after the ADEs. The mass ratios of PM2.5 or PM2.5–10 in PM10 obviously differed in the periods during and after the ADEs. Higher mass ratios of PM2.5–10/PM10 suggested that the AQMSs were influenced by AD. Based on the results of the resuspension experiment, high contents of crustal elements, such as Fe, Ca, and Al, were found in the AD. Therefore, they may be regarded as representative elements for evaluating the effects of ADEs.
Table 3. Concentrations of PM2.5, PM2.5–10, and PM10 during and after the S- and NW-type ADEs at the manual sampling sites.
and illustrate the metallic element contents in PM2.5 and PM2.5–10 at the manual sampling sites along the Kaoping River both during and after the S- and NW-type ADEs. During the S- and NW-type ADEs, Fe was the most abundant element in PM2.5 (1.47–4.05%) and PM2.5–10 (3.29–9.37%), followed by Ca in PM2.5 (1.43–2.64%) and PM2.5–10 (2.94–4.74%), and Al in PM2.5 (1.56–2.47%) and PM2.5–10 (2.55–3.93%). This showed that crustal elements (i.e., Fe, Al, and Ca) dominated both AD PM2.5 and AD PM2.5–10 collected at the sampling sites during the ADEs. Similarly, the crustal elements in the AD (both PM2.5 and PM2.5–10) were consistent with those of the alluvial soils (see ). Moderate mass percentages of Mg, K, Mn, Ti, and Zn in PM2.5 (0.33–0.82%) were obtained, followed by As, Ni, Pb, and Cr with concentrations ranging from 0.08% to 0.15%. Cd as a trace element with a mass percentage was lower than 0.02% in PM2.5. In PM2.5–10, the range of mass percentages of Mg, K, Mn, Ti, and Zn was 0.43–1.10%, and the range for Ni, Pb, and Cr was 0.15–0.29%. The lowest mass percentage observed was that of Cd in PM2.5–10 (<0.02%). The trace elements (i.e., Mn, Zn, Ni, Ti, As, Pb, Cr, and Cd) in the AD didn’t show the consistency with the alluvial soils. Accordingly, crustal elements dominated both alluvial soils and AD, but trace elements in the AD PM2.5 were somehow influenced by anthropogenic sources (Lim et al. Citation2018). Overall speaking, the chemical differences between alluvial soils and AD were found mainly in the trace metallic elements of PM2.5 fraction in the AD.
Figure 7. Metallic contents and mass percentage of CM in PM2.5 and PM2.5–10 at manual sampling sites (a) during and (b) after the S- and NW-type ADEs.
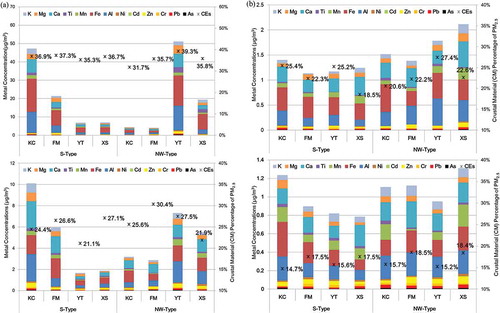
Moreover, crustal material (CM) represents the sum of Al, K, Fe, Ca, Mg, Ti, and Si (Marcazzan et al. Citation2001). Cheung et al. (Citation2011) indicated that each of these materials could be multiplied by a respective conversion factor to account for their common oxides, as represented by the following equation:
Si could be estimated by multiplying Al by a factor of 3.41 (Cheung et al. Citation2011; Hueglin et al. Citation2005), since it was not measured generally with ICP-AES in this study. A comparison of the CM in PMs between the periods during and after the ADEs is depicted in and . The mass percentages of CM during the ADEs were 32.8–39.9% in PM2.5–10 and 21.7–29.9% in PM2.5, which were higher than those in the period after the ADEs, at 16.3–24.6% in PM2.5–10 and 16.3–28.0% in PM2.5. The contents of CM in PM2.5–10 during the ADEs were lower than those after the ADEs. An explanation for this result was that the influence of AD mainly originating from the alluvium soils on the surface of the Kaoping River was not obviously found after the ADEs (Hieu and Lee Citation2007).
The total mean mass percentages of trace metals (such as As, Ni, Pb, Cr, Mn, and Zn) in PM2.5 were approximately 1.76 times higher than those of trace metals in PM2.5–10 during the ADEs. In the period after the ADEs, their total mean mass percentages in PM2.5 were approximately 1.33 times higher than those in PM2.5–10. The average ratio between trace metals in PM2.5 and PM2.5–10 was higher than 1.08, suggesting that they were more concentrated in PM2.5 after the ADEs since the AD was not dominant source in the air and trace metals in PM2.5 generally emitted from anthropogenic source (Marcazzan et al. Citation2001; Wu et al. Citation2011). High mean PM2.5/PM2.5–10 ratios are associated with combustion- and traffic-related elements, such as Pb, Zn, Ni, Cr, and As. Thus, the higher trace metals in PM2.5 during the ADEs might be attributable to traffic exhaust and industrial combustion (Kumar et al. 2012; Yang et al. Citation2016). Venter et al. (Citation2017) discovered that the trace metal species in PM2.5 from industrial activities were over 70%. By contrast, the significant influence of wind-blown dust was reflected by the finding of ≥30% of trace metals occurring in PM2.5–10. In the present study, we also discovered that, in contrast to crustal material, the trace metals tended to accumulate in PM2.5 rather than PM2.5–10. After the ADEs, the mean levels of selected trace metals in PM2.5 increased to 35–167%, and As, Pb, Cr, and Mn levels increased to 139%, 108%, 147%, and 167%, respectively. In addition, the mean levels of coarse mineral metals increased to 34–66% after the ADEs, whereas Fe, Ca, Al, and Mg levels increased to 34%, 47%, 52%, and 66%, respectively. Although the particle size distribution of most metallic elements in the AD was fairly similar, the differences between the periods during and after the ADEs were identified. Pollution roses confirmed the influence of AD on trace metal concentrations in the samples measured during the ADEs, and the impact of industrial and anthropogenic activities was substantiated until after the ADEs (Yang et al. Citation2016). Therefore, ADEs caused by thermal convection or the outflow of typhoons can not only increase the magnitude of crustal elements because of the AD but also transport the abundant metals from anthropogenic sources away from the Kaoping River.
According to the results in the section Concentration Variations and Enrichment Factors of Metals in PM2.5 and the PM2.5–10, we inferred that metallic elements in resuspended PM samples were attributed to the alluvium soils along the Kaoping River during the ADEs. When the enrichment factor (EF) of a given metallic element far exceeds 10, the extent of enrichment is significant for that element compared with its crustal composition (Cao et al. Citation2009; Li et al. Citation2015). Thus, to realize the relation among the selected metal elements and their possible sources, EF has been widely used to apportion specific metals that originated from anthropogenic or crustal sources (Chen et al. Citation2015; Venter et al. Citation2017). displays the mean and standard deviation of the EF analysis for all analyzed elements in PM2.5 and PM2.5–10 during and after the ADEs. For PM2.5–10 in the S- and NW-type ADEs, the mean EFS for Ti, Fe, and Ca approached nearly unity, indicating that these metals originated from the alluvium soils on the surface of bare lands along the Kaoping River. The moderate EFS of the Cr, As, Pb, Mn, Mg, K, and Ni suggested that they originated from both crustal and noncrustal sources. However, the mean EFS of Ti, Fe, and Ca in PM2.5 during the ADEs were similar to those in PM2.5–10. Cr was the most enriched metallic element in PM2.5 during the NW-type ADEs, followed by As, Pb, Zn, Ni, and K with mean EFS ranging from 1 to 10. During the S-type ADEs, the most enriched element in PM2.5 was As, followed by Cr, Pb, Ni, Zn, and K with EFs ranging from 1 to 10. The EFs of As and Cr in PM2.5 during the S- and NW-type ADEs were much higher than 10, suggesting that they were associated with industrial emissions such as metallurgical industries and coal combustion (Venter et al. Citation2017). By contrast, other metals like Pb, Zn, Ni, and K probably originated from both anthropogenic and mineral sources, and they might have been simultaneously influenced by local traffic activities during the ADEs since the sampling sites were close to traffic arteries (Li et al. Citation2015; Yang et al. Citation2016). However, the concentrations ratio of PM2.5 over PM10 ranged from 0.23 to 0.26, as shown in , which illustrates that coarse particles were dominant in PM samples collected during the ADEs. For PM2.5–10 obtained after the ADEs, the mean EFS of Ti, Fe, and Ca remained approaching unity, suggesting that a few fine alluvium soils remained in suspension in the air following the ADEs (Chen et al. Citation2015; Hieu and Lee Citation2007; Taiwan EPA Citation2008). However, after the ADEs, higher EFS of noncrustal elements such as, As, Cr, Pb, Zn, and K in PM2.5–10 and PM2.5 were obtained, compared with those obtained during the ADEs. The results revealed that anthropogenic activities play a key role in the form of fine particles following ADEs. Moreover, the lowest EFS of trace elements in PM2.5–10 and PM2.5 during and after the ADEs were Cd, whereas the EFs of Fe and Ca were invariant. According to the invariant characteristics of Fe, Ca, and Cd, integrating these elements may be further explaining the differences between periods during and after ADEs (Taiwan EPA Citation2008).
Figure 8. EF values for selected metals with Al as reference elements in PM2.5 and PM2.5–10 obtained during and after (a) S-type ADEs and (b) NW-type ADEs.
Effective metal indicators for identifying ADEs
Several techniques have been used to reveal the sources of airborne material, such as chemical mass balance (CMB) apportionment, positive matrix factorization (PMF), the multilinear engine, principal component analysis (PCA), absolute PCA, the expanded multilinear engine, and confirmatory factor analysis (Gertler, Lowenthal, and Coulombe Citation2012; Li et al. Citation2013; Mead, Herckes, and Majestic Citation2013). The CMB and PMF models were used to estimate the contributions of various sources in four major rivers in central Taiwan (Taiwan EPA Citation2008). The Taiwan EPA (Citation2008) revealed that the mass ratios of Fe/Cd and Al/Cd in PM10 could be employed to determine the effects of ADEs on the air quality in central Taiwan. In the present study, a comparative approach was undertaken for efficiently characterizing the influence of ADEs. The mass ratios of crustal elements to reference elements are assumed to be recognized as indicators for comparatively assessing the decreasing or increasing levels of AD during and after the ADEs (Chen et al. Citation2015; Hieu and Lee Citation2007).
Relatively low levels of Cd and Cr were measured in the alluvium soils, and their contents in PM2.5 and PM2.5–10 differed nonsignificantly among the alluvium soils (p > 0.05) along the Kaoping River, which implied that the contents of Cd and Cr were attributed to the background levels of the Kaoping River. However, their EF values revealed that Cd2.5 and Cd2.5–10 can be assigned to the appropriate reference elements with their EFs lower than 2.7, rather than Cr2.5 and Cr2.5–10 with their EFs higher than 10, supposing these are due to the influences of anthropogenic sources along the Kaoping River. Therefore, compared with Cr, the Cd was more appropriate to be assigned as a reference element. Accordingly, shows the mass ratios of CES/Cd in PM10 as indicators, which attempted to differentiate the chemical characterization of AD in the periods during and after the ADEs. The mass ratios of CES/Cd obtained from the PM10 samples during the ADEs (442–1924) were higher than those obtained after the ADEs (115–166). The results evidenced that the mass ratios of CES/Cd in PM10 during the ADEs to those after the ADE periods were suitable for examining the decreasing levels of ADEs. Since PM10 can be divide into the different size segregations of PM2.5–10 and PM2.5, this study further focused on their mass ratios of CES/Cd.
Table 4. The mass ratios for the crustal elements (Ca, Al, and Fe)/Cd in PM10 during and after the ADE periods.
shows the mass ratios of CES/Cd in PM2.5–10 and PM2.5 from the four manual sampling sites during the ADEs. The CES/Cd values of PM2.5–10 samples obtained during the S-type ADEs at Site KC and Site FM, during the S-type ADEs with the range of 3580–9520, were higher than the range of 400–1137 obtained at Site YT and Site XS since the AD transported over the Kaoping River during the S-type ADEs. By contrast, the measured CES/Cd of 704–6705 in PM2.5–10 samples at and XS sites were higher than those of 85–430 at KC and FM sites during the NW-type ADES. Thus, the results determined the right bank of the Kaoping River to be mostly influenced by the NW-type ADEs, but the left bank was mainly affected by the S-type ADEs, and the CES/Cd in PM2.5–10 ratios can reflect the influence of AD emitted from alluvium soils on the surface of bare lands for ADEs. Higher mass ratios of CES/Cd in PM2.5–10 compared with those in PM2.5, as shown in , indicated the crustal elements mostly distributed in PM2.5–10 (Chen et al. Citation2015; Kuo et al. Citation2010, Citation2013; Taiwan EPA Citation2008). Influence of PM2.5–10 in AD for the representative sites during and after the S- and NW-type ADEs was investigated with the mass ratios (CES/Cd)2.5–10. The mass ratio of (Fe/Cd)2.5–10 was extremely high at Site KC compared with those at other sites (Kuo et al. Citation2010). The highest mass ratio observed at Site KC was (Fe/Cd)2.5–10, followed by (Al/Cd)2.5–10 and (Ca/Cd)2.5–10 during the S-type ADEs. A similar result was also found, such that the highest mass ratio of CES/Cd was (Fe/Cd)2.5–10 at Site YT during the NW-type ADEs. Accordingly, the mass ratios of (Fe/Cd)2.5–10 could be used to investigate the effects of ADEs in the Kaoping River.
Table 5. Comparison of metallic element ratios in PM2.5–10 and PM2.5 during and after the S- and NW-type ADEs at four manual sampling sites.
Conclusion
The mechanisms of ADEs induced by thermal convection and typhoons were first investigated during the rainy seasons in the Kaoping River Valley. While the wind speeds reached over 3.4 m/sec at the DL AQMS, PM10 concentrations increased drastically by as much as 9–22 times within 3–4 hr correspondingly. During the ADEs, PM2.5–10/PM10 ratios were in the range of 0.8–0.95 according to the data obtained from the AQMSs. The results showed that PM2.5–10 dominated PM10 and implied that crustal elements were the major components of PM2.5–10. The fingerprint of alluvial soils was also found to understand their metallic characteristics in the resuspension experiments. Relatively high contents of Fe2.5 ranged from 3,000 to 4,000 μg/g and Fe2.5–10 ranged from 6,500 to 9,800 μg/g. Cd2.5 and Cd2.5–10 in alluvial soils were less than 0.40 μg/g, the lowest contents, and thus Cd could be considered as the background element. In particular, both Fe and Cd in alluvial soils had no significant differences through the nonparametric statistics method of the Kruskal–Wallis test, indicating that Fe and Cd existed evenly along the Kaoping River. Accordingly, the metallic characteristics of AD can be appropriately used to evaluate the influence of ADEs on particulate air quality surrounding the Kaoping River Valley. The mass ratios of crustal elements to Cd2.5–10 in AD had no significant difference during and after the ADEs, based on the results of the Wilcoxon rank-sum test. They can be regarded as indices for distinguishing the effects of AD during and after the ADEs. Particularly, the mass ratio of (Fe/Cd)2.5–10 during the NW-type ADEs on the left bank and that during the S-type ADEs on the right bank were the comparative indicators for evaluating the effects of S- and NW-type ADEs. In addition to PM2.5–10, the concentrations of PM2.5 detected at the manual sampling sites during the ADEs were 3.3–3.6 times higher than those detected after the ADEs, indicating that AD was also a source of PM2.5 in ambient air.
180226_Supplemental_File.doc
Download MS Word (782 KB)supplementary-material
Supplemental data for this paper can be accessed on the publisher’s website.
Additional information
Notes on contributors
Chung-Shin Yuan
Chung-Shin Yuan is a professor at Institute of Environmental Engineering, National Sun Yat-Sen University, Taiwan, Republic of China.
Chun-Chung Lu
Chun-Chung Lu is a Ph.D. candidate at Institute of Environmental Engineering, National Sun Yat-Sen University, Taiwan, Republic of China..
Hua-Zhen Shen
Hua-Zhen Shen is a lecturer/researcher in the College of Chemical Engineering, Huaqiao University, China.
Tsung-Chang Li
Tsung-Chang Li is an associate technical specialist at Taiwan Environmental Protection Administration.
Related Research Data
References
- Cao, J.J., J.C. Shen, G. Chow, J.G. Qi, and J.G. Watson. 2009. Seasonal variations and sources of mass and chemical composition for PM10 aerosol in Hangzhou. Chin. Part. 7:161–168.
- Chen, Y.C., C.Y. Hsu, S.L. Lin, G.U. Chang-Chien, M.J. Chen, G.C. Fang, and H.C. Chiang. 2015. Characteristics of concentrations and metal compositions for PM2.5 and PM2.5-10 in Yunlin county, Taiwan during air quality deterioration. Aerosol Air Qual. Res. 15:2571–2583. doi:10.4209/aaqr.2015.04.0261.
- Cheng, Y.C., C.S. Liang, J.Y. Syu, Y.Y. Chang, Y.L. Yan, S.J. Chen, C.C. Chen, and W.Y. Lin. 2015. Characteristics of aerosol extinction coefficient in Taipei metropolitan atmosphere. Aerosol Air Qual. Res. 15:1823–1835.
- Cheung, K., N. Daher, W. Kam, M. M. Shafer, Z. Ning, J.J. Schauer, and C. Sioutas. 2011. Spatial and temporal variation of chemical composition and mass closure of ambient coarse particulate matter (PM10–2.5) in the Los Angeles area. Sci. Total Environ. 45:2651–2662.
- Claiborn, C.S., D. Finn, T.V. Larson, and J.Q. Koeni. 2011. Windblown dust contributes to high PM2.5 concentrations. J. Air Waste Manage. Assoc. 60:1262–1268. doi:10.1080/10473289.2000.10464179.
- Colledge, M. A., J. R. Julian, V.V. Gocheva, C.L. Beseler, H.A. Roels, D.T. Lobdell, and R.M. Bowler. 2015. Characterization of air manganese exposure estimates for residents in two Ohio towns. J. Air Waste Manage. Assoc. 65:948–957. doi:10.1080/10962247.2015.1040525.
- Gertler, A.W., D.A. Lowenthal, and W.G. Coulombe. 2012. PM10 source apportionment study in Bullhead City, Arizona. J. Air Waste Manage. Assoc. 45:75–82. doi:10.1080/10473289.1995.10467349.
- Hieu, N.T., and B.K. Lee. 2007. Characteristics of particulate matter and metals in the ambient air from a residential area in the largest industrial city in Korea. Atmos. Environ. 98:526–537.
- Hueglin, C., R. Gehrig, U. Baltensperger, M. Gysel, C. Monn, and H. Vonmont. 2005. Chemical characterization of PM2.5, PM10 and coarse particles at urban, near-city and rural sites in Switzerland. Atmos. Environ. 39:637–651. doi:10.1016/j.atmosenv.2004.10.027.
- Kothai, P., I.V. Saradhi, P. Prathibha, P.K. Hopke, G.G. Pandit, and V.D. Puranik. 2008. Source apportionment of coarse and fine particulate matter at. Navi Mumbai, India. Aerosol Air Qual. Res. 8:423–436. doi:10.4209/aaqr.2008.07.0027.
- Kumar, A., M.M. Sarin, and A.K. Sudheer. 2008. Mineral and anthropogenic aerosols in Arabian Sea–Atmospheric boundary layer: Sources and spatial variability. Atmos. Environ. 42:5169–5181. doi:10.1016/j.atmosenv.2008.03.004.
- Kuo, C.Y., C.Y. Lin, L.M. Huang, S. Wang, P.F. Shieh, Y.R. Line, and P. M. Liu. 2010. Spatial variations of the aerosols in river-dust episodes in central Taiwan. J. Hazard. Mater. 179:1022–1030. doi:10.1016/j.jhazmat.2010.03.107.
- Kuo, C.Y., H.J. Yang, D.J. Chiang, Y.H. Shen, and P.M. Liu. 2014. Concentration and composition variations of metals in outdoor PM10 of elementary schools during river dust episodes. Environ. Sci. Pollut. Res. Int. 21:12354–12363. doi:10.1007/s11356-014-3179-y.
- Kuo, C.Y., J.Y. Wang, S.H. Chang, and M.C. Chen. 2009. Study of metal concentrations in the environment near diesel transport routes. Atmos. Environ. 43:3070–3076. doi:10.1016/j.atmosenv.2009.03.028.
- Kuo, C.Y., Y.R. Lin, S.Y. Chang, C.Y. Lin, and C.H. Chou. 2013. Aerosol characteristics of different types of episode. Environ. Monit. Assess. 2 (12):9777–9787. doi:10.1007/s10661-013-3290-4.
- Li, T.C., C.S. Yuan, K.C. Lo, C.H. Huang, S.P. Wu, and C. Tong. 2015. Seasonal variation and chemical characteristics of atmospheric particles at three islands in the Taiwan Strait. Aerosol Air Qual. Res. 15:2277–2290.
- Li, T.C., W.H. Chen, C.S. Yuan, S.P. Wu, and X.H. Wang. 2013. Physicochemical characteristics and source apportionment of atmospheric particles in Kinmen-Xiamen Airshed. Aerosol Air Qual. Res. 13:308–323.
- Lim, C.C., G.D. Thurston, M. Shamy, M. Alghamdi, M. Khoder, A.M. Mohorjy, A.K. Alkhalaf, J. Brocato, L.C. Chen, and M. Costa. 2018. Temporal variations of fine and coarse particulate matter sources in Jeddah, Saudi Arabia. J. Air Waste Manage. Assoc. 68:123–138. doi:10.1080/10962247.2017.1344158.
- Lin, C.W., and J.F. Yeh. 2007. Estimating dust emission from a sandbank on the downstream Jhuoshuei River under strong wind conditions. Atmos. Environ. 41:7553–7561. doi:10.1016/j.atmosenv.2007.05.056.
- Lin, C.Y., S.C. Liu, C.K. Chou, S.J. Huang, C.M. Liu, C.H. Kuo, and C.Y. Young. 2005. Long-range transport of aerosols and their impact on the air quality of Taiwan. Atmos. Environ. 39:6066–6076. doi:10.1016/j.atmosenv.2005.06.046.
- Marcazzan, G.M., S. Vaccaro, G. Valli, and R. Vecchi. 2001. Characterization of PM10 and PM2.5 particulate matter in the ambient air of Milan, Italy. Atmos. Environ. 35:4639–4650. doi:10.1016/S1352-2310(01)00124-8.
- McGowan, H.A., and A. Clark. 2008. A vertical profile of PM10 dust concentrations measured during a regional dust event identified by MODIS Terra, western Queensland, Australia. J. Geophys. Res. 113:F02S03. doi:10.1029/2007JF000765.
- Mead, C., P. Herckes, and B.J. Majestic. 2013. Source apportionment of aerosol iron in the marine environment using iron isotope analysis. Geophys. Res. Lett. 21:5722–5727. doi:10.1002/2013GL057713.
- Meng, Z., and B. Lu. 2007. Dust events as a risk factor for daily hospitalization for respiratory and cardiovascular diseases in Minqin, China. Atmos. Environ. 41:7048–7058. doi:10.1016/j.atmosenv.2007.05.006.
- Orozco, D., R. Delgado, D. Wesloh, R.J. Powers, and R. Hoff. 2015. Aerosol particulate matter in the Baltimore metropolitan area: Temporal variation over a six-year period. J. Air Waste Manage. Assoc. 65:1050–1061. doi:10.1080/10962247.2015.1067653.
- Paramasivam, K., V. Ramasamy, and G. Suresh. 2015. Impact of sediment characteristics on the heavy metal concentration and their ecological risk level of surface sediments of Vaigai river, Tamilnadu, India. Spectrochim. Acta 137:397–407. doi:10.1016/j.saa.2014.08.056.
- Ruff, S.W., A.A. Pankine, and G. Barta. 2014. Aeolian dust deposits. Encycl. Planet. Landforms. doi: 10.1007/978-1-4614-9213-9_2-2.
- Sun, K., H.N. Liu, A.J. Ding, and X.Y. Wang. 2016. WRF-chem simulation of a severe haze episode in the Yangtze River Delta, China. Aerosol Air Qual. Res. 16:1268–1283. doi:10.4209/aaqr.2015.04.0248.
- Taiwan EPA. 2008. Evaluating the effects of aeolian dust fugitively emitted from rivers on the atmospheric aerosols in central Taiwan: Environmental Protection Administration. EPA-097-FA14-03-A042.
- Taiwan WRA. 2013. Strategic assessment of the upstream dredging of the Kaoping River basin on sediment reduction. MOEAWRA-1020237. Taiwan: Taiwan Water Resources Agency.
- Tang, Y., and G. Han. 2015. Characteristics of major elements and heavy metals in atmospheric dust in Beijing, China. J. Geochem. Explor. doi:10.1016/j.gexplo.2015.12.002.
- Tsai, F.J., J.Y. Tu, S. C. Hsu, and W.N. Chen. 2014. Case study of the Asian dust and pollutant event in spring 2006: Source, transport, and contribution to Taiwan. Sci. Total Environ. 478:163–174. doi:10.1016/j.scitotenv.2014.01.072.
- Tsai, H.H., C.S. Yuan, C.H. Hung, and Y.C. Lin. 2010. Comparing physicochemical properties of ambient particulate matter of hot spots in a highly polluted air quality zone. Aerosol Air Qual. Res. 10:331–344.
- Venter, A.D., P.G. Zyl, J.P. Beukes, M. Josipovic, J. Hendriks, V. Vakkari, and L. Laakso. 2017. Atmospheric trace metals measured at a regional background site (Welgegund) in South Africa. Atmos. Chem. Phys. 17:4251–4263. doi:10.5194/acp-17-4251-2017.
- Wang, J.H., and S. Ogawa. 2015. Effects of meteorological conditions on PM2.5 concentrations in Nagasaki, Japan. Int. J. Environ. Res. Public Health 12:9089–9101. doi:10.3390/ijerph120809089.
- Wang, X.L., J. C. Chow, S.D. Kohl, K.E. Percy, A.H. Legge, and J.G. Watson. 2015. Characterization of PM2.5 and PM10 fugitive dust source profiles in the Athabasca Oil Sands Region. Aerosol Air Qual. Res. 12:1421–1433. doi:10.1080/10962247.2015.1100693.
- Wu, F., J.C. Chow, Z.S. An, J.G. Watson, and J.J. Cao. 2011. Size-differentiated chemical characteristics of Asian Paleo dust: Records from aeolian deposition on the Chinese loess plateau. J. Air Waste Manage. Assoc. 61:180–189. doi:10.3155/1047-3289.61.2.180.
- Yang, H.H., S.W. Luo, K.T. Lee, J.Y. Wu, C.W. Chang, and P.F. Chu. 2016. Fine particulate speciation profile and emission factor of municipal solid waste incinerator established by dilution sampling method. J. Air Waste Manage. Assoc. 66:807–814. doi:10.1080/10962247.2016.1184195.
- Yuan, C.S., C.G. Lee, S.H. Liu, J.C. Chang, C. Yuan, and H. Y. Yang. 2006. Correlation of atmospheric visibility with chemical composition of Kaohsiung aerosols. Atmos. Res. 82:663–679. doi:10.1016/j.atmosres.2006.02.027.