
 ?Mathematical formulae have been encoded as MathML and are displayed in this HTML version using MathJax in order to improve their display. Uncheck the box to turn MathJax off. This feature requires Javascript. Click on a formula to zoom.
ABSTRACT
Metropolitan residents are concerned about their exposure to airborne pollutants. But establishing these exposures is challenging. A compact personal exposure kit (PEK) was developed to evaluate personal integrated exposure (PIE) from time-resolved data to particulate matter with aerodynamic diameter less than 2.5 μm (PM2.5) in five microenvironments, including office, home, commuting, other indoor activities (other than home and office), and outdoor activities experienced both on weekdays and weekends. The study was conducted in Hong Kong. The PEK measured PM2.5, reported location and several other factors, stored collected data, as well as reported the data back to the investigators using global system for mobile communication (GSM) telemetry. Generally, PM2.5 concentrations in office microenvironment were found to be the smallest (13.0 μg/m3), whereas the largest PM2.5 concentration microenvironments were experienced during outdoor activities (54.4 μg/m3). Participants spent more than 85% of their time indoors, including in offices, homes, and other public indoor venues. On average, 42% and 81% of the time were spent in homes, which contributed 52% and 79% of PIE (during weekdays and weekends, respectively), suggesting that improvement of air quality in homes may reduce overall exposures and indicating the need for actions to mitigate possible public health burdens in Hong Kong. This study also found that various indoor/outdoor microenvironments experienced by urban office workers cannot be accurately represented by general urban air quality data reported from the regulatory monitoring. Such personalized air quality information, especially while in transit or in offices and homes, may provide improved information on population exposures to air pollution.
Implications: A newly developed personal exposure kit (PEK) was used to monitor PM2.5 exposure of metropolitan citizens in their daily life. Different microenvironments and time durations caused various personal integrated exposure (PIE). The stationary monitoring method for PIE was also compared and evaluated with PEK. Positive protection actions can be taken after understanding the major contribution to PM2.5 exposure.
Introduction
Epidemiology studies have found that ambient particulate matter (PM) concentrations have a positive association with mortality as well as with respiratory- and cardiovascular-related hospital admissions (Atkinson et al. Citation2014; Pope and Dockery Citation2006). Fine particulate matter (PM2.5; with an aerodynamic diameter less than 2.5 μm) has been demonstrated to be an important environmental risk factor for cardiopulmonary and lung cancer mortality (Pope et al. Citation2002).
People living and working in metropolitan areas are exposed to such airborne pollutants in various urban microenvironments through different activities. Estimating their exposure is commonly done by assigning population exposure where it is assumed that people in a given area have the same exposures, which is often estimated by the mean concentrations in the entire urban area or community from one or more fixed air quality monitoring stations (Buonanno et al. Citation2011a; Dockery et al. Citation1993). Land use regression (LUR) has also been increasingly used for estimating more refined individual exposures for residents (Eeftens et al. Citation2012; Hoek et al. Citation2008; Montagne et al. Citation2013). However, large uncertainties exist in the use of stationary ambient air quality data to represent the personal exposure of individuals (Buonanno et al. Citation2011b; Steinle, Reis, and Sabel Citation2013). Stationary monitoring sites have limitations in representing the various microenvironments. And adding more regulatory-grade air monitoring is also constrained by high costs. Moreover, using average values from one or a few stations cannot capture peak values and results in unreliable estimates of personal exposure (Manigrasso and Avino Citation2012; Manigrasso et al. Citation2013). Several studies have evaluated the relationship between personal exposures and concentrations measured at fixed monitoring stations, showing substantial differences (Avery et al. Citation2010; Gulliver and Briggs Citation2004).
Personal (or an individual’s) exposure in a single microenvironment may be more accurately calculated by multiplying time spent in a location by the pollutant concentration found at that location. Individuals occupy various microenvironments and have different time-activity patterns, especially in urban areas. Thus, the sum of personal exposure in all microenvironments experienced in a day may provide for an improved personal integrated exposure (PIE). Gerharz, Kruger, and Klemm (Citation2009) reported a personal exposure modeling system for PM2.5 based on activity diaries, Global Positioning System (GPS) tracking, and existing outdoor and indoor air pollution models. The outdoor PM2.5 data were estimated by a scaling factor from PM10 data collected by four fixed sites. The indoor PM2.5 data were calculated based on adjusted outdoor PM2.5 data. They found that the indoor mean 24-hr exposure was in most cases higher than the daily means of the nearby outdoor fixed-site monitors. Wu et al. (Citation2005) used 24-hr continuous PM monitoring through personal DataRAM (pDRs; Thermo Scientific Ltd., Waltham, MA, USA) as well as recorded time-activity diaries (TADs) to evaluate children’s exposure to PM2.5 in different microenvironments. The pDRs were operated without size-selective inlets, and the PM2.5 data were calibrated versus co-located Harvard impactors (HI2.5). They also built models to predict personal PM exposures based on personal measurements and found that the personal exposures were higher than those measured at fixed sites. The time-activity pattern recording was similar to Gerharz, Kruger, and Klemm (Citation2009), but PM2.5 data of Wu et al. (Citation2005) were indirectly determined.
This study reports on the application of a low-cost PM2.5 sensor–based portable personal exposure kit (PEK) to monitor the time-resolved PM2.5 exposure profiles of a population group that worked in one office building but resided in different urban districts and that used different commute modes. Although ultrafine particles (UFPs) and black carbon (BC) were considered to be pollutants that originated from vehicle emission (Reche et al. Citation2011; Zhu et al. Citation2002), no compact and lightweight monitors were available in this study. Portable black carbon measurement was mainly carried out through filter-based light attenuation methods, whereas UFPs may be assessed using electrometer or condensation particle counters (CPCs). Both are somewhat larger than what we could expect users to carry as part of an overall package. Participants carried the PEK to monitor their surrounding air quality simultaneously recorded time-activities over a period of 4 days. The outcomes of this study serve to improve the knowledge of how individual activity pattern impacts exposure risk and the contribution of different outdoor and indoor microenvironments to PIE. It illustrates the utility of a compact, low-cost sensor-based monitor. The active engagement of volunteers also offered an opportunity to raise the environmental awareness of the general public regarding microenvironmental exposures.
Methodology
Participants were recruited from employees of a large international company with its Asia-Pacific headquarter located at International Commercial Centre in West Kowloon, a busy commercial area in Hong Kong (company name is withheld at their request). Offices for this firm were located on floors 30 through 47. Each participant received a briefing on the general nature and requirements of the study. They voluntarily participated in this study. Each was assured confidentiality of his or her identity and study outcomes. No formal human subject approval was obtained. During each data collection cycle, the participants each carried the PEK to collect 4-day (24-hr each day) real-time air pollutant data and recorded the time-activity information through an electronic diary or activities log sheet. Real-time pollutant data and corresponding geographic locations were linked to determine the microenvironment-specific pollution concentrations that participants had experienced. The air pollutant data together with the amount of time spent in different microenvironments were used to assess personal integrated exposure (PIE). The 24-hr average PM2.5 concentration from the integrated individual exposure was evaluated and compared with Hong Kong’s Air Quality Objectives (HKAQOs) and the World Health Organization’s air quality guidelines (WHO AQGs).
Description of the personal exposure kit (PEK)
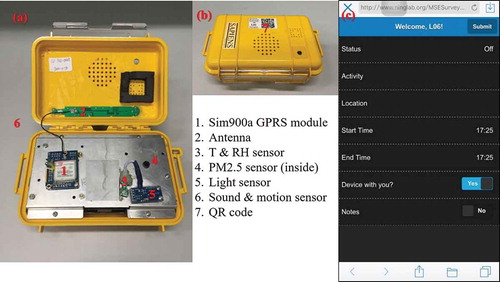
The personal exposure for PM2.5 was measured using the PEK, which contains a PM sensor and a set of environmental sensors, a data collection system, batteries, and a telemetry module housed inside a mini Pelican box (Torrance, CA, USA) with dimensions of 19 cm × 13 cm × 8 cm (length × width × height) and weight of 1.5 kg, as shown in . Ten PEKs were fabricated in our laboratory at City University of Hong Kong. An optical particle counter (OPC-N2 sensor; Alphasense, Essex, UK) was used to measure PM2.5 concentration, which incorporated time-of-flight sensing of individual particles to assign them to 1 of 16 size bins. There are several commonly used PM monitoring devices, such as Dusttraks (TSI, Shoreview, MN, USA), pDRs (Thermo Scientific), and Aerocet 831 (MetOne Inc., Grants Pass, OR, USA) monitors, all of which have larger size, heavier weight, and more power consumption than the OPC-N2 sensor. We elected to use only the PM2.5 data because of prior characterization of the performance at this size versus accepted methods. Light (BH1750FVI; Telesky, Guangdong, China), sound (YL-56; Telesky), and motion (ADXL335; Telesky) sensors were also connected to provide supplementary information used to improve the accuracy of time-activity reporting. A temperature (T) and relative humidity (RH) sensor (SHT25; Sensirion, Staefa, Switzerland) was installed for monitoring these parameters. A Sim900a GPRS module (Simcom Ltd., Shanghai, China) connected to an antenna was mounted inside the enclosure to provide real-time wireless data transmission to a cloud server. A micro-SD (secure digital) card was also installed for data storage as a backup in case of telemetry failure. All real-time data were collected at a time resolution of 10 sec. A custom-designed personal computer (PC) board interfaced the various sensors and data transmission/storage functions while providing power to the electronics from four lithium-ion batteries. A quick response (QR) code label was attached to the front cover, which was used for time-activity recording. Participants were asked to scan the QR code through their mobile terminals (usually smartphones or tablets) whenever the microenvironments or commuting modes were changed. The QR code scanning input process was introduced in Supplementary Material, Figure S1. A Web page screenshot after scanning the QR code is shown in . All information reported by the participants was categorized into five main microenvironments, including office, home, commuting, other indoor activities (other than home and office), and outdoor activities. Regarding commuting, participants were asked to report transport mode(s) they used from seven predefined options, which included railway, bus, minibus, ferry, taxi, walking, and others. Other indoor activities were classified as eating, entertainment, exercising, shopping, cinema/theatre, and others. Outdoor activities consisted of dining, entertainment, exercising, shopping, enjoying public space (such as parks), and others. Cooking or smoking exposure activities were recorded as notes at the bottom of the online log sheet. The start and end times of all activities were recorded with 10-min resolution. The PEK was designed to 8-hr operation on the internal battery to meet study needs but still could be restrained within a compact box (as shown in Figure S2) with acceptable weight. The batteries were charged with an external charger that also powered the units during charging for continuous operation.
Figure 1. Setup of the personal exposure kit (PEK): (a) the internal layout of sensors; (b) front cover of the PEK; (c) screenshot of the QR code after mobile terminal scanning.
Measurement protocol
The sampling period ran from December 12, 2015, to May 3, 2016. A total of 73 participants were involved over a 12-week period. For each data collection cycle, PEKs were delivered to individual participants at midday on Thursday and were collected at midday on the following Monday, at their workplaces. Time synchronization and PM2.5 calibrations were performed on each PEK prior to the delivery to participants. Each participant was expected to carry the PEK with him/her during the entire 4-day sampling period. Participants were encouraged to recharge the PEK during sedentary periods at home and in the office. Each participant was also required to scan the QR code on the front cover through their mobile terminals such as smartphones or tablets and upload a new record when their activity changed. Real-time data were transmitted to a cloud server throughout the sampling period, and it was inspected each day by members of our team. A reminder would be delivered to participants when their data transmission paused for 30 min or more. At the end of each 4-day sampling period, a questionnaire was given to participants to obtain basic information on their living environment, household ventilation type, smoking habits within the household, and a brief description of their daily routine. There were 69 questionnaires collected by the end of sampling. Surprisingly, no smoking event at home was recorded. In terms of household ventilation type, 55 homes used natural ventilation and 11 homes used mechanical ventilation. Only one home used both ventilation types, and surveys from two participants did not mention the ventilation type. This study took place during the cool season in Hong Kong, a period when few households employ either heating or cooling. The workplace is served by a commercial heating, ventilating, and air conditioning (HVAC) system.
Data analysis
The OPC-N2 sensor measures the light scattered by individual particles carried in a sample air stream through a laser beam (Alphasense Citation2015). The PM sensor determines data over 16 bins with particles size ranging from 0.38 to 17 μm. These data can be used for mass concentration calculation of PM1, PM2.5, and PM10. The sensor has been evaluated in our laboratory, and there are several recent publications on its performance (Mukherjee et al. Citation2017; Sousan et al. Citation2016).
A side-by-side comparison test between each OPC-N2 sensor and a factory-calibrated PM2.5 monitor, pDR-1500 (Thermo Scientific), was performed before and after the sampling periods for quality assurance and quality control. The pDR data were adjusted based on comparisons performed at City University of Hong Kong versus gravimetric method, as shown in Figure S3. In order to minimize the relative humidity (RH) effect on the light scattering PM monitor, raw data were corrected by application of the following equation (Chakrabarti et al. Citation2004):
where RH is the relative humidity and CF is the correction factor (raw data/corrected data). The OPC-N2 sensor calibration process was introduced in Supplementary Material S2 (S2.OPC-N2 sensor calibration).
For exposure calculation, PIE was calculated from the following equation (Yang et al. Citation2015):
where Ci represents the pollutant concentration in different microenvironments, IR represents inhalation rate and Ti represents the duration of stay in each microenvironment. The U.S. Environmental Protection Agency (EPA) (Citation2011) illustrated comprehensive activity levels with inhalation rates for discrete age groups for males and females. In this paper, we used the recommended mean inhalation rate value of 15.9 m3/day for male and female combined at age group 21–61 yr (EPA Citation2011). It would be possible to refine the exposure/dose metrics for each subject in future studies when more refined ventilation rate data are collected.
Results and discussion
Study population demographic profile
There were 73 participants recruited, and 13 were asked to repeat due to incomplete sampling. As a result, a total of 86 data sets were collected over the 12-week sampling period, including 61 successful data sets with complete and valid PM2.5 concentrations and time-activity information and 25 incomplete data sets due to time-activity information missing or PEK hardware failure. The data included 111 weekday profiles and 50 weekend profiles.
shows the distribution of the home locations of the participants in three main districts in Hong Kong, including Hong Kong Island, Kowloon, and the New Territories. Although all participants worked in Kowloon, the proportion of participants living in each of the regions ranged from 27.9% to 37.7%. Hong Kong has a highly developed and sophisticated transport network, and about 12.6 million passenger journeys per day were made on public transport systems in 2016 (Hong Kong Transport Department [HKTD] Citation2016). Mass Transit Railway (MTR) (31.3%), walking (24.9%), and bus (21.4%) were the three most popular commuting modes out of all recorded commuting events from the study participants (). We advised the participants to input a record separately if multiple commuting modes happened. Participants spent on average 90% of their daily time in indoor environments, including home (46.3%), office (39.2%), and other indoor activities (4.6%), as shown in . The high percentage of time contributed from indoor stay is a typical urban living characteristic and has been reported in many personal exposure studies in urban areas (Brasche and Bischof Citation2005; Leech et al. Citation2002; Schweizer et al. Citation2007). The results also raised an important notion on the essential role of both outdoor and indoor air quality on the integrated health risks for urban residents. It should be noted that this study was performed during the cooler months in Hong Kong and the nature of activities and mitigating factors, such as air conditioning, may differ during the hot summer conditions experienced in the city.
Table 1. Distribution of participants’ home locations.
Table 2. Distribution of participants’ commuting modes on weekdays.
Table 3. Participants’ daily time allocation and PIE percentages.
Typical sensor records of a participant under different microenvironments
shows examples of the time-series plots of activity profiles, including motion, light, battery, and PM2.5 concentrations, from a participant (E01) on weekdays and weekends. Only one motion metric “pitch” was shown here. It remained steady when PEK was stationary. For this case, motion sensor output (pitch) showed rapid fluctuation during commuting periods and displayed a straight line when PEK was placed still on a table either at home or in the office. This was a good indicator to be used to help with the accurate identification of the time tags for different events. Light intensity was also recorded to assist in the detection of a change of microenvironment, as shown in . Light intensity was relatively steady at home and in the office but fluctuated in daytime outdoor environments. The activity/location time-series plot was obtained from the participant’s input (code 1 for office, 2 for home, 3 for commuting, 4 for other indoor activities, 5 for outdoor activities, and 6 for other activities) and adjustment of transition time from motion and light sensors. The battery time-series plot, in general, indicated the charging periods at home and in the office, with system voltage at about 4.2 V and recorded any periods that the battery fell below operation limit voltage at 3.3 V. We strongly recommended that participants charged the battery when they stayed at home or in the office. Less than 5% of data were lost due to battery failure, which indicated the battery was adequate for this study.
Figure 2. Time-series plots of activity profiles of participant E01 on (a) weekdays and (b) weekends. The dark gray periods represent the commuting periods. Activity codes: 1 for office, 2 for home, 3 for commuting, 4 for other indoor activities, 5 for outdoor activities, and 6 for other activities.
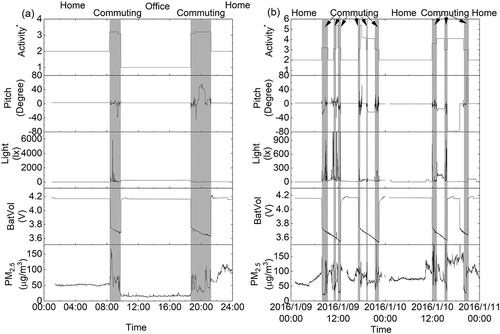
shows the daily weekday pattern of PM2.5 exposure concentration of the participant. A first peak appeared during commuting in the morning, and the PM2.5 concentrations dropped to the lowest when in the office. The microenvironment and activity patterns during the weekends as shown in displayed different profiles. The two figures illustrate that no activity was recorded on the weekday evening, but several activities were recorded on the weekend evening based on the combination of motion, light sensors, and battery reading. This validates the utility of the sensor system as a means to verify the diary activity reporting and fill in unrecorded activities (e.g., home as the last activity). Participants were found to be primarily in their home, commuting, and in office microenvironments during weekdays, indicating that these microenvironments played vital roles in weekday PIE. However, activity patterns were more complex on weekends. Activities in outdoor and other indoor microenvironments were recorded, as shown in . PM2.5 concentration also varied under different other indoor activities on weekends. The peak values of PM2.5 experienced during weekends were found during commuting; thus, it became a critical factor in reducing daily PIE when other microenvironments were relatively clean.
PM2.5 concentration profile during weekdays
shows the box plot of the PM2.5 concentrations in various microenvironments encountered by all participants on weekdays. Among all the different categories of microenvironments, other indoor activities (other than office and home) had the greatest variation in PM2.5 concentrations, whereas the office had the lowest variation in this study, since all participants worked in the same building. Lim et al. (Citation2012) also reported that the standard deviation of PM2.5 concentration in all indoors other than residences and workplaces showed very high variability due to various microenvironments in Korea. High peak and average concentrations were observed in restaurants and bars as a result of secondhand smoke and practice of cooking with charcoal on tables. In our study, the maximum mean PM2.5 concentration was recorded from other indoor activities, which was contributed by the eating category (Figure S5). Mean PM2.5 concentration in offices (13.0 μg/m3) was significantly lower than in any other microenvironments, which ranged from 40.4 to 54.4 μg/m3. The main reason for the cleaner office microenvironment may be the use of central air conditioning that includes an effective filtration system in the office building. It should be noted that smoking was not allowed in this workplace. Meanwhile, the average concentration at home was about 3 times of that in the office, which was similar to those reported by Steinle et al. (Citation2015) in Scotland. Several researchers have reported on conditions in other cities where the mean PM2.5 concentration in homes and outdoors were 15.4 and 13.2 μg/m3 in Toronto, 27.7 and 13.6 μg/m3 in the USA, and 45 and 47 μg/m3 in Hong Kong, respectively (Chao and Wong Citation2002; Pellizzari et al. Citation1999; Wallace et al. Citation2003).
Figure 3. Box plot of PM2.5 concentrations measured in each microenvironment on weekdays. The box defines the 25th, 50th, and 75th percentiles, with the whiskers defining the range of the 5th to the 95th percentiles. The mean for each microenvironment is plotted as the dot.

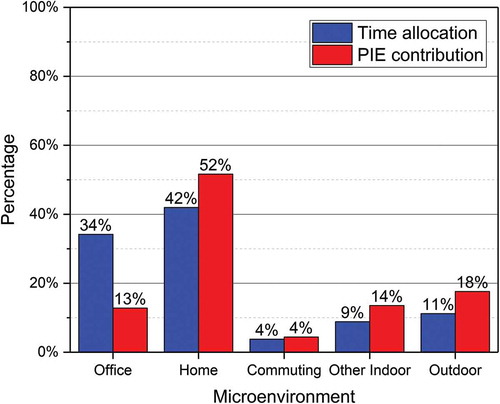
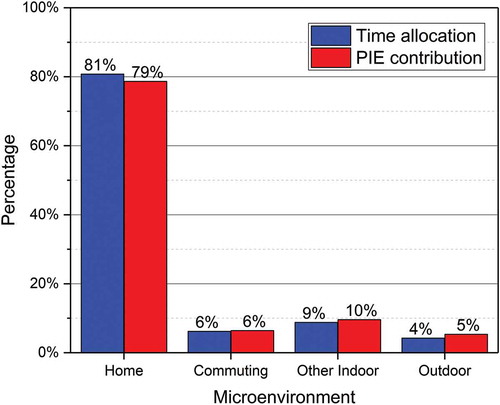
A contrast between the amount of time spent and contribution to PIE in each microenvironment during weekdays is displayed in . Time at home was the most important contributor to total daily PIE. The home microenvironment contributed 52% of daily PIE even though only 42% of the daily time was spent there, showing a somewhat disproportionately larger contribution. Similar nonproportional observations of time spending and PIE contribution were found in indoor (other than home and office) and outdoor microenvironments. By contrast, 34% of the daily time was spent in the office microenvironment, but it contributed only 13% of the daily PIE.
Figure 4. Contrast of time allocation and contribution to personal integrated exposure (PIE) to PM2.5 on weekdays.
PM2.5 concentration during commuting on weekdays
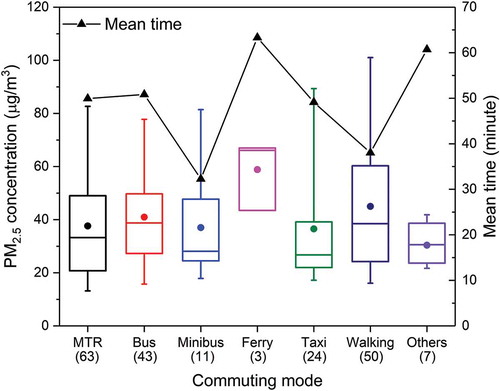
A total of 201 commuting events were recorded by participants during weekdays sampling. shows box-and-whisker plots of PM2.5 concentrations in each of the commuting modes and the average duration of these events on weekdays. The ferry commute mode (three trips only) recorded the highest mean PM2.5 concentrations, which is consistent with other research on exposure to PM2.5 in different transportation modes (Clean Air Task Force [CATF] Citation2007; Knibbs and De Dear Citation2010). A Clean Air Task Force (CATF) research team found that the exhaust from the diesel engine of a ferry could easily enter ferry cabins and form swirling eddies behind the boat, resulting in a very high level of PM2.5. The popular commuting modes used by the participants were MTR (31.3%), walking (24.9%), bus (21.4%), taxi (11.9%), and minibus (5.5%). No statistical difference in mean PM2.5 concentration among these commuting modes was found, and their recorded mean concentrations were all above their medians, showing the existence of cases with disproportionately high PM2.5 concentrations within each transport mode. The PM2.5 concentration followed lognormal distribution, as shown in Figure S6.
Figure 5. Box plot of PM2.5 concentrations measured in each commuting mode on weekdays. The box defines the 25th, 50th, and 75th percentiles, with the whiskers defining the extent of the 5th to the 95th percentiles. The mean for each commuting mode is plotted as the dot. Numbers in the parentheses are event counts. The mean time duration per commuting trip is plotted as the triangle.
PM2.5 concentration during weekends
Only one office visit was reported during weekends; thus, the following discussion is focusing on the other four microenvironments. displays the time spent in each microenvironment and the PIE contribution to total daily exposure of the group for various microenvironments on weekends. The home microenvironment contributed almost 80% of daily PIE during weekends versus only 52% on weekdays. also shows that participants tended to stay at home during the weekends: about 81% of the time. As with weekends, overall exposures might be significantly reduced by taking actions to reduce in-home concentrations. Li, Wen, and Zhang (Citation2017) pointed out that indoor PM control method was divided into two aspects: source and transmissions. The actions such as avoiding smoking, solid fuels usage, arranging indoor activities reasonably, and implementing air conditioning with high filtration performance or air purifiers can be taken to lower indoor PM concentrations. However, the outdoor PM concentration can’t be controlled by the subjects. Spending less time in high-PM-concentration microenvironments and altering commuting modes to low-PM-concentration ones were suggested for outdoor activities. Such data could be collected in subsequent studies using the PEK.
Figure 6. Contrast of time allocation and contribution to personal integrated exposure (PIE) to PM2.5 on weekends.
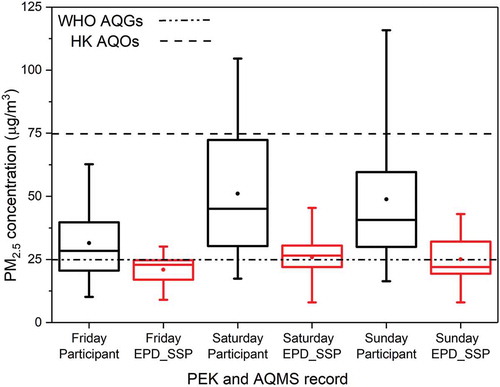
24-Hour integrated PM2.5 exposure
This personal exposure measurement was focused on PM2.5 concentration in specific microenvironments and the time of stay. It measured microscale pollution with minute time resolution. The results provided a detailed exposure profile of an individual’s daily life, which could be used for short-term personal exposure studies. Box plots in show the 24-hr average PM2.5 concentrations of the 5th to 95th percentiles of participants on weekdays and weekends. The recommended 24-hr ambient WHO AQG (25 μg/m3) and HKAQO (75 μg/m3) for PM2.5 are also inserted as references. About 60% of participants on weekdays were exposed to PM2.5 that exceeded 25 μg/m3, and 1% of participants exceeded 75 μg/m3. In contrast, during weekends, these proportions rose to 83% and 14%, respectively. The mean values of 24-hr personal PM2.5 exposures on Fridays, Saturdays, and Sundays were 32.0 μg/m3 (SD = 17.0 μg/m3), 52.0 μg/m3 (SD = 25.1 μg/m3), and 47.9 μg/m3 (SD = 27.9 μg/m3), respectively. Mean 24-hr exposures for each subject ranged from 7.7 to 147.9 μg/m3. PM2.5 concentrations reported by the nearest air quality monitoring station to the participants’ office (Sham Shui Po AQMS) during the measurement periods are shown in red. The daily activities of the participants of this study exposed them to considerably higher PM2.5 than would be expected from the urban ambient air quality monitoring data. Indoor PM levels were generally lower than the corresponding outdoor ones, whereas the elevated indoor concentrations were likely caused by increased ambient aerosol penetration and/or strong internal emission sources (Li, Wen, and Zhang Citation2017; Qi et al. Citation2017).
Figure 7. Box plot of 24-hr PM2.5 concentrations measured on weekdays and weekends. The box defines the 25th, 50th, and 75th percentiles, with the whiskers defining the extent of the 5th to the 95th percentiles. The mean for each activity is plotted as the dot.
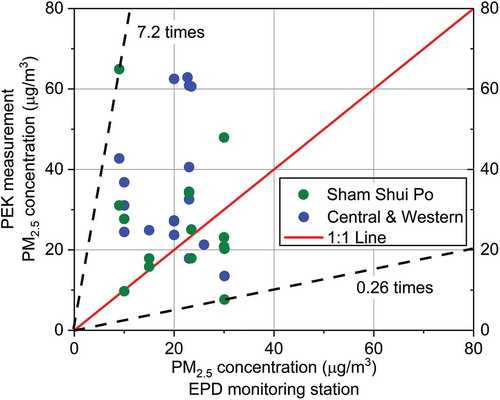
shows the result of a further analysis of air quality experienced by participants who live in Yau Tsim Mong and Central/Western Districts versus what nearby regulatory monitoring would determine. It illustrates that there is a very low statistical correlation (p = 0.73, r2 = 0.004) between the Environment Protection Department Air Quality Monitoring Stations (EPD AQMS) data (Sham Shui Po monitoring station is the nearest station to Yau Tsim Mong, and the Central/Western station is in the Central/Western District) with the participants’ PEK exposure data for PM2.5. One highlight of the data from the comparison of PEK-related measurements with the nearby monitoring station is the large differences, with extreme ratios of 0.26 and 7.2 times between the EPD AQMS data and PEK data. Ratios less than 1 illustrate that the participant experienced less related exposures than the regulatory monitoring data. As home and office constituted 76% of total time spent in a day, the influence of reduced office levels would explain much of the reduced ratio. Ratios larger than 1 reflect higher pollution exposure than the outside. Large indoor PM2.5 sources may raise the ratio to much larger than 1. Low filtration in most homes may also increase the ratio to 1, as the indoor air was directly exchanged with outdoor air. Such ratios demonstrate that one should use caution in the use of AQMS data in Hong Kong to represent accurate personal exposures of citizens. Six participants had values less than 20% of EPD AQMS data, which means the EPD AQMS may be a poor predictor of the exposures of this group.
Figure 8. Correlation plot of PM2.5 concentrations measured by EPD AQMS and PEK.
Home microenvironment contributed 52% and 81% of PIE during weekdays and weekends, respectively; thus it has become the most vital consideration when taking actions to lower personal exposure. The improvement of personal exposure in commuting might be less important, as it only contributed 4% and 6% of PIE on weekdays and weekends, respectively. This could be explained by the fact that Hong Kong has a highly developed public transport system with a relatively clean environment. The cleanest environment was found in office, which only accounted for 13% of PIE, which was lower than the PIE portions of 14% and 18% from other indoor and outdoor microenvironments on weekdays, respectively.
It should be noted that the group studied in this protocol should not be considered to be representative of the entire population in Hong Kong. More extensive studies are required to collect the data needed to understand exposures of complex urban population fully. This PEK-based monitoring approach, which employed small and low-cost sensors, shows promise for such large-scale investigations.
Conclusion
The present study reports on the findings made using a personal exposure kit to investigate PM2.5 concentration in various microenvironments and personal integrated exposure (PIE) for a group of office worker participants in Hong Kong. This group of metropolitan office workers spent more than 85% of the time in indoor environments, including offices, homes, and other public indoor venues. Only a small portion of time was spent commuting and in other outdoor activities. The group’s office environment–related exposures were fairly small, potentially due to an absence of major PM sources and the use of an HVAC system, which reduced PM levels in the offices. The observed variable levels of air quality in the different indoor places and the long periods spent in these indoor environments point to the importance of considering indoor air quality in addition to outdoor air in Hong Kong. The large variation of air quality in homes and other indoor places included a few cases with exceptionally high PM2.5 levels. Given the finding that on average 42% and 81% of the time are spent in homes by this group of office workers (during weekdays and weekends, respectively), improving air quality in homes appears to be an important action needed for the protection of public health. The study also showed that one’s personal integrated exposure (PIE) at home is high, surprisingly much higher during the weekends. The study found that the diverse activities of urban office workers and the various indoor/outdoor microenvironments they experience on a daily basis is not well represented by general urban air quality data reported by regulatory monitoring. This suggests that more personalized air quality information, especially in offices and homes, may provide better information for individuals to understand the sources of their exposures and perhaps as the basis for informed actions to reduce their exposure to air pollution. This was a pilot scale investigation that met its objectives and proved the approach, but there is a potential for improvement. The next steps that are underway include designing an improved PEK monitor of smaller size, lower weight, as well as capability of additional pollutant measurements, including gases, that can be used in future studies. Increased sample size and coverage of other seasons are also important in future studies to allow for a better understanding of more diverse population exposure patterns.
Supplemental Material
Download PDF (550.2 KB)Acknowledgment
The team at City University of Hong Kong would like to thank the Civic Exchange team, including Mr. Sunny Lam (senior research officer), for the assistance in the project design and implementation. The authors are grateful to the project team for coordination with the volunteers and help on the project, including Ms. Caroline Wong and Miss. Patricia Hayward.
Supplemental data
Supplemental data for this paper can be accessed on the publisher’s Website.
Additional information
Funding
Notes on contributors
Fenhuan Yang
Fenhuan Yang is a Ph.D. student in School of Energy and Environment at City University of Hong Kong, in Hong Kong Special Administrative Region, People’s Republic of China.
Chui Fong Lau
Chui Fong Lau is a lecturer in the Department of Applied Science at Hong Kong Institute of Vocational Education (Sha Tin), in Hong Kong Special Administrative Region, People’s Republic of China. She is currently affiliated in the School of Energy and Environment in City University of Hong Kong as part-time Research Fellow.
Viki Wai Ting Tong
Viki Wai Ting Tong is a graduate of School of Energy and Environment at City University of Hong Kong, in Hong Kong Special Administrative Region, People’s Republic of China.
Kiwi Kai Zhang
Kiwi Kai Zhang is a Research Assistant in Division of Environment and Sustainability, The Hong Kong University of Science and Technology, in Hong Kong Special Administrative Region, People’s Republic of China.
Dane Westerdahl
Dane Westerdahl is a Visiting Scholar in Division of Environment and Sustainability, The Hong Kong University of Science and Technology, in Hong Kong Special Administrative Region, People’s Republic of China.
Simon Ng
Simon Ng is an independent consultant working on air quality, urban transportation and sustainability issues. He was Civic Exchange’s former Chief Research Officer.
Zhi Ning
Zhi Ning is an Associate Professor in Division of Environment and Sustainability, The Hong Kong University of Science and Technology, in Hong Kong Special Administrative Region, People’s Republic of China.
Related Research Data
References
- Alphasense. 2015. Alphasense user manual for OPC-N2 Optical Particle Counter. Essex, UK: Alphasense Ltd.
- Atkinson, R. W., S. Kang, H. R. Anderson, I. C. Mills, and H. A. Walton. 2014. Epidemiological time series studies of PM2.5 and daily mortality and hospital admissions: A systematic review and meta-analysis. Thorax 69 (7):660–665. doi:10.1136/thoraxjnl-2013-204492.
- Avery, C. L., K. T. Mills, R. Williams, K. A. McGraw, C. Poole, R. L. Smith, and E. A. Whitsel. 2010. Estimating error in using ambient PM2.5 concentrations as proxies for personal exposures: A review. Epidemiology 21 (2):215–223. doi:10.1097/EDE.0b013e3181cb41f7.
- Brasche, S., and W. Bischof. 2005. Daily time spent indoors in German homes - Baseline data for the assessment of indoor exposure of German occupants. Int. J. Hyg. Environ. Health 208 (4):247–253. doi:10.1016/j.ijheh.2005.03.003.
- Buonanno, G., G. Giovinco, L. Morawska, and L. Stabile. 2011b. Tracheobronchial and alveolar dose of submicrometer particles for different population age groups in Italy. Atmos. Environ. 45 (34):6216–6224. doi:10.1016/j.atmosenv.2011.07.066.
- Buonanno, G., M. Dell’Isola, L. Stabile, and A. Viola. 2011a. Critical aspects of the uncertainty budget in the gravimetric PM measurements. Measurement 44 (1):139–147. doi:10.1016/j.measurement.2010.09.037.
- CATF. 2007. A multi-city investigation of exposure to diesel exhaust in multiple commuting modes. CATF Special Report 2007-1. New York: Clean Air Task Force.
- Chakrabarti, B., P. M. Fine, R. Delfino, and C. Sioutas. 2004. Performance evaluation of the active-flow personal DataRAM PM2.5 mass monitor (Thermo Anderson pDR-1200) designed for continuous personal exposure measurements. Atmos. Environ. 38 (20):3329–3340. doi:10.1016/j.atmosenv.2004.03.007.
- Chao, C. Y., and K. K. Wong. 2002. Residential indoor PM10 and PM2.5 in Hong kong and the elemental composition. Atmos. Environ. 36 (2):265–277. doi:10.1016/S1352-2310(01)00411-3.
- Dockery, D. W., C. A. Pope, X. P. Xu, J. D. Spengler, J. H. Ware, M. E. Fay, B. G. Ferris, and F. E. Speizer. 1993. An association between air-pollution and mortality in 6 United-States Cities. New England J. Med. 329 (24):1753–1759. doi:10.1056/NEJM199312093292401.
- Eeftens, M., R. Beelen, K. De Hoogh, T. Bellander, G. Cesaroni, M. Cirach, C. Declercq, A. Dedele, E. Dons, A. De Nazelle, K. Dimakopoulou, K. Eriksen, G. Falq, P. Fischer, C. Galassi, R. Grazuleviciene, J. Heinrich, B. Hoffmann, M. Jerrett, D. Keidel, M. Korek, T. Lanki, S. Lindley, C. Madsen, A. Molter, G. Nador, M. Nieuwenhuijsen, M. Nonnemacher, X. Pedeli, O. Raaschou-Nielsen, E. Patelarou, U. Quass, A. Ranzi, C. Schindler, M. Stempfelet, E. Stephanou, D. Sugiri, M. Y. Tsai, T. Yli-Tuomi, M. J. Varro, D. Vienneau, S. Von Klot, K. Wolf, B. Brunekreef, and G. Hoek. 2012. Development of land use regression models for PM2.5, PM2.5 Absorbance, PM10 and PMcoarse in 20 European Study Areas; Results of the ESCAPE Project. Environ. Sci. Technol. 46 (20):11195–11205. doi:10.1021/es301948k.
- EPA. 2011. Exposure factors handbook : 2011 edition (final report). U.S. Environmental Protection Agency, Washington, DC, EPA/600/R-09/052F, 2011.
- Gerharz, L. E., A. Kruger, and O. Klemm. 2009. Applying indoor and outdoor modeling techniques to estimate individual exposure to PM2.5 from personal GPS profiles and diaries: A pilot study. Sci. Total Environ. 407 (18):5184–5193. doi:10.1016/j.scitotenv.2009.06.006.
- Gulliver, J., and D. J. Briggs. 2004. Personal exposure to particulate air pollution in transport microenvironments. Atmos. Environ. 38 (1):1–8. doi:10.1016/j.atmosenv.2003.09.036.
- HKTD. 2016. Hong Kong: The facts - transport. Transport Department, Hong Kong Special Administrative Region, PRC.
- Hoek, G., R. Beelen, K. De Hoogh, D. Vienneau, J. Gulliver, P. Fischer, and D. Briggs. 2008. A review of land-use regression models to assess spatial variation of outdoor air pollution. Atmos. Environ. 42 (33):7561–7578. doi:10.1016/j.atmosenv.2008.05.057.
- Knibbs, L. D., and R. J. De Dear. 2010. Exposure to ultrafine particles and PM2.5 in four Sydney transport modes. Atmos. Environ. 44 (26):3224–3227. doi:10.1016/j.atmosenv.2010.05.026.
- Leech, J. A., W. C. Nelson, R. T. Burnett, S. Aaron, and M. E. Raizenne. 2002. It’s about time: A comparison of Canadian and American time-activity patterns. J. Expo. Anal. Environ. Epidemiol 12 (6):427–432. doi:10.1038/sj.jea.7500244.
- Li, Z. S., Q. M. Wen, and R. L. Zhang. 2017. Sources, health effects and control strategies of indoor fine particulate matter (PM2.5): A review. Sci. Total Environ. 586:610–622. doi:10.1016/j.scitotenv.2017.02.029.
- Lim, S., J. Kim, T. Kim, K. Lee, W. Yang, S. Jun, and S. Yu. 2012. Personal exposures to PM2.5 and their relationships with microenvironmental concentrations. Atmos. Environ. 47:407–412. doi:10.1016/j.atmosenv.2011.10.043.
- Manigrasso, M., L. Stabile, P. Avino, and G. Buonanno. 2013. Influence of measurement frequency on the evaluation of short-term dose of sub-micrometric particles during indoor and outdoor generation events. Atmos. Environ. 67:130–142. doi:10.1016/j.atmosenv.2012.10.059.
- Manigrasso, M., and P. Avino. 2012. Fast evolution of urban ultrafine particles: Implications for deposition doses in the human respiratory system. Atmos. Environ 51:116–123. doi:10.1016/j.atmosenv.2012.01.039.
- Montagne, D., G. Hoek, M. Nieuwenhuijsen, T. Lanki, A. Pennanen, M. Portella, K. Meliefste, M. Eeftens, T. Yli-Tuomi, M. Cirach, and B. Brunekreef. 2013. Agreement of land use regression models with personal exposure measurements of particulate matter and nitrogen oxides air pollution. Environ. Sci. Technol. 47 (15):8523–8531.
- Mukherjee, A., L. G. Stanton, A. R. Graham, and P. T. Roberts. 2017. Assessing the utility of low-cost particulate matter sensors over a 12-Week Period in the Cuyama Valley of California. Sensors 17 (8). doi: 10.3390/S17081805.
- Pellizzari, E. D., C. A. Clayton, C. E. Rodes, R. E. Mason, L. L. Piper, B. Fort, G. Pfeifer, and D. Lynam. 1999. Particulate matter and manganese exposures in Toronto, Canada. Atmos. Environ. 33 (5):721–734. doi:10.1016/S1352-2310(98)00229-5.
- Pope, C. A., and D. W. Dockery. 2006. Health effects of fine particulate air pollution: Lines that connect. J. Air. Waste. Manage. Assoc 56 (6):709–742. doi:10.1080/10473289.2006.10464485.
- Pope, C. A., R. T. Burnett, M. J. Thun, E. E. Calle, D. Krewski, K. Ito, and G. D. Thurston. 2002. Lung cancer, cardiopulmonary mortality, and long-term exposure to fine particulate air pollution. Jama-J. Am. Med. Assoc. 287 (9):1132–1141. doi:10.1001/jama.287.9.1132.
- Qi, M., X. Zhu, W. Du, Y. L. Chen, Y. C. Chen, T. B. Huang, X. L. Pan, Q. R. Zhong, X. Sun, E. Y. Zeng, B. S. Xing, and S. Tao. 2017. Exposure and health impact evaluation based on simultaneous measurement of indoor and ambient PM2.5 in Haidian, Beijing. Environ. Pollut. 220:704–712. doi:10.1016/j.envpol.2016.10.035.
- Reche, C., X. Querol, A. Alastuey, M. Viana, J. Pey, T. Moreno, S. Rodriguez, Y. Gonzalez, R. Fernandez-Camacho, A. M. S. De La Campa, J. De La Rosa, M. Dall’Osto, A. S. H. Prevot, C. Hueglin, R. M. Harrison, and P. Quincey. 2011. New considerations for PM, Black Carbon and particle number concentration for air quality monitoring across different European cities. Atmospheric Chem. Phys. 11 (13):6207–6227. doi:10.5194/acp-11-6207-2011.
- Schweizer, C., R. D. Edwards, L. Bayer-Oglesby, W. J. Gauderman, V. Ilacqua, M. J. Jantunen, H. K. Lai, M. Nieuwenhuijsen, and N. Kunzli. 2007. Indoor time-microenvironment-activity patterns in seven regions of Europe. J. Expo. Sci. Environ. Epidemiol. 17 (2):170–181. doi:10.1038/sj.jes.7500490.
- Sousan, S., K. Koehler, L. Hallett, and T. M. Peters. 2016. Evaluation of the Alphasense optical particle counter (OPC-N2) and the Grimm portable aerosol spectrometer (PAS-1.108). Aerosol Sci. Technol. 50 (12):1352–1365. doi:10.1080/02786826.2016.1232859.
- Steinle, S., S. Reis, and C. E. Sabel. 2013. Quantifying human exposure to air pollution-Moving from static monitoring to spatio-temporally resolved personal exposure assessment. Sci. Total Environ. 443:184–193. doi:10.1016/j.scitotenv.2012.10.098.
- Steinle, S., S. Reis, C. E. Sabel, S. Semple, M. M. Twigg, C. F. Braban, S. R. Leeson, M. R. Heal, D. Harrison, C. Lin, and H. Wu. 2015. Personal exposure monitoring of PM2.5 in indoor and outdoor microenvironments. Sci. Total Environ. 508:383–394. doi:10.1016/j.scitotenv.2014.12.003.
- Wallace, L. A., H. Mitchell, G. T. O’Connor, L. Neas, M. Lippmann, M. Kattan, J. Koenig, J. W. Stout, B. J. Vaughn, D. Wallace, M. Walter, K. Adams, and L. J. S. Liu. 2003. Particle concentrations in inner-city homes of children with asthma: The effect of smoking, cooking, and outdoor pollution. Environ. Health Perspect. 111 (9):1265–1272.
- Wu, C. F., R. J. Delfino, J. N. Floro, P. J. E. Quintana, B. S. Samimi, M. T. Kleinman, R. W. Allen, and L. J. S. Liu. 2005. Exposure assessment and modeling of particulate matter for asthmatic children using personal nephelometers. Atmos. Environ. 39 (19):3457–3469. doi:10.1016/j.atmosenv.2005.01.061.
- Yang, F. H., D. Kaul, K. C. Wong, D. Westerdahl, L. Sun, K. F. Ho, L. W. Tian, P. Brimblecombe, and Z. Ning. 2015. Heterogeneity of passenger exposure to air pollutants in public transport microenvironments. Atmos. Environ. 109:42–51. doi:10.1016/j.atmosenv.2015.03.009.
- Zhu, Y. F., W. C. Hinds, S. Kim, S. Shen, and C. Sioutas. 2002. Study of ultrafine particles near a major highway with heavy-duty diesel traffic. Atmos. Environ. 36 (27):4323–4335. doi:10.1016/S1352-2310(02)00354-0.