
ABSTRACT
It is widely accepted that some air pollutants are related to lung cancer prevalence. An effective method is proposed to quantitatively evaluate the effects of air pollutants and the interactions between them. The method consisted of three parts: data decomposition, comparable data generation and relationship inference. Firstly, very limited monitoring data published by Geographic Information System were applied to calculate the inhalable air pollution of relatively massive patient samples. Then the investigated area was partitioned into a number of districts, and the comparable data containing air pollutant concentrations and lung cancer prevalence in all districts were generated. Finally, the relationships between pollutants and lung cancer prevalence were concluded by an information fusion tool: Choquet integral. As an example, the proposed method was applied in the investigation of air pollution in Tianjin, China. Overall, SO2, O3 and PM2.5 were the top three factors for lung cancer. And there was obvious positive interaction between O3 and PM2.5 and negative interaction among SO2, O3 and PM10. The effect of SO2 on men was larger than on women. O3 and SO2 were the most important factors for the adenocarcinoma and squamous cell carcinoma, respectively. The effect of SO2 or NO2 on squamous cell carcinoma is obviously larger than that on adenocarcinoma, while the effect of O3 or PM2.5 on adenocarcinoma is obviously larger than that on squamous cell carcinoma. The results provide important suggestions for management of pollutants and improvement of environmental quality. The proposed method without any parameter is general and easily realized, and it sets the foundation for further researches in other cities/countries.
Implications: For total lung cancer prevalence, male and female lung cancer prevalence, and adenocarcinoma and squamous cell carcinoma prevalence, the proposed method not only quantify the effect of single pollutant (SO2, NO2, CO, O3, PM2.5, and PM10) but also reveals the correlations between different pollutants such as positive interaction or negative interaction. The proposed method without any geographic predictor and parameter is much easier to realize, and it sets the foundation for further research in other cities/countries. The study results provide important suggestions for the targeted management of different pollutants and the improvement of human lung health.
Introduction
Air pollution is a major environmental hazard to human respiratory system. In particular, in 2013, the International Agency for Research on Cancer (IARC) has qualitatively identified outdoor air pollution and particulate matter (PM) from outdoor air pollution as carcinogenic to humans (IARC Citation2013; Loomis et al. Citation2013). The prevalence of lung cancer has increased rapidly over the past few decades (Arphorn et al. Citation2017; Yang et al. Citation2016).
Air pollution can result from natural sources and human-related activities. The influence of air pollution is determined by its composition and the reactivity of the constituent components under various conditions (Aggarwal and Jain Citation2015; Han et al. Citation2016). Typically, air pollutants consist of species such as soot, total suspended particulates, inhalable particles (PM with an aerodynamic diameter <10 μm; PM10), fine particulate matter (PM with an aerodynamic diameter <2.5 μm; PM2.5), nitrogen dioxide (NO2), sulfur dioxide (SO2), carbon monoxide (CO), ozone (O3), and volatile organic compounds (VOCs) (Bahrami et al. Citation2018; Dominici et al. Citation2006; Hales, Blakely, and Woodward Citation2012; Yarahmadi et al. Citation2018). The size of these particles determines their transport characteristics and their effects on the human body. The particles less than 10 µm (PM10) in diameter can enter the nasal cavity, those less than 7 µm can enter the throat, and those less than 2.5 µm (PM2.5) can enter the lung and be deposited into the alveoli and then make their way into the bloodstream, leading to diseases related to heart and lung dysfunction (Cheng et al. Citation2014; Yazdi, Delavarrafiee, and Arhami Citation2015). PM2.5 can directly enter the alveoli because their diameters are less than 1/20 of the thickness of a human hair (Carey et al. Citation2013; Mohammed et al. Citation2016; Shen et al. Citation2016).
There is now increasing evidence suggesting that significant exposure to outdoor air pollutants is associated with development of lung cancer (Dehghani et al. Citation2017; Khaniabadi et al. Citation2017; Miri et al. Citation2016; Wang, Ma, and Zhao Citation2014). However, there are at least two main problems hindering the investigation of the relationships between lung cancer prevalence and air pollutants. On one hand, there are very limited available data. And the insufficient applications of these data make this problem more serious. On the other hand, in terms of the effects of air pollutants on patients, there is no efficient method for revealing the interactions among different pollutants. Fortunately, more and more Geographic Information System (GIS) air monitoring stations (AMSs) have been set up to obtain necessary data of air pollutants all over the world. In the light of these data, researchers in Europe, United States, Japan, and many other developed countries have shown a connection between air pollutants and lung cancer (Fischer et al. Citation2015; Jerrett et al. Citation2013; Marino et al. Citation2015; Yorifuji et al. Citation2013), but the conclusions drawn from these studies for different countries/cities and different subjects are not all consistent. And land use regression (LUR) model has been successfully and often used to assess spatial variation of outdoor air pollution (Conti et al. Citation2017; Hoek et al. Citation2008). The main components of LUR include monitoring data, geographic predictors, and model development and validation. The significant predictor variables include various traffic representations, population density, land use, physical geography, and climate level (Hoek et al. Citation2008). Thus, the development of LUR model is relatively complex. And the predictive effect is conditional and depends on the selection of predictor variables. Yang et al. (Citation2016) reviewed and analyzed 21 cohort studies and concluded that the risk of lung cancer mortality or morbidity increased 7.23%/10 μg/m3 increase in PM2.5, 13.17%/10 parts per billion (ppb) increase in NO2, 0.81%/10 ppb increase in nitrogen oxides (NOx), and 14.76%/10 ppb increase in SO2. But it was pointed out that the estimates may be problematic to areas with high level of pollution such as China, because all the studies included were carried out in Western developed countries and Japan and only one study was carried out in a developing country. Thus, more research of the effects of air pollution on health in developing countries is urgently needed. Moreover, the existing methods ignore the correlations among different air pollutants. As a result, in China, studying the relationships between lung cancer prevalence and air pollutants becomes very challenging.
In this study, a new method was proposed to quantitatively evaluate the relationships between air pollutants and lung cancer prevalence. It not only evaluated the effect of single pollutant but also revealed the interactions (correlations) between different pollutants. Unlike the LUR model, our program for estimating air pollution only used the monitoring data of air pollutants for simple computation and did not require any parameters and geographic predictor. This method consisted of three parts: data decomposition, comparable data generation, and relationship inference. Firstly, the inhalable pollutions of any patient sample were estimated based on a group of closest AMSs. The data decomposition utilized the limited monitoring data fully and effectively and alleviated the contradiction between limited monitoring data and relatively massive number of patients to some extent. Secondly, on the basis of the above estimates, after partitioning the overall investigated area into a number of districts, the comparable data containing air pollutant concentrations and lung cancer prevalence in different districts were generated. Finally, given that the existing methods could not identify the interactions among different pollutants at all, Choquet integral, an information fusion tool, was applied to not only estimate the effect of single pollutant but also discover the interactions among different pollutants. As an example, the proposed method was applied in the investigation of the air pollutants in Tianjin, China. The results quantitatively indicated which air pollutants led to increasing lung cancer prevalence and the interactions among different pollutants considering the gender and lung cancer types of patients.
Methods
The proposed method consists of three parts: data decomposition, comparable data generation, and relationship inference. The four major index terms used in this paper are shown in .
Table 1. List of the four index terms used in the paper.
Data decomposition
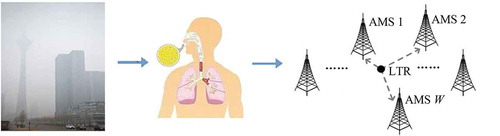
Assume that there are I AMSs and J patients in an investigated area. Any patient’s long-term residence (LTR) is surrounded by W closest AMSs. The concentrations of air pollutants are measured daily and are published via all AMSs throughout the investigated area (see ).
Figure 1. W closest AMSs for a patient’s LTR.
Let be the vector of the concentrations of P air pollutants published by the ith AMS, i = 1, 2, …, I. Assume that
are the vectors of W AMSs closest to the jth patient’s LTR, j = 1, 2, …, J. Then the jth patient’s inhalable pollutions
are evaluated by the weighted average form:
where djk is the distance from kth closest AMS to jth LTR, and the constant “1” aims to protect the denominator from tending zero. In this way, each patient’s inhalable pollutions are estimated by the weighted average of air pollutant concentrations released by W closest AMSs. The weighting valuereflects the spatial position of the kth closest AMS. The monitoring data of any AMS are shared by a number of LTRs nearby. As such, these monitoring data of air pollutants are decomposed to estimate the inhalable pollutions of patients. The data decomposition utilizes the limited monitoring data fully and effectively and solves the contradiction between limited monitoring data and relatively massive number of patients to some extent.
Comparable data generation
Assume that the overall investigated area is partitioned into Q districts. Accordingly, all patients are divided into Q groups. Factoring in the number of patients, λ1(q), and the total number of residents, λ2(q), in the qth district, the lung cancer prevalence can be calculated as
The principle of partitioning is to maximize the mutual difference of the lung cancer prevalence among all partitioned districts. Letcalculated by eq 1 be the pth inhalable air pollutant of the jth patient in the qth district, p = 1, 2, …, P. Then the pth inhalable air pollutant in the qth district is computed by
Consequently, the comparable data Z = (rq1, rq2, …, rqp, zq)T are generated. Using the comparable data, the relationships between lung cancer prevalence and air pollutants can be deduced, as explained below.
Relationship inference
Compared with the ordinary weighted average model, which assumes P attributes (x1, x2, …, xp) as independent (Angilella, Grecoa, and Matarazzo Citation2010), Choquet integral (CI) model is a popular data fusion tool that considers the interactions among P attributes (Kwon and Lee Citation2016), as shown in .
Figure 2. Comparison of CI model and ordinary weighted average model.
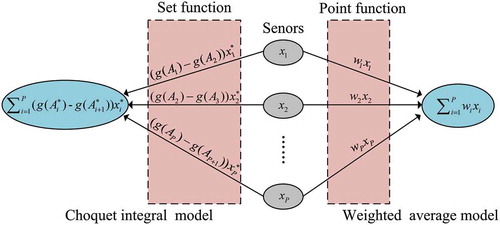
For the above set with P attributes, the ordinary weighted average model calculates the weighted average of P attributes by
where is the weighting coefficient of xi and the P attributes are regarded as independent data resources, but this is not true in real circumstance. CI firstly normalizes each attribute in X into the interval [0, 1]. A set function
which is a fuzzy measure on X satisfies
(i)
(ii), if
and
.
where P(X) is a power set consisting of all subsets of X. For a finite set A ∈ P(X), a simplified and discrete CI can be formulated as
where, and
is a permutation of
such that
. Different from the independent wi in eq 4, wi* in eq 5 involves all attributes, i = 1, 2, …, P.
Consequently, CI can reveal complicated relations among attributes such as the interactions.
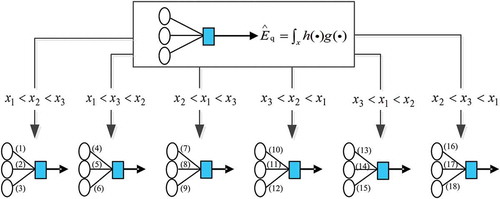
According to the computational procedure of CI, it must divide input space into different subspaces such that all data points in any subspace have a unique order of components. In total, there exist orders for P input resources. For a CI with P inputs and single output, it in fact is equivalent to
feedforward neural networks (NNs) associated with
ordinal subspaces. For instance, an input vector in a three-dimensional (3D) space is equivalent to
feedforward NNs, and the weights of each feedforward NN consist of different permutations of three different input resources: x1, x2, and x3 (see ).
Figure 3. Equivalency between CI and feedforward NN. (1); (2)
; (3)
; (4)
; (5)
; (6)
; (7)
; (8)
; (9)
; (10)
; (11)
; (12)
; (13)
; (14)
; (15)
; (16)
; (17)
; (18)
.
According to eq 5, the computation of CI requires the knowledge of fuzzy measure that involves two important notations: Shapley index and interaction index. Shapley index quantifies the effect of the ith data resource in data fusion (Sugeno Citation2015). The ith Shapley value φi associated with the fuzzy measure
is
The Shapely index computes the average contribution of the ith attribute in all subsets of X that do not include the ith attribute, and the average value is weighted by a coefficient taking into account the cardinality of each subset. After extending the effect of single data resource to the interaction among multiple data resources, Grabisch proposed the interaction index I(A) (Wang Citation2017; Wu et al. Citation2013), and for any subset A∈P(X), I(A) is defined as
The interaction index regards the Shapely index as a special case (Grabisch Citation1995; Mesiar Citation1995), whereas in fact the Shapely index assumes that all data resources are independent.
According to eqs 6 and 7, in order to compute the Shapely and interaction indices, the values of have to be computed in advance. For the comparable data (rq1, rq2, …, rqp, zq), q = 1, 2, …, Q, we let zq be the computed value of eq 2 and
be the computed value of eq 5 after taking rq1, rq2, …, rqp into eq 5. The following mean square error (MSE) criterion is applied to determine the values of
as
where Q is the total number of sample vectors. The optimizing process of eq 8 is not an easy task, since all values of have to satisfy the monotonicity in (ii), that is, if
and
,
. To overcome this problem, the heuristic least mean square (HLMS) algorithm proposed by Grabisch and Roubens (Citation1999) is commonly accepted in most cases and also used in this study (Yager Citation2016).
Generally, multiple pollutants determine the atmospheric quality. A variety of pollutants are not independent of each other, and there is potential correlation between them. In this study, for lung cancer prevalence, the Shapely index is applied to represent the relative effects (importance) of different pollutants and the Shapely interaction index is used to reveal the potential correlations between them.
Experiment using the proposed method
In this section, the proposed method is validated in Tianjin, China, as explained below.
Measurement of air pollutants
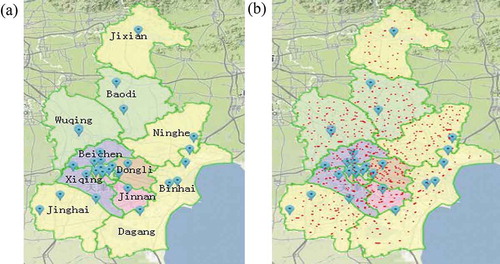
In Tianjin, the monitoring data of air pollutants published by AMSs from November 2013 to December 2016 were obtained. The total number of AMSs has reached 27 since 2013. The distributions of these AMSs are shown in . Average concentrations of SO2, NO2, CO, O3, PM2.5 and PM10, such as 1-hr and 24-hr average values, have been published (http://air.tjemc.org.cn/). In Tianjin, the air pollution level has been remarkably high for many years. Moreover, according to the Tianjin Environmental State Bulletin released by Tianjin Environmental Protection Agency (EPA) (http://www.tjhb.gov.cn), on the whole, there was no dramatically environmental change and no significant change in the state of air pollution, which was almost stable at the same area in recent 10 years. Tianjin is a large city whose north-south length is 189 km, east-west width is 117 km, and coastline length is 156 km. The large size of Tianjin means that the climatic conditions in different districts are quite different. These differences lead to very different air pollutant concentrations that can affect the health of residents.
Figure 4. (a) Distributions of 27 AMSs. The 27 AMSs distributed throughout Tianjin, where any sign “![]()
Information of lung cancer patient samples
The medical information of lung cancer patients treated in Tianjin Medical University General Hospital from 2011 to 2015 was collected. Detailed information of patients was recorded in their medical records, such as smoking history, family genetic history, special occupation, their LTRs, and so on. Whether they had been exposed to high radiation for a long time was judged through their occupation and long-term residences. According to the medical records, in order to exclude the effects of other factors, the patients with smoking history, family genetic history, and long-term exposure to radiation were excluded. Moreover, considering the potential lag effects of air pollution on lung cancer, in order to ensure that the air pollution of Tianjin had played a rather lasting harmful role in patient samples’ respiratory system, only the patients who had lived in Tianjin for the majority of their lives were selected. As such, after a very rigorous process of selection, 1500 patient samples were available and selected.
It is important to note that in the treatment field of lung cancer, there are two authoritative hospitals in Tianjin: Tianjin Medical University General Hospital and Tianjin Medical University Cancer Hospital. Generally, the lung cancer patients treated in the two hospitals account for about 90% of the lung cancer patients in Tianjin. Furthermore, both of the two hospitals belong to the affiliated hospitals of Tianjin Medical University, with the same medical level and facilities and close geographic locations. Thus, in general, for lung cancer patients in any district, the probability of preferring either of them is almost the same. Therefore, as shown in , the LTRs of the selected 1500 patient samples from Tianjin Medical University General Hospital are distributed all over Tianjin. According to these data, we believe that the selection bias in patients’ geographic locations is very small. Indeed, the selected 1500 patient samples from only one hospital are unlikely to cover all patient cases in Tianjin. But in this study, it is necessary to calculate only the relative lung cancer prevalence in different districts, and the relative number rather than the absolute number of lung cancer patients in different districts is required. Thus, the 1500 patient samples without geographic selection bias can serve as a useful study population.
The statistical information of the patient samples is presented in and .
Gender. All 1500 patients were grouped by their gender because male and female individuals have different physical characteristics and tolerances to air pollutants. There were more male patients than female patients, with a ratio of 1.38.
Lung cancer types. Generally, adenocarcinoma and squamous cell carcinoma are the two most common types of lung cancer. In this study, the adenocarcinoma and squamous cell carcinoma samples accounted for 76% of the total. As such, these two classes of patients were selected from the 1500 patients and were divided into adenocarcinoma and squamous cell carcinoma groups.
Age distribution. All patient samples, except 89 samples whose age was not clear, were divided into four groups based on their age, because individuals of different ages have different resistances to air pollutants.
Table 2. Gender and lung cancer types of 1500 lung cancer patients.
Table 3. Age distribution of lung cancer patients.
Generation of comparable data
Based on the locations of the 27 AMSs, the overall investigated area was partitioned into 27 districts. The average air pollutant concentrations (µg/m3) in each district were computed according to eqs 1 and 3. These values are presented in columns 2–7 of . According to the relative number of patients and census results for the total number of residents released by Tianjin Statistical Information Center (http://www.stats tj.gov.cn/Item/16734.aspx), the relative lung cancer prevalence (‰) in each district was calculated by eq 2. When the patients in each district were further grouped based on their gender and lung cancer types, the corresponding lung cancer prevalence levels were also computed. Columns 8–12 in present these results and are denoted as “TOTAL” (total prevalence), “MEN” (prevalence in men), “WOMEN” (prevalence in women), “ADEN” (adenocarcinoma), and “SQUA” (squamous cell carcinoma). The data shown in are called comparable data in this paper. Using the comparable data, relationships between lung cancer prevalence and air pollutants were investigated.
Table 4. Average air pollutant concentrations and lung cancer prevalence in 27 districts.
Computation of CI
Firstly, the data in columns 2–12 in were respectively normalized into the interval [0, 1], then eq 8 was optimized based on these comparable data. The computed values of set function of all subsets for total prevalence are shown in . Similarly, these values for prevalence in men and women and for ADEN and SQUA prevalence are shown in and , respectively. In subsequent tables, SO2, NO2, CO, O3, PM2.5, and PM10 are denoted as “1”–“6,” respectively, for example, “{1, 2}” refers to {SO2, NO2}, etc.
Table 5. Set function values for total lung cancer prevalence.
Table 6. Set function values for lung cancer prevalence in men and women.
Table 7. Set function values for ADEN and SQUA prevalence.
In terms of these set function values in –, the Shapely and interaction indices were determined by eq 6 and 7, as shown in –.
Table 8. Shapley and interaction indices for the total lung cancer prevalence.
Table 9. Shapley and interaction indices for lung cancer prevalence in men and women.
Table 10. Shapley and interaction indices for ADEN and SQUA prevalence.
Results and discussion
In the light of information fusion theory, the Shapley and interaction indices are regarded as constant item and high-order difference item of the Taylor expansion of a complex function, respectively. According to these results in –, the effects of air pollutants and their interactions can be concluded as follows.
(1) For total lung cancer prevalence, shows some noticeable Shapley and interaction index values in . shows Shapley index values: 0.3267 for {SO2}, 0.2365 for {O3}, 0.1613 for {PM2.5}, 0.1020 for {NO2}, 0.0993 for {PM10}, and 0.0722 for {CO}. Thus, SO2, O3, and PM2.5 are the most three main factors affecting the total lung cancer prevalence, then NO2 and PM10. The effect of CO on lung cancer is small. Moreover, in , the Shapley interaction index value of {O3, PM2.5} of 0.2303 is significantly larger than those of other subsets, so there is obvious positive interaction between O3 and PM2.5; that is, the combined effect of O3 and PM2.5 is larger than the summation of their individual effect on lung cancer. These pollutants are mutually complementary, and this correlation can be expressed as
Figure 5. (a) Shapley indices of air pollutants for total lung cancer prevalence. (b) Shapley interaction indices of some air pollutant combinations for total lung cancer prevalence.
where the e(·) represents the effects of air pollutions on total lung cancer prevalence. However, if PM10 is mixed into the combination of SO2 and O3, the interaction index value of {SO2, O3, PM10} attains −0.4152. There is obvious negative interaction among SO2, O3, and PM10; that is, the combined effect of SO2, O3, and PM10 is less than the summation of their individual effect on lung cancer. These pollutants are mutually redundant, and this correlation can be expressed as
(2) For lung cancer prevalence in men and women, shows some noticeable Shapley and interaction index values in . shows that SO2, O3, and PM2.5 are still the three major factors. Moreover, the effect of SO2 on men is obviously larger than that on women, and the comparisons can be expressed as
Figure 6. (a) Shapley indices of air pollutants for male and female lung cancer prevalence. (b) Shapley interaction indices of some air pollutant combinations for male and female lung cancer prevalence.
where the e(·, men) and e(·, women) represent the effects of air pollutions on men and women, respectively. shows some larger Shapley interaction index values of pollutant combinations. The values of interaction index of these combinations are both positive and negative for men and women. For example, there is still obvious negative interaction among SO2, O3, and PM10 for women and men, but the negative interaction for women is a little more obvious than that for men.
(3) For SQUA and ADEN prevalence, shows some noticeable Shapley and interaction index values in . As shown in , for ADEN prevalence, O3 is the most influential factor, followed by SO2 and PM2.5, whereas for SQUA prevalence, SO2 with the largest Shapley value (0.3558) plays the most major role, followed by O3 and PM2.5. The effect of SO2 or NO2 on SQUA is obviously larger than that on ADEN, whereas the effect of O3 or PM2.5 on ADEN is obviously larger than that on SQUA. These comparisons can be expressed as
Figure 7. (a) Shapley indices of air pollutants for SQUA and ADEN prevalence. (b) Shapley interaction indices of some air pollutant combinations for SQUA and ADEN prevalence.
where the e(·, SQUA) and e(·, ADEN) represent the effects of air pollutions on SQUA and ADEN prevalence, respectively. shows some larger Shapley interaction index values of pollutant combinations. The values of interaction index of these combinations are also both positive and negative for SQUA and ADEN prevalence. Obviously, there is positive interaction between O3 and PM2.5, but the positive interaction for ADEN prevalence is more obvious than that for SQUA prevalence.
The results show that the effect of PM2.5 on lung cancer prevalence is not very prominent, and PM2.5 may has a long lag effect on lung cancer, which will be studied in our future research.
Conclusion
Currently, especially for developing countries, investigating the relationships between air pollutions and lung cancer is urgent. In heavily polluted China, the rate of increase of lung cancer patients is much higher than that in other countries, so more experimental studies are needed to confirm or discover the relationships between air pollutants and lung cancer. In this study, a relatively general method was proposed to resolve the problem. The method without any geographic predictor and parameter is easily realized. And many ideas in the proposed method are helpful to other researchers and their investigations, such as data decomposition that fully and effectively utilizes the limited monitoring data. Choquet integral tool was used to not only evaluate the effects of different pollutants on lung cancer prevalence but also reveal the correlations among different factors. Meanwhile, the effects of pollutants on men, women, adenocarcinoma, and squamous cell carcinoma were compared. The proposed method sets the foundation for further research in other cities/countries. The relationships revealed by this study can provide important suggestions for the management of pollutants and the improvement of environmental quality for the investigated residents.
However, air pollutant concentrations are also seasonal, with higher concentrations during winter and spring and lower concentrations during summer. Lung cancer is also influenced by many other demographic factors, such as age, gender, and socioeconomic status, etc. Limited to the scale of the acquired data, these factors have not yet been analyzed, and the possible lag effect of the air pollutants was not studied.
Additional information
Funding
Notes on contributors
Yaru Wang
Yaru Wang is a Ph.D. student at the School of Electrical and Information Engineering, Tianjin University, Tianjin, People’s Republic of China.
Shihong Yue
Shihong Yue is a research professor at the School of Electrical and Information Engineering, Tianjin University, Tianjin, People’s Republic of China.
Bo Zheng
Bo Zheng is Ph.D. student at the School of Environmental Science and Engineering, Tianjin University, Tianjin, People’s Republic of China.
Zhenhua Hao
Zhenhua Hao is a Ph.D. student at the School of Electrical and Information Engineering, Tianjin University, Tianjin, People’s Republic of China.
Jun Chen
Jun Chen is a research professor and doctor at the Department of lung cancer surgery, Tianjin Medical University General Hospital, Tianjin, People’s Republic of China.
References
- Aggarwal, P., and S. Jain. 2015. Impact of air pollutants from surface transport sources on human health: A modeling and epidemiological approach. Environ. Int. 83:146–157. doi:10.1016/j.envint.2015.06.010.
- Angilella, S., S. Grecoa, and B. Matarazzo. 2010. Non-additive robust ordinal regression: A multiple criteria decision model based on the Choquet integral. Eur. J. Oper. Res. 201 (1):277–288. doi:10.1016/j.ejor.2009.02.023.
- Arphorn, S., T. Ishimaru, K. Hara, and S. Mahasandana. 2017. Ambient particulate matter may affect lung function of motorcycle taxi drivers in Bangkok, Thailand. J. Air Waste Manag. Assoc. 68 (2):139–145. doi:10.1080/10962247.2017.1359217.
- Bahrami, A. F., M. Leili, Y. Vaziri, S. S. Arian, A. Cristaldi, G. O. Conti, and M. Ferrante. 2018. Health impacts quantification of ambient air pollutants using AirQ model approach in Hamadan. Iran Environ. Res. 161:114–121. doi:10.1016/j.envres.2017.10.050.
- Carey, I. M., R. W. Atkinson, A. J. Kent, T. Van Staa, D. G. Cook, and H. R. Anderson. 2013. Mortality associations with long-term exposure to outdoor air pollution in a national English cohort. Am. J. Respir. Crit. Care Med. 187 (11):1226–1233. doi:10.1164/rccm.201210-1758OC.
- Cheng, H. R., W. Gong, Z. W. Wang, F. Zhang, X. Wang, X. Lv, and J. Liu. 2014. Ionic composition of submicron particles (PM10) during the long-lasting haze period in January 2013 in Wuhan, central China. J. Environ. Sci-China 26 (4):810–817. doi:10.1016/S1001-0742(13)60503-3.
- Conti, G. O., B. Heibati, I. Kloog, M. Fiore, and M. Ferrante. 2017. A review of AirQ Models and their applications for forecasting the air pollution health outcomes. Environ. Sci. Pollut. Res. 24 (7):6426–6445. doi:10.1007/s11356-016-8180-1.
- Dehghani, M., L. Keshtgar, M. R. Javaheri, Z. Derakhshan, G. O. Conti, P. Zuccarello, and M. Ferrante. 2017. The effects of air pollutants on the mortality rate of lung cancer and leukemia. Mol. Med. Rep. 15 (5):3390–3397. doi:10.3892/mmr.2017.6387.
- Dominici, F., R. D. Peng, M. L. Bell, L. Pham, A. McDermott, S. L. Zeger, and J. M. Samet. 2006. Fine particulate air pollution and hospital admission for cardiovascular and respiratory diseases. Jama-J Am. Med. Assoc. 295 (10):1127–1134. doi:10.1001/jama.295.10.1127.
- Fischer, P. H., M. Marra, C. B. Ameling, G. Hoek, R. Beelen, K. D. Hoogh, O. Breugelmans, H. Kruize, N. A. H. Janssen, and D. Houthuijs. 2015. Air pollution and mortality in seven million adults: The Dutch environmental longitudinal study (DUELS). Environ. Health Persp 123 (7):697–704. doi:10.1289/ehp.1408254.
- Grabisch, M. 1995. Fuzzy integral in multicriteria decision making. Fuzzy Sets. Systems 69 (3):279–298. doi:10.1016/0165-0114(94)00174-6.
- Grabisch, M., and M. Roubens. 1999. An axiomatic approach to the concept of interaction among players in cooperative games. Int. J. Game Theory 28 (4):547–565. doi:10.1007/s001820050125.
- Hales, S., T. Blakely, and A. Woodward. 2012. Air pollution and mortality in New Zealand: Cohort study. J. Epidemiol. Commun. H 66:468–473. doi:10.1136/jech.2010.112490.
- Han, Y. Q., T. Zhu, T. J. Guan, Y. Zhu, J. Liu, Y. Ji, S. Gao, F. Wang, H. Lu, and W. Huang. 2016. Association between size-segregated particles in ambient air and acute respiratory inflammation. Sci. Total Environ. 565:412–419. doi:10.1016/j.scitotenv.2016.04.196.
- Hoek, G., R. Beelen, K. D. Hoogh, D. Vienneau, J. Gulliver, P. Fischer, and D. Briggs. 2008. A review of land-use regression models to assess spatial variation of outdoor air pollution. Atmos. Environ. 42 (33):7561–7578. doi:10.1016/j.atmosenv.2008.05.057.
- International Agency for Research on Cancer (IARC). 2013. Outdoor air pollution. Lyon: World Health Organization Press.
- Jerrett, M., R. T. Burnett, B. S. Beckerman, M. C. Turner, D. Krewski, G. Thurston, R. V. Martin, A. Donkelaar, E. Hughes, Y. Shi, S. M. Gapstur, M. J. Thun, and C. A. Pope. 2013. Spatial analysis of air pollution and mortality in California. Am. J. Respir. Crit. Care Med. 188:593–599. doi:10.1164/rccm.201303-0609OC.
- Khaniabadi, Y. O., S. M. Daryanoosh, P. K. Hopke, M. Ferrante, A. De Marco, P. Sicard, G. O. Conti, G. Goudarzi, H. Basiri, M. J. Mohammadi, and F. Keishams. 2017. Acute myocardial infarction and COPD attributed to ambient SO2 in Iran. Environ. Res. 156:683–687. doi:10.1016/j.envres.2017.04.028.
- Kwon, I. K., and S. Y. Lee. 2016. Emotional inference by means of Choquet integral and lambda-fuzzy measurement in consideration of ambiguity of human mentality. J. Cent. South. Univ. 23 (1):160–168. doi:10.1007/s11771-016-3059-3.
- Loomis, D., Y. Grosse, B. Lauby-Secretan, F. El Ghissassi, V. Bouvard, L. Benbrahim-Tallaa, N. Guha, R. Baan, H. Mattock, and K. Straif. 2013. The carcinogenicity of outdoor air pollution. Lacent. Oncol. 14 (13):1262–1263. doi:10.1016/S1470-2045(13)70487-X.
- Marino, E., M. Caruso, D. Campagna, and R. Polosa. 2015. Impact of air quality on lung health: Myth or reality? Ther Adv. Chronic Dis. 6 (5):286–298. doi:10.1177/2040622315587256.
- Mesiar, R. 1995. Choquet-like integrals. J. Math. Anal. Appl. 194 (2):477–488. doi:10.1006/jmaa.1995.1312.
- Miri, M., Z. Derakhshan, A. Allahabadi, E. Ahmadi, G. O. Conti, M. Ferrante, and H. E. Aval. 2016. Mortality and morbidity due to exposure to outdoor air pollution in Mashhad metropolis, Iran. The AirQ model approach. Environ. Res. 151:451–457. doi:10.1016/j.envres.2016.07.039.
- Mohammed, M. O. A., W. W. Song, W. L. Ma, W. L. Li, Y. F. Li, A. U. Khan, M. A. E. M. Ibrahim, O. A. Maarouf, A. A. Ahmed, and J. J. Ambuchi. 2016. Potential toxicological and cardiopulmonary effects of PM2.5 Exposure and Related Mortality: Findings of Recent Studies Published during 2003-2013. Biomed. Environ. Sci 29 (1):66–79. doi:10.3967/bes2016.007.
- Shen, Z. X., J. J. Cao, L. M. Zhang, Q. Zhang, R. J. Huang, S. Liu, Z. Zhao, C. Zhu, Y. Lei, H. Xu, and C. Zheng. 2016. Retrieving historical ambient PM2.5 concentrations using existing visibility measurements in Xi’an, Northwest China. Atmos. Environ. 126:15–20. doi:10.1016/j.atmosenv.2015.11.040.
- Sugeno, M. 2015. A Way to Choquet Calculus. IEEE Fuzzy Syst. 23 (5):1439–1457. doi:10.1109/TFUZZ.2014.2362148.
- Wang, S. F. 2017. Interval-valued intuitionistic fuzzy Choquet integral operators based on Archimedean t-norm and their calculations. J. Comput. Anal. Appl. 23 (4):703–712.
- Wang, S. J., H. T. Ma, and Y. B. Zhao. 2014. Exploring the relationship between urbanization and the eco-environment-A case study of Beijing-Tianjin-Hebei region. Ecol. Indic. 45:171–183. doi:10.1016/j.ecolind.2014.04.006.
- Wu, J., F. Chen, C. Nie, and Q. Zhang. 2013. Intuitionistic fuzzy-valued Choquet integral and its application in multicriteria decision making. Inform. Sci. 222:509–527. doi:10.1016/j.ins.2012.07.056.
- Yager, R. R. 2016. Evaluating choquet integrals whose arguments are probability distributions. IEEE Fuzzy Syst. 24 (4):957–965. doi:10.1109/TFUZZ.2015.2500219.
- Yang, W. S., H. Zhao, X. Wang, Q. Deng, W. Y. Fan, and L. Wang. 2016. An evidence-based assessment for the association between long-term exposure to outdoor air pollution and the risk of lung cancer. Eur. J. Cancer Prev. 25 (3):163–172. doi:10.1097/CEJ.0000000000000158.
- Yarahmadi, M., M. Hadei, S. S. H. Nazari, G. O. Conti, M. R. Alipour, M. Ferrante, and A. Shahsavani. 2018. Mortality assessment attributed to long-term exposure to fine particles in ambient air of the megacity of Tehran. Environ. Sci. Pollut. R 25 (14):14254–14262. doi:10.1007/s11356-018-1680-4.
- Yazdi, M. N., M. Delavarrafiee, and M. Arhami. 2015. Evaluating near highway air pollutant levels and estimating emission factors: Case study of Tehran. Iran Sci. Total Environ. 538:375–384. doi:10.1016/j.scitotenv.2015.07.141.
- Yorifuji, T., S. Kashima, T. Tsuda, K. Ishikawa-Takata, T. Ohta, K. Tsuruta, and H. Doi. 2013. Long-term exposure to traffic-related air pollution and the risk of death from hemorrhagic stroke and lung cancer in Shizuoka, Japan. Sci. Total Environ. 443 (3):397–402. doi:10.1016/j.scitotenv.2012.10.08.