
 ?Mathematical formulae have been encoded as MathML and are displayed in this HTML version using MathJax in order to improve their display. Uncheck the box to turn MathJax off. This feature requires Javascript. Click on a formula to zoom.
ABSTRACT
Rapid economic growth in China has resulted in a significant increase in particulate matter (PM2.5) and sulfur dioxide (SO2), the reduction of which has become a primary government focus. However, as the energy consumption and air pollutant emissions in Chinese cities have very significant regional characteristics, individual governance measures are necessary. This study used 2013 to 2016 energy consumption data from 31 Chinese cities to evaluate the dynamic efficiency of the urban environments. Labor, fixed assets, and energy consumption were taken as the inputs, gross domestic product (GDP) was taken as the output, and particulate matter (PM2.5) and sulfur dioxide (SO2) were taken as the carry-over variable indicators. Using a meta-frontier dynamic DEA model, the 31 cities were classified into high-income and upper-middle-income cities, the overall 2013–2016 energy consumption and air pollutant efficiency scores were analyzed, and improvements and changes were recommended to increase the efficiencies. Large differences were found in the energy consumption and air pollution emissions efficiency scores and the needed improvements, with the hig-income cities performing better overall than the upper-middle-income cities. While there have been some significant improvements in SO2 emissions, PM2.5 improvements have been far slower. Therefore, in most cities, more control measures are needed to control PM2.5 emissions. However, in addition to improving PM2.5 in the upper-middle-income cities, SO2treatments are also needed.
Implications: There are big differences in the expectation of improvement of the two pollutants in all cities. In many Western cities, the expectation of PM2.5 improvement in the past years has not been reduced, but has been expanding. This shows that the central government has unified the air pollution control policies and the existing air pollution control measures formulated and implemented by the local governments.
Introduction
Rapid economic growth in China has seen a significant increase in fossil-fuel-generated energy consumption, which in turn has resulted in a massive increase in air pollution. Because of the effects on urban life, human health, and the environment, the government has begun to focus on reducing particulate matter (PM2.5) and sulfur dioxide (SO2) emissions. If these emissions are not controlled, besides affecting resident health, labor input and sustainable economic and social development could be seriously affected over the medium to long term. Sustained economic growth has been increasing the demand for energy; however, as the development of new energy sources is not yet great enough to replace traditional fossil fuels, the increased energy consumption from industrial developments and urban expansion is continuing to exacerbate the already serious air pollution problems in many Chinese cities. As a result, governments are seeking ways to use their available resources more efficiently to obtain maximum output with minimum air pollution.
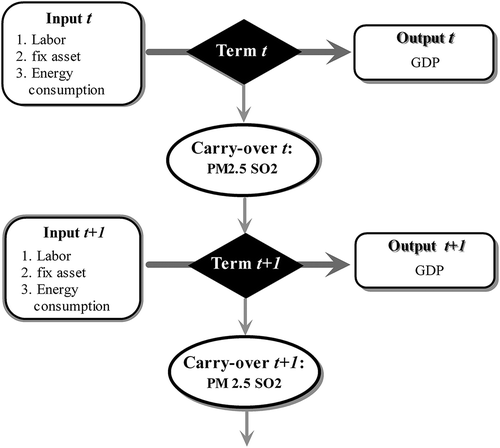
Figure 1. Structural diagram for the DN-DEA.
Since 2012, both central and local governments have been focusing on air pollution control by implementing specific measures and adopting more effective governance. While there have been some positive results, in many cities the air pollution remains a serious problem. In particular, cities that have adverse meteorological or geographical conditions are only achieving marginal success from their air pollution control efforts. China has obvious regional economic and social development differences (Lin and Du Citation2013; Lin and Du Citation2014; Du, Xie, and Ouyang Citation2017), with high-income and upper-middle-income regions varying greatly in terms of resource endowments, geographical conditions, traffic conditions, natural environments (Chiu et al. Citation2012; Wang et al. Citation2015; Hang et al. Citation2015), and air pollution control.
In general, while existing policy measures have been marginally successful in the short term, over the long term, the results are not satisfactory, and there are significant regional differences. Further, the lasting effects of targeted governance efforts have been minimal, indicating that these policies and measures have failed to fundamentally solve the air pollution problems or the sources of the problems.
When evaluating a city’s or a country’s economic growth and energy consumption performance, most previous research has focused on energy consumption and carbon emissions research (Zaim and Taskin Citation2000; Färe and Grosskopf Citation2004; Hu and Wang Citation2006; Kumar Citation2006; Gomes and Lins Citation2007; Zhou, Ang, and Poh Citation2008; Yeh, Chen, and Lai Citation2010; Zhang et al. Citation2011; Choi, Zhang, and Zhou Citation2012; Wang, Wei, and Zhang Citation2013; Lin and Yang Citation2014; Zhou, Chung, and Zhang Citation2014; Pan, Liu, and Peng Citation2015; Wu et al. Citation2015; Liou et al. Citation2015; Meng et al. Citation2016; Wang, Chiu, and Chiu Citation2017; Du, Xie, and Ouyang Citation2017; Feng, Zhang, and Huang Citation2017).
Many studies have used dynamic data envelopment analysis (DEA) models to analyze the energy and environmental efficiencies in different countries (Zofio and Prieto Citation2001; Ramanathan Citation2005; Kumar Citation2006; Gomes and Lins Citation2007; Zhou, Poh, and Ang Citation2007; Li and Wang Citation2014; Liu and Wang Citation2014; Robaina-Alves, Moutinho, and Macedo Citation2015; Gómez-Calvet et al. Citation2016) and different enterprises. For example, Pacudan and de Guzman (Citation2002) evaluated the energy efficiency of 15 power companies in the Philippines, Vaninsky (Citation2008) examined the environmental efficiency of U.S. power companies during 1990–2006, Lin, Liu, and Lewis (Citation2012) assessed the CO2 emissions impact of the electricity sector, and Liu, Lin, and Lewis (Citation2013) evaluated the NOX, SOX, and CO2 emissions in Taiwan’s thermal power plants.
Studies that have examined the relationship between air pollutants and economic development have tended to focus more on carbon dioxide emissions, SO2, NO2, and economic development. For example, Grossman and Krueger (Citation1991) found that the SO2 emissions in urban areas fitted an inverted U-shaped curve and that the content of atmospheric suspended particles increased with an increase in per-capita gross domestic product (GDP). Shafik and Bandyopadhyay (Citation1994) found that as per-capita income increased, the SO2 emissions initially were greater, but then improved; however, the carbon dioxide emissions continued to increase with economic growth. Selden and Song (Citation1994) determined that the emissions of four main air pollutants (SO2, CO2, NO2, and suspended particulate matter [SPM]) all had an inverted U-shaped relationship with per-capita income. Vincent (Citation1997), however, found that there was no obvious inverted U-shaped relationship between Malaysia’s economic growth and seven pollution indicators. In contrast, List and Gallet (Citation1999) found that there was an inverted U-shaped relationship between economic growth in the United States and sulfur dioxide and nitrogen oxides.
Energy consumption carbon emissions and economic growth have been jointly examined using panel data (Pao and Fu Citation2013; Wesseh and Lin Citation2016a, Citation2016b; Bhattacharya et al. Citation2016), and some studies have included sewage and sulfur dioxide as environmental pollution indicators to evaluate urban environmental energy efficiency. For example, Shi, Bi, and Wang (Citation2010) and Wang, Feng, and Zhang (Citation2014) included atmospheric pollutants and especially particulate matter (PM2.5) as undesirable outputs when evaluating environmental efficiency.
From the studies just described, it can be seen that most DEA research has evaluated urban efficiency on a national level, with few papers focusing on the overall efficiency in cities in different regions. However, large countries such as China have significant regional differences and varying levels of economic development and resource endowments. Therefore, to gain a more comprehensive picture of the conditions in China, it is necessary to analyze and compare the urban efficiencies across the regions, as well as the overall urban efficiency to ensure accurate policy recommendations. Most studies on energy consumption and environmental efficiency have all included (or only included) carbon dioxide as the undesirable output, with few including other pollutants.
Therefore, in this study, a meta-frontier dynamic DEA model (data envelopment method) is employed to evaluate the 2013 to 2016 energy consumption and overall air pollutant efficiency in 31 Chinese cities so as to suggest improvements and changes. The energy consumption and air pollutant emission efficiency assessment in each city is examined to ensure that precise and effective policy recommendations and measures are given that match the regional situation.
The main differences between this study and previous studies are as follows: (1) This study evaluates and compares regional urban environmental efficiencies using a meta-frontier dynamic DEA model. By including environmental pollution indicators in the dynamic model, the true impact of the environmental pollution on the total efficiency and energy efficiency of each city in each year can be determined. If these environmental pollution variables were not included, the overall efficiency in each city would be over- or underestimated. (2) This paper includes the atmospheric pollutants PM2.5 and SO2 as undesirable output indicators to more effectively evaluate the environmental pollution problems in Chinese cities, which allows for the relationship between the atmospheric environmental pollutants, investment, and economic factors to be deconstructed so as to determine the problems more accurately and make more suitable policy recommendations. (3) Using the World Bank Classification, the 31 cities are divided into high-income and upper-middle-income cities and the meta-frontier dynamic DEA is used to identify the differences in energy utilization, economic output, and pollutant emissions in each city to accurately evaluate each city’s efficiency values.
Research method
Dynamic DEA
The dynamic DEA (D-DEA) method was developed by Klopp (Citation1985), who also proposed a window analysis for the D-DEA approach. Färe et al. (Citation1994) then proposed the Malmquist index (MPI); however, neither of these methods analyzed the interaction effect between two carry-over periods. To assess the efficiency over multiple carry-over periods, Färe and Grosskopf (Citation1996) proposed a new dynamic impact analysis for consecutive activities. Subsequently, several DEA dynamic studies were conducted by Nemoto and Goto (Citation1999, Citation2003), Sueyoshi and Sekitani (Citation2005), Bogetoft et al. (Citation2008), Chen (Citation2009), Park and Park (Citation2009), and Chen et al. (Citation2009).
Tone and Tsutsui (Citation2010) then extended the model to a slack-based measures (SBM) dynamic DEA model, after which they developed the weighted SBM dynamic DEA model in which a carry-over classified as desirable (good), undesirable (bad), discretionary (free), or nondiscretionary (fixed) was employed as a dynamic period link. The D-DEA model can be divided into three types: input-oriented, output-oriented, and non-oriented.
In this study, the overall efficiency (OE) and term efficiency (TE) were assessed using a non-oriented SBM dynamic DEA approach, in which there is an independent input and output for each DMU, as well as a carry-over link from period t to period t + 1to determine the changes across two periods. shows the structure of the dynamic DN used in this study.
In the model, there are n DMU (Decision Making Units)s (j = 1, 2, …, n) over T periods (t = 1, 2, …, T). Each DMU has multiple different and independent inputs and outputs in each time period, with the z-good being the carry-over from period t to period t + 1, which is guaranteed by eq 1:
in which α indicates good (bad, free, fixed, etc.).The non-oriented overall efficiency (δ*) is calculated using eq 2, and ωt and ωi are the weights for each period t and the input:
The non-oriented efficiency term (ρ*) follows as in eq 3:
Meta-frontier DN-DEA
Ruttan, Binswanger, and Hayami (Citation1978) defined the meta-frontier as a development curve for all groups, thereby allowing a common basis from which to measure the efficiency across different groups. Battese and Rao (Citation2002) and Battese et al. (Citation2004) demonstrated that the technical efficiency (TEE) of different groups could be compared using a meta-frontier model, and Thanassoulis, Portela, and Despic (Citation2008) developed a convex meta-frontier concept and found that even under technology exchange, groups using advanced technology for production purposes would do so because of the enhanced technology, which led to more outward expansion and improved business performance over a time period. O’Donnell, Rao, and Battese (Citation2008) established a meta-frontier model that could accurately calculate group and meta-frontier technical efficiencies. However, the traditional DEA usually assumes that all producers have the same technology level, which is somewhat unrealistic as assessed DMUs are often in different geographical locations and may operate under different national policies and socioeconomic conditions, which means that the technological levels may also be different. Therefore, based on the Tone and Tsutsui (Citation2010) SBM dynamic DEA, the O’Donnell, Rao, and Battese (Citation2008) meta-frontier model, and the weighted SBM meta-frontier dynamic DEA (MFD-DEA) model, the model in this study was established as follows.
Meta-frontier (MF):
Under different management types, resources, regulations, and environmental factors, it is assumed that all units (N) are composed of DMUs in g groups (N = N1 + N2 +….+NG); xij and the meta-frontier yrj indicates input item i (i = 1, 2, …, m) of item j (j = 1, 2, …, N) and output item r (r = 1, 2, …, s) of item j (j = 1, 2, …, N), with the k from the DMU being chosen as the most favorable final output weight to ensure maximum efficiency value. The meta-frontier k for the DMU efficiency is solved using the following linear programming (LP):
Using eqs 3, 4, and 5, the overall technical efficiency (MFOE) value for all DMUs under the meta-frontier is then determined.
(2) Group frontier (GF):
All DMUs are then divided into g groups. Each DMU under the group frontier chooses the most favorable final output weight so that the efficiency of the DMUs under the group frontier can be solved using the following equation:
(3) Technology gap ratio (TGR):
As the meta-frontier contains the group frontier of g groups, the technical efficiency of the meta-frontier (MFE) is less than the technical efficiency of the group frontier (GFE). The ratio value, called the technical efficiency gap ratio (or technology gap ratio, TGR), is shown as
Empirical results
Data and variables
This study used panel data from 31 capital cities of the most developed cities in China, which were divided into high income and upper-middle income. Data from 2013 to 2016 were extracted from the Statistical Yearbook of China, the Demographics and Employment Statistical Yearbook of China, and the statistical yearbooks from each city. Air pollutant data were collected from China Environmental Protection bureau reports.
Input variables
Labor (em) (unit: person): The number of labor registrations in each city at the end of each year.
Fixed assets (asset) (unit: 100 million CNY): Capital stock in each city was calculated from fixed assets investment. Each city’s fixed assets are calculated based on perpetual inventory method and using the 1990 price level as a base period.
Energy consumption (com) (unit: 100 million tonnes): The total energy consumption in each city.
Output variable
(E) Gross domestic production (GDP) (unit: 100 million CNY): The GDP in each city was taken as the city’s output.
Carry-over variables
PM2.5 is an important index in the Air Quality Index (AQI), and refers to atmospheric particulate matter (PM) that has a diameter of less than 2.5 µm, or PM2.5. The available PM2.5 data in China were taken from the 2012 AQI index daily reports when it became law to publish this index in all Chinese cities. Unit: micrograms per cubic meter.
Compared to the API before 2012, which included the three main pollutants PM10, SO2, and NO2, the AQI is an officially applied air quality index that includes six main air pollutants; PM2.5, PM10, SO2, NO2, O3, and CO. Therefore, the AQI more accurately reflects the air quality situation by measuring PM2.5 and the other main pollutants most affecting the lives of residents in China. For most months of the year, PM2.5 has the most visible impact on atmospheric pollution, which makes the inclusion of PM2.5 in this study more relevant to all parties.
One of the main atmospheric pollutants, sulfur dioxide (chemical formula SO2) is the most common and the simplest sulfur oxide. It can be released naturally by volcanic activity, but is also produced as a by-product of the burning of fossil fuels contaminated with sulfur compounds. When sulfur dioxide is dissolved in water, it forms sulfite, and if sulfite is oxidized further by PM2.5, it rapidly and efficiently produces sulfuric acid (the main component of acid rain), which can have serious environmental effects. Unit: micrograms per cubic meter.
In this study, both PM2.5 and SO2 concentrations are measured. In reality, the concentrations area product of the particulate matter emissions. Although more frequent data (which would provide more variability) regarding the PM2.5 and SO2 emissions were able to be obtained, data on the other variables for the same time frame were not available. Therefore, average PM2.5 and SO2 data were used as a conservative test of the hypothesis, as it was not possible to capture the fluctuations in the particulate emissions.
Traditionally, research has divided China into eastern, central, and western regions based on geographical location; however, these classifications do not directly reflect the variations in production technology levels (Lin and Kerui Citation2013; Lin and Kerui Citation2014). Lin and Kerui (Citation2013) used cluster analysis to classify 30 China’s administrative provinces into three groups. Each group should include at least two regions from the central, western, and eastern regions. For example, group 1 consists of eight provinces from the eastern region and two provinces from the central region. This method can more accurately reflect the difference of production technology.
However, as there are significant resource endowment, energy utilization, economic output, and pollutant emissions differences in Chinese cities, in the environmental energy efficiency analysis of the performances, these differences need to be reflected in the variables, particularly as economic development levels have been found to be associated with production technology level variations (Chiu et al. Citation2012; Wang et al. Citation2015; Hang et al. Citation2015). Therefore, based on the World Bank’s classification for rich and poor countries, the 31 cities were divided into high-income cities and upper-middle-income cities. From my investigation (World Bank classification), upper-middle-income economies are those with a gross national income (GNI) per capita between $3,896 and $12,055; high-income-economies are those with a GNI per capita of $12,056 or more.
This study divided the 31 sample cities into two regions: high-income cities, which were Beijing, Changsha, Fuzhou, Guangzhou, Hangzhou, Huhehot, Jinan, Nanchang, Nanjing, Shanghai, Shenyang, Tianjin, Wuhan, and Zhengzhou (14 cities in total), and upper-middle-income cities, which were Chengdu, Changchun, Chongqing, Guiyang, Harbin, Haikou, Hefei, Kunming, Lanzhou, Lhasa, Nanning, Shijiazhuang, Taiyuan, Urumqi, Xian, Xining, and Yinchuan (17 cities in total).
Statistical analysis of inputs and output
From the statistical analysis results shown in , it can be seen that there are obvious differences in labor force, fixed asset investment, and GDP growth in China’s high-income and upper-middle-income cities. All input–output indicators show that the average level in high-income cities was significantly higher than in the upper-middle-income cities. In terms of labor input, the number of working people in the high-income cities was on average higher than in the upper-middle-income cities. The annual data on the ratio between the labor force in the upper-middle-income and the high-income cities in China were basically stable, ranging from 0.699 in 2013 to 0.693 in 2016, indicating that the attraction and aggregation of the labor force in high-income cities continued to be higher than in the upper-middle-income cities. From 2013 to 2016, the average energy consumption in the high-income cities was also higher than in the upper-middle-income cities, with the average ratio of the high-income cities to the upper-middle-income cities showing little change from 0.595 in 2013 to 0.626 in 2016.
Table 1. Statistical data analysis for the upper-middle and high-income cities from 2013 to 2016.
The average economic growth rate in the high-income cities was obviously higher than the national average and the average in the upper-middle-income cities, and the gap between the high-income cities and the upper-middle-income cities for the other indicators was even greater. In 2013, the ratio of urban GDP in the high-income and upper-middle-income cities was 0.400, which by 2016 had increased minimally to 0.410, indicating that there continued to be a large economic growth gap between the high-income and upper-middle-income cities. While the gap between economic growth in the high-income and upper-middle-income cities narrowed, development was very slow. However, the investment in fixed assets increased more rapidly than the increase in GDP, and although the average total fixed assets in the high-income cities was higher than in the upper-middle-income cities, the average fixed asset ratio in the upper-middle-income and high-income cities was steadily increasing from 0.660 in 2013 to 0.727 in 2016. With the continuous implementation of development policies in the upper-middle-income cities, development in the upper-middle-income cities has intensified.
Empirical results and the PM2.5 city efficiency rankings
This study examines the dynamic environmental pollution links because if environmental pollution were not considered in the model, there would be higher average urban efficiencies and lower urban differences. Cities with higher environmental pollution in terms of the PM2.5 and SO2 emissions would have higher average efficiencies if the environmental pollution variable were not considered. For example, the efficiency in Tianjin would increase from 0.55 (Rank 10) to 1 (Rank 1), and the efficiency in Xian would increase 0.361 from (Rank 21) to 0.8167 (Rank 14).
DEA-Solver 13.0 was used to evaluate energy use and the PM2.5 emissions efficiencies to assess the bad output and the improvements over time. Using the meta-frontier approach, the total energy use and pollutant discharge efficiency scores were first calculated, with the dynamic environmental efficiency in the high-income cities and upper-middle-income cities being calculated separately. Then the efficiency of each city was compared with the efficiencies in all other cities to determine the degree of improvement necessary.
Environmental efficiencies in the high-income and upper-middle-income cities from 2013 to 2016
shows the 2013–2016scores and rankings for the energy and air pollutant emission efficiencies in the 31 cities as well as the annual efficiency scores. Four of the 31 cities, Beijing, Guangzhou, Nanning, and Shanghai, were found to have perfect efficiency, which indicated that these cities were effectively using energy and controlling air pollution emissions. Nanning, Beijing, Guangzhou, and Shanghai are high-income cities, with Guangzhou and Shanghai being located in the eastern coastal areas of China. Generally, the overall energy use and air pollutant emissions efficiencies in the high-income cities was higher than in the upper-middle-income cities, with only two high-income cities, Huhehot and Nanchang, performing poorly. The efficiency scores for Fuzhou, Changsha, Wuhan, and Tianjin were also quite low at only 0.48, 0.52, 0.54, and 0.55, respectively, which indicated that these cities needed to improve their air pollution control efforts.
Table 2. Environmental efficiency scores from 2013 to 2016.
The dynamic analysis showed that the efficiency scores for Jinan, Nanjing, Hangzhou, and Shenyang increased from 2013 to 2016. Jinan’s efficiency score increased from 0.61 in 2013 to 1 in 2016, Shenyang’s increased from 0.56 in 2013 to 1 in 2016, Nanjing’s changed slightly from 0.50 in 2013 to 0.61 in 2016, and Hangzhou’s changed minimally from 0.55 in 2013 to only 0.61 in 2016.
The cities with the top five efficiency scores from the upper-middle-income cities were Nanning (1), Chongqing (0.51), Chengdu (0.50), Harbin (0.47), and Changchun (0.46). The cities with the lowest scores were Urumqi (0.35), Kunming (0.34), Haikou (0.30), Guiyang (0.28), Lhasa (0.257), Shijiazhuang (0.232), Taiyuan (0.232), Lanzhou (0.231), Yinchuan (0.23), and Xining (0.18). As these cities had the lowest city efficiencies, there is significant need for improvement.
From 2013 to 2016, the changes in the upper-middle-income cities’ dynamic efficiency scores showed that in addition to Haikou, Lhasa, Shijiazhuang, Urumqi, and Yinchuan had the highest increase in their efficiency scores. Cities with greater efficiency increases were Xining (0.09), Chongqing (0.07), and Guiyang (0.05), with the other cities having less than a 0.05 change, indicating that pollutant emissions management and existing control measures needed to be more accurate and better targeted.
There were four upper-middle-income cities, Chongqing, Chengdu, Guiyang, and Xining, that had significant environmental efficiency improvements relative to other upper-middle-income cities, with Chongqing achieving 0.5145, Chengdu achieving 0.4951, Guiyang achieving 0.2797, and Xining achieving 0.1841.
Changes in environmental dynamic efficiency from 2013 to 2016
Chongqing’s urban environmental dynamic efficiency score increased from 0.4809 in 2013 to 0.5527 in 2016, and Guiyang also improved year by year, from 0.2479 in 2013 to 0.2998 in 2016. The dynamic environmental efficiency in Chengdu and Xining fluctuated, with Chengdu’s score being 0.4664 in 2013, 0.4774 in 2014, 0.5273 in 2015, and 0.5102 in 2016. Most notably, Xining’s efficiency score ranked last of all cities over time, decreasing from 0.1781 in 2013, falling again to 0.1735 in 2014 and 0.1706 in 2015 before rising to 0.2655 in 2016, all of which indicated that Xining had extremely poor urban environmental efficiency.
A Wilcoxon signed rank test was applied to further test the differences between the upper-middle- and high-income city efficiencies. The p values were compared with the confidence levels α set at 0.01 and 0.05 to identify the differences in the average efficiencies between the two regional groups. gives the detailed test results. At a significance level of 5%, the high-income cities’ efficiencies from 2013 to 2016 were found to be significantly different from those of the upper-middle-income cities.
Table 3. Wilcoxon signed rank test for average technical efficiency.
Differences between overall efficiency and regional efficiency
shows the overall and regional efficiency scores for energy use, air pollutant emissions, and the ratio of the regional efficiency scores to the total efficiency scores in the 31 cities from 2013 to 2016.
Table 4. Overall efficiency and regional efficiency differences.
Overall, four cities, Beijing, Guangzhou, Nanning, and Shanghai, had overall and regional efficiency ratings of 1, with all but Nanning being high-income cities, clearly showing that the urban environmental efficiency and total urban environmental efficiency in the high-income cities were significantly higher than in the upper-middle-income cities. While six of the upper-middle-income cities, Chengdu, Changchun, Chongqing, Harbin, Hefei, and Urumqi, had regional efficiency scores of 1, generally, the upper-middle-income cities were relatively inefficient. The overall efficiency scores further indicated that there was significant need for improvement in the upper-middle-income cities compared to the high-income cities.
For example, in 2013, the gap between the regional efficiency and the overall efficiency in most upper-middle-income cities was almost 0.5–0.6 in cities such as Chengdu, Changchun, Chongqing, Harbin, Hefei, and Urumqi. The gaps for Haikou, Taiyuan, and Xian were slightly smaller, but were still around 0.3. Urumqi had the largest gap of 0.65.
From 2013 to 2016, the efficiency in many cities improved significantly and the gap between overall efficiency and regional efficiency was generally shrinking. However, there were still some cities in which the efficiency was declining over time, such as Urumqi, where the efficiency dropped from 0.3602 in 2013 to 0.3259 in 2016. In addition, some cities such as Taiyuan and Harbin had had no obvious changes or improvements.
A Wilcoxon signed rank test was applied to further test the technological gap differences between the high-income and upper-middle-income cities. gives the detailed test results. At a 5% significance level, the technological gap from 2013 to 2016 was found to be significantly better in the high-income cities than in the upper-middle-income cities.
Table 5. Wilcoxon signed rank test for the technology gap.
Air pollutant emissions improvements from 2013 to 2016
In most cities, the PM2.5 emissions narrowed from 2013 to 2016, with Jinan, Chongqing, and Kunming having the greatest improvements. The best PM2.5 emissions performance was in Jinan, which fell from 21.41% in 2013 to 0% in 2016, indicating that the PM2.5 management was effective. The PM2.5 emissions in Chongqing fell from 51.31% in 2013 to 40.29% in 2016, Kunming’s dropped from 50.06% in 2013 to 43.42% in 2016, and Shenyang’s fell from 1.16% in 2013 to 0 in 2016. The other cities, Changchun, Changsha, Nanchang, Nanjing, and Wuhan, had PM2.5 emissions reductions of around 3% from 2013 to 2016.
In addition to the obvious improvement of PM2.5 emissions in the cities just listed, there are 11 cities whose PM2.5 emissions have not improved significantly or even increased emissions. These cities are Chengdu, Fuzhou, Haikou, Hangzhou, Lanzhou, Lhasha, Taiyuan, Tianjin, Urumqi, Yinchuan, and Zhengzhou. Of these, Chengdu’s PM2.5 emissions increased sharply from 36.7% in 2013 to 52.05% in 2016. The emission improvement space of Zhengzhou continued to rise from 44.3% in 2013 to 52.2% in 2016, indicating that its PM2.5 emissions continued to rise. The space of Fuzhou’s emission improvement also increased from 50.3% in 2013 to about 65% in 2015. Although it declined slightly in 2016, it was also higher than 2013, up to about 56%, and the improvement of space was expanded; the emissions of Taiyuan, Tianjin, Urumqi, Yinchuan, and other cities were also expanded by about 3%.
Therefore, these cities had poor PM2.5 governance, and need to adopt more effective measures to reduce the PM2.5 emissions based on their specific conditions and characteristics.
The improvement needed in SO2 emissions in most cities was very high at about 50% on average in 2013; however, in some cities, the SO2 emissions were even worse. For example, a 97.62% SO2 emissions improvement was needed in Yinchuan, 95.23% in Lhasa, 94.91% in Huhehot, 92.16% in Xining, 88.27% in Taiyuan, 84.31% in Lanzhou, and 82.24% in Urumqi. The lowest SO2 emissions improvements were needed in Fuzhou, Jinan, and Chongqing at 37%, which was still relatively high.
Over time, however, the need for SO2 emissions improvements in most cities narrowed. For example, Shenyang’s dropped from 54.08% in 2013 to 0 in 2016, Jinan’s dropped from 34.37% to 0%, Wuhan’s dropped from 48.89% in 2013 to 16.37% in 2016, Chengdu’s dropped from 58.04% in 2013 to 28.07% in 2016, Tianjin’s dropped from 58.52% in 2013 to 33.26% in 2016, and Chongqing’s dropped from 37.49% to 17.37%. However, the need for SO2 emissions improvements worsened in Changchun, Harbin Haikou, Hefei, Kunming, Lhasa, Shijiazhuang, Taiyuan, Xining, and Yinchuan; in particular, Fuzhou’s rose from 30% to 92%. Compared with the needed PM2.5 emissions improvements, governance efforts need to be more focused on SO2 emissions.
Policy implications
The effects of the governance measures in the 31 cities varied widely, possibly due to the different pollution sources, the pollutant source controls, and the pollutant emissions controls, as well differences in topography and geography ().Therefore, the central government needs to give local governments greater power to address the sources of air pollution based on the characteristics of the regions in which cities are located, the economic development stage, the natural resource endowments, and the geographical and meteorological conditions. Depending on the air pollution emissions and the energy consumption structural adjustments needed and other aspects, governments need to work together to develop governance standards and measures that are in line with the local development characteristics.
Table 6. PM2.5 and SO2 emissions from 2013 to 2016 (unit for PM2.5 and SO2 emission difference is %).
Table 7. Air pollutant emissions changes from 2013 to 2016 and the governance focus.
The economic strength of the high-income cities was at a generally high level as their economic development stages were no longer dependent on industrial production input and output and relied more on the development of new high-tech industries and the tertiary sector. As a whole, the high-income cities have less need to improve their air pollution and environment efficiencies than the upper-middle-income cities. Therefore, the central government should formulate different assessment methods for the high-income and upper-middle-income cities to guide local governments in developing effective localized action and to avoid dichotomous policies that restrict creativity in the high-income cities and restrict sustainable development in the upper-middle-income cities.
Economic development in the upper-middle-income cities was found to be relatively backward, with economic growth being more dependent on industrial production growth, most of which was driven by fossil fuels such as coal and oil, which caused excessive air pollutants. In particular, as the PM2.5 and SO2 emissions improvements needed in Lhasa, Xining, Yinchuan, Taiyuan, and Urumqi were found to be very high, treatment measures in these cities should focus on industrial restructuring and industrial technology up grading.
Compared with the SO2 emissions improvements needed, the PM2.5 emissions improvements needed in most cities was somewhat static. With the increase in population and the rapid expansion of cities, the air pollution from urbanization and population concentrations has increased in the upper-middle-income cities. Coupled with the topography and meteorological conditions, which mean that the air pollution cannot be easily diffused or is exacerbated by air pollution in surrounding cities, air pollution has become more difficult to manage. Therefore, it is necessary for most cities to ensure that the comprehensive PM2.5 emissions management, prevention, and control measures being taken account for the demographic characteristics, the economic development, the geographical location, the geological conditions, the resource endowments, the urban planning and layout, and the industrial development in their respective cities; that is, local governments need to control the air pollution sources based on local conditions.
Conclusion
PM2.5 and SO2 emissions not only seriously endanger resident health, but also affect labor input and socioeconomic development over the medium to long term. Therefore, countries deeply affected by environmental air pollution need to use effective measures to deal with the air pollution problems. This study used a meta-frontier dynamic DEA model to evaluate the intertemporal efficiencies in 31 cities in China from 2013 to 2016, from which several conclusions were made.
The input–output indicators showed that the average efficiency was significantly higher in the high-income cities than in the upper-middle-income cities.
The energy consumption andPM2.5 and SO2 emissions varied widely. In general, the energy consumption and air pollutant emissions in the high-income cities were better than in the upper-middle-income cities.
From 2013 to 2016, the overall efficiency and technological gap scores in the high-income cities were significantly higher than in the upper-middle-income cities.
There were also large differences in the percentage improvements needed for the two pollutant emissions. In many upper-middle-income cities, the need for PM2.5 improvements remained relatively static and was expanding in some cities. Therefore, while the central government has unified air pollution control policies, there need to be better and more focused air pollution control measures developed and implemented by local governments.
Additional information
Funding
Notes on contributors
Ying Li
Ying Li is an associate professor of Business School, Sichuan University, Chengdu, People’s Republic of China
Yung-ho Chiu
Yung-ho Chiu is a professor of Department of Economics at Soochow University, Taipei, Taiwan.
Liang Chun Lu
Liang Chun Lu is a Ph.D. student of Department of Economics at Soochow University, Taipei, Taiwan.
References
- Battese, G. E., and D. S. P. Rao. 2002. Technology gap, efficiency, and a stochastic metafrontier function. Int. J. Business Econ. 1:87–93.
- Battese, G. E., D. S. P. Rao, and C. J. O’Donnell. 2004. A meta frontier production function for estimation of technical efficiencies and technology gaps for firms operating under different technologies. J. Product. Anal. 21:91–103. doi:10.1023/B:PROD.0000012454.06094.29.
- Bhattacharya, M., S. R. Paramati, I. Ozturk, and S. Bhattacharya. 2016. The effect of renewable energy consumption on economic growth: Evidence from top 38 countries. Appl. Energy 162:733–741. doi:10.1016/j.apenergy.2015.10.104.
- Bogetoft, P., D. L. Christensen, I. Damgard, M. Geisler, T. P. Jakobsen, M. Krøigaard, J. D. Nielsen, J. B. Nielsen, K. Nielsen, J. Pagter, et al. 2008. Multiparty computation goes live. Financial Cryptography Data Secur. Springer Berlin Heidelberg.5628: (325–343).
- Chen, C. M. 2009. Network-DEA, a model with new efficiency measures to incorporate the dynamic effect in production networks. Eur. J. Oper. Res. 194 (3):687–699. doi:10.1016/j.ejor.2007.12.025.
- Chiu, C. R., J. L. Liou, P. I. Wu, and C. L. Fang. 2012. Decomposition of the environmental inefficiency of the meta-frontier with undesirable output. Energy Econ. 34 (5):1392–1399. doi:10.1016/j.eneco.2012.06.003.
- Choi, Y., N. Zhang, and P. Zhou. 2012. Efficiency and abatement costs of energy-related CO2 emissions in China: A slacks-based efficiency measure. Appl. Energy 98:198–208. doi:10.1016/j.apenergy.2012.03.024.
- Du, K., C. Xie, and X. Ouyang. 2017. A comparison of carbon dioxide (CO2) emission trends among provinces in China. Renew. Sust. Energy Rev. 73:19–35. doi:10.1016/j.rser.2017.01.102.
- Färe, R., and S. Grosskopf. 1996. Productivity and intermediate products: A frontier approach. Econ. Lett. 50 (1):65–70. doi:10.1016/0165-1765(95)00729-6.
- Färe, R., and S. Grosskopf. 2004. Modeling undesirable factors in efficiency evaluation: Comment. Eur. J. Oper. Res. 157:242–245. doi:10.1016/S0377-2217(03)00191-7.
- Färe, R., S. Grosskopf, M. Norris, and Z. Zhang. 1994. Productivity growth, technical progress, and efficiency change in industrialized countries. Am. Econ. Rev. 84 (1):66–83.
- Feng, C., H. Zhang, and J.-B. Huang. 2017. The Approach to realizing the potential of emissions reduction in China: An implication from data envelopment analysis. Renew. Sust. Energy Rev. 71:859–872. doi:10.1016/j.rser.2016.12.114.
- Gomes, E. G., and M. P. E. Lins. 2007. Modeling undesirable outputs with zero sum gains data envelopment analysis models. J. Oper. Res. Soc. 59:616–623. doi:10.1057/palgrave.jors.2602384.
- Gómez-Calvet, R., D. Conesa, A. R. Gómez-Calvet, and E. Tortosa-Ausina. 2016. On the dynamics of eco-efficiency performance in the European Union. Comput. Operations Res. 66:336–350. doi:10.1016/j.cor.2015.07.018.
- Grossman, G. M., and A. B. Krueger. 1991. Environmental impacts of a north American free trade agreement. Working Paper Ser. Natl. Bureau Econ. Res. Mass. 3914(39).
- Hang, Y., J. Sun, Q. Wang, Z. Zhao, and Y. Wang. 2015. Measuring energy inefficiency with undesirable outputs and technology heterogeneity in Chinese cities. Econ. Model. 49:46–52. doi:10.1016/j.econmod.2015.04.001.
- Hu, J. L., and S. C. Wang. 2006. Total factor energy efficiency of regions in China. Energy Policy 34 (17):3206–3217. doi:10.1016/j.enpol.2005.06.015.
- Klopp, G. A. (1985). The analysis of the efficiency of productive systems with multiple inputs and outputs. University of Illinois at Chicago, PhD, Doctor of Philosophy, Engineering, Industrial.
- Kumar, S. 2006. Environmentally sensitive productivity growth: A global analysis using malmquist–luenberger index. Ecol. Econ. 56:280–293. doi:10.1016/j.ecolecon.2005.02.004.
- Li, M., and Q. Wang. 2014. International environmental efficiency differences and their determinants. Energy 78:411–420. doi:10.1016/j.energy.2014.10.026.
- Lin, B., and L. Yang. 2014. Efficiency effect of changing investment structure on China׳s power industry. Renew. Sust. Energy Rev. 39:403–411. doi:10.1016/j.rser.2014.07.018.
- Lin, B., and K. Du. 2013. Technology gap and China’s regional energy efficiency: A parametric metafrontier approach. Energy Econ. 40:529–536. doi:10.1016/j.eneco.2013.08.013.
- Lin, B., and K. Du. 2014. Measuring energy efficiency under heterogeneous technologies using a latent class stochastic frontier approach: An application to Chinese energy economy. Energy 76:884–890. doi:10.1016/j.energy.2014.08.089.
- Lin, S. J., C. H. Liu, and C. Lewis. 2012. CO2 emission multiplier effects of Taiwan’s electricity sector by input-output analysis. Aerosol Air Qual. Res. 12:180–190. doi:10.4209/aaqr.2012.01.0006.
- Liou, J.-L., C.-R. Chiu, F.-M. Huang, and W.-Y. Liu. 2015. Analyzing the relationship between CO2 emission and economic efficiency by a relaxed two-stage DEA model. Aerosol Air Qual. Res. 15:694–701. doi:10.4209/aaqr.2014.04.0074.
- List, J. A., and C. A. Gallet. 1999. The environmental kuznets curve: Does one size fit all? Ecol. Econ. 31(3) 7–15.
- Liu, C. H., S. J. Lin, and C. Lewis. 2013. Evaluation of NOX, SOX and CO2 emissions of Taiwan’s thermal power plants by data envelopment analysis. Aerosol Air Qual. Res. 13:1815–1823. doi:10.4209/aaqr.2013.03.0070.
- Liu, F., and B. Wang. 2014. A mechanism for explaining the maximum intra-seasonal oscillation center over the upper-middle income North Pacific. J. Clim. 27:958–968. doi:10.1175/JCLI-D-12-00797.1.
- Meng, F., B. Su, E. Thomson, D. Zhou, and P. Zhou. 2016. Measuring China’s regional energy and carbon emission efficiency with DEA models: A survey. Appl. Energy 183:1–21. doi:10.1016/j.apenergy.2016.08.158.
- Nemoto, J., and M. Goto. 1999. Dynamic data envelopment analysis: Modeling intertemporal behavior of a firm in the presence of productive inefficiencies. Econ. Lett. 64:51–56. doi:10.1016/S0165-1765(99)00070-1.
- Nemoto, J., and M. Goto. 2003. Measurement of dynamic efficiency in production: An application of data envelopment analysis to Japanese electric utilities. J. Product. Anal. 19 (2):191–210. doi:10.1023/A:1022805500570.
- O’Donnell, C. J., D. S. P. Rao, and G. E. Battese. 2008. Metafrontier frameworks for the study of firm-level efficiencies and technology ratios. Empir. Econ. 34:231–255. doi:10.1007/s00181-007-0119-4.
- Pacudan, R., and E. de Guzman. 2002. Impact of energy efficiency policy to productive efficiency of electricity distribution industry in the Philippines. Energy Econ. 24 (1):41–54. doi:10.1016/S0140-9883(01)00085-8.
- Pan, X., Q. Liu, and X. Peng. 2015. Spatial club convergence of regional energy efficiency in China. Ecol. Indic. 51:25–30. doi:10.1016/j.ecolind.2014.10.026.
- Pao, H., and H. Fu. 2013. Renewable energy, non-renewable energy and economic growth in Brazil. Renew. Sust. Energy Rev. 25:381–392. doi:10.1016/j.rser.2013.05.004.
- Park, K. S., and K. Park. 2009. Measurement of multiperiod aggregative efficiency. Eur. J. Oper. Res. 193 (2):567–580. doi:10.1016/j.ejor.2007.11.028.
- Ramanathan, R. 2005. Estimating energy consumption of transport modes in India using DEA and application to energy and environmental policy. J. Oper. Res. Soc. 56:732–737. doi:10.1057/palgrave.jors.2601866.
- Robaina-Alves, M., V. Moutinho, and P. Macedo. 2015. A new frontier approach to model the eco-efficiency in European countries. J. Clean Product. 103:562–573. doi:10.1016/j.jclepro.2015.01.038.
- Ruttan, V. W., H. P. W. Binswanger, and W. Hayami. 1978. Factor productivity and growth: A historical interpretation. In Induced innovation: Technology, insitution, and developments, eds. H. P. Binswanger and V. W. Ruttan,1-21 Baltimore: John Hopkins University Press.
- Selden, T. M., and D. Q. Song. 1994. Environmental-quality and development - is there a kuznets curve for air-pollution emissions. J. Environ. Econ. Manag. 7 (2):147–162. doi:10.1006/jeem.1994.1031.
- Shafik, N., and S. Bandyopadhyay. (1994). Economic growth and environmental quality: Time series and cross-country evidence. Background paper for world development report. Washington, DC: World bank.
- Shi, G. M., J. Bi, and J. N. Wang. 2010. Chinese regional industrial energy efficient evaluation based on DEA model of Fixing non-energy inputs. Energy Policy 38 (10):6172–6179. doi:10.1016/j.enpol.2010.06.003.
- Sueyoshi, T., and K. Sekitani. 2005. Returns to scale in dynamic DEA. Eur. J. Oper. Res. 161 (2):536–544. doi:10.1016/j.ejor.2003.08.055.
- Thanassoulis, E., M. Portela, and O. Despic. 2008. DEA–the mathematical programming approach to efficiency analysis,” in the measurement of productive efficiency and productivity growth, 251–420. Oxford: Oxford University Press.
- Tone, K., and M. Tsutsui. 2010. Dynamic DEA: A slacks-based measure approach. Omega 38:145–156. doi:10.1016/j.omega.2009.07.003.
- Vaninsky, A. Y. 2008. Environmental efficiency of electric power industry of the United States: A data envelopment analysis approach. Proc. World Acad. Sci. Eng. Technol. 30:584–590.
- Vincent, J. R. 1997. Testing for environmental kuznets curves within a developing country. Environ. Dev. Econ. 2(04):1325–1348.
- Wang, K., Y.-M. Wei, and X. Zhang. 2013. Energy and emissions efficiency patterns of chinese regions: A multi-directional efficiency analysis. Appl. Energy 104:105–116. doi:10.1016/j.apenergy.2012.11.039.
- Wang, Q., S. Bin, J. Sun, P. Zhou, and D. Zhou. 2015. Measurement and decomposition of energy-saving and emissions reduction performance in Chinese cities. Appl. Energy 151:85–92. doi:10.1016/j.apenergy.2015.04.034.
- Wang, Q., Y.-H. Chiu, and C.-R. Chiu. 2017. Non-radial metafrontier approach to identify carbon emission performance and intensity. Renew. Sust. Energy Rev. 69:664–672. doi:10.1016/j.rser.2016.11.199.
- Wang, Z., C. Feng, and B. Zhang. 2014. An empirical analysis of China’s efficiency from both static and Dynamic perspective. Energy 74:322–330. doi:10.1016/j.energy.2014.06.082.
- Wesseh, P. K., and B. Lin. 2016a. Can African countries efficiently build their economies on renewable energy? Renew. Sust. Energy Rev. 54:161–173. doi:10.1016/j.rser.2015.09.082.
- Wesseh, P. K., and B. Lin. 2016b. Output and substitution elasticities of energy and implications for renewable energy expansion in the ECOWAS region. Energy Policy 89:125–137. doi:10.1016/j.enpol.2015.11.007.
- Wu, J., L. Lin, J. Sun, and X. Ji. 2015. A Comprehensive analysis of China’s regional energy saving and emission reduction efficiency: From production and treatment perspectives. Energy Policy 84:166–178. doi:10.1016/j.enpol.2015.05.005.
- Yeh, T.-L., T.-Y. Chen, and P.-Y. Lai. 2010. A comparative study of energy utilization efficiency between Taiwan and China. Energy Policy 38:2386–2394. doi:10.1016/j.enpol.2009.12.030.
- Zaim, O., and F. Taskin. 2000. Environmental efficiency in carbon dioxide emissions in the OECD: A non-parametric approach. J. Environ. Manage. 58 (2):95–107. doi:10.1006/jema.1999.0312.
- Zhang, X. P., X. M. Cheng, J. H. Yuan, and X. J. Gao. 2011. Total-factor energy efficiency in developing countries. Energy Policy 39:644–650. doi:10.1016/j.enpol.2010.10.037.
- Zhou, C., W. Chung, and Y. Zhang. 2014. Measuring energy efficiency performance of China’s transport sector: A data envelopment analysis approach. Expert Sys. app. 41 (2):709–722. doi:10.1016/j.eswa.2013.07.095.
- Zhou, P., B. W. Ang, and K. L. Poh. 2008. Measuring environmental performance under different environmental DEA technologies. Energy Econ. 30 (1):1–14. doi:10.1016/j.eneco.2006.05.001.
- Zhou, P., K. L. Poh, and B. W. Ang. 2007. A non-radial DEA approach to measuring environmental performance. Eur. J. Oper. Res. 178:1–9. doi:10.1016/j.ejor.2006.04.038.
- Zofio, J. L., and A. M. Prieto. 2001. Environmental efficiency and regulatory standards: The case of CO2 emissions from OECD industries. Res. Energy Econ. 23:63–83. doi:10.1016/S0928-7655(00)00030-0.