
ABSTRACT
Bushfires, prescribed burns, and residential wood burning are significant sources of fine particles (aerodynamic diameter <2.5 μm; PM2.5) affecting the health and well-being of many communities. Despite the lack of evidence, a common public health recommendation is to remain indoors, assuming that the home provides a protective barrier against ambient PM2.5. The study aimed to assess to what extent houses provide protection against peak concentrations of outdoor PM2.5 and whether remaining indoors is an effective way of reducing exposure to PM2.5. The effectiveness of this strategy was evaluated by conducting simultaneous week-long indoor and outdoor measurements of PM2.5 at 21 residences in regional areas of Victoria, Australia. During smoke plume events, remaining indoors protected residents from peak outdoor PM2.5 concentrations, but the level of protection was highly variable, ranging from 12% to 76%. Housing stock (e.g., age of the house) and ventilation (e.g., having windows/doors open or closed) played a significant role in the infiltration of outdoor PM2.5 indoors. The results also showed that leaving windows and doors closed once the smoke plume abates trapped PM2.5 indoors and increased indoor exposure to PM2.5. Furthermore, for approximately 50% of households, indoor sources such as cooking activities, smoking, and burning candles or incense contributed significantly to indoor PM2.5.
Implications: Smoke from biomass burning sources can significantly impact on communities. Remaining indoors with windows and doors closed is a common recommendation by health authorities to minimize exposures to peak concentrations of fine particles during smoke plume events. Findings from this study have shown that the protection from fine particles in biomass burning smoke is highly variable among houses, with information on housing age and ventilation status providing an approximate assessment on the protection of a house. Leaving windows closed once a smoke plume abates traps particles indoors and increases exposures.
Introduction
In their analyses of the trends in global fires from 1979 to 2013, Jolly et al. (Citation2015) showed that there has been an increase of 18.7% in the global fire weather season length for this time period. This means that fires are becoming more widespread and frequent in some regions (Flannigan et al. Citation2009; Turetsky et al. Citation2011; Westerling et al. Citation2006). Johnston et al. (Citation2012) identified that fire events are a significant source of air pollution and are likely to continue to grow in magnitude, resulting in increased health impacts.
Air pollution from bushfires and wood heaters has an impact on air quality and population health (Dennekamp and Abramson Citation2011; Johnston et al. Citation2011; Morgan et al. Citation2010). Currently, Australian homes are perceived to be a critical frontline of defense against episodic severe outdoor air pollution resulting from bushfires and prescribed burns. With the increased risk and frequency of such biomass fires occurring in Australia (Jolly et al. Citation2015), it is important to investigate the extent to which sheltering in homes is an effective method for protecting population health.
Studies conducted internationally have demonstrated that much of the outdoor particulate matter generated through biomass burning is able to infiltrate indoors, resulting in elevated indoor particulate matter concentrations (Barn et al. Citation2008; Chen et al. Citation2016; Henderson, Milford, and Miller Citation2005; Sharma and Balasubramanian Citation2017; Wheeler et al. Citation2014; Zhou et al. Citation2015). Factors that affect the influence of a smoke plume on indoor air include the air exchange rate (AER) (hr−1), the penetration factor (P) into the house (1 = 100% penetration), and the deposition rate (k) (hr−1). Air exchange occurs by infiltration through cracks, spaces, and fixed ventilators in the building shell, as well as by natural ventilation through opening of windows and doors. Natural ventilation is commonly used in single- and double-story residences in parts of Australia. Some houses may have some mechanical ventilation such as extraction fans in the kitchen, bathroom, and toilet. Ventilation is therefore generally controlled within a residence by adjusting the state of external openings to the house. Research into housing characteristics and AER in 73 Australian naturally ventilated homes demonstrated that home age was the most important factor driving AERs (Metropolitan Fire and Emergency Services Board Citation2011). Older houses can have higher AERs, approximately 0.4–0.5 hr−1, whereas in newer houses these can be as low as ~0.15 hr−1. Overall, the AERs for houses built within the last 5 yr were distinctly lower than those for houses constructed earlier. This is partially due to the removal of the requirement for fixed permanent ventilation (Australian Uniform Building Regulations Co-ordinating Council, Citation1991). It has also been demonstrated that opening doors and windows can result in initial AERs in excess of 3 hr−1 (Department of Environment and Heritage Citation2004; Dunne et al. Citation2006; He, Morawska, and Gilbert Citation2005).
The infiltration factor (Finf) is defined as the fraction of ambient particles that penetrate indoors and remain suspended under steady-state conditions (Wilson, Mage, and Grant Citation2000). Kearney et al. (Citation2014) reported that within- and between-home variability in infiltration exists due to weather conditions, housing characteristics, particle size, and particle composition, making it challenging to apply infiltration data from one country to another.
This study adds to the evidence on outdoor and indoor exposures during smoke plume events for typical Australian houses. It determines if exposure to fine particulate matter (aerodynamic diameter <2.5. μm; PM2.5) during biomass burning smoke events can be minimized by remaining indoors and changing the home’s AER through opening and closing doors and windows. This is the current guidance provided by Australian government agencies when such events occur (Victorian Government Citation2015).
Methods
Measurements
PM2.5 monitoring was conducted between 2013 and 2015 in the Yarra Valley and Gippsland, two regions in southeastern Victoria, Australia, that have a high likelihood of smoke impacts from prescribed burns or bushfires (Figure S1). The Yarra Valley is located approximately 70 km east of Melbourne. Due to the topography of the area, smoke tends to accumulate in the valley, dispersing slowly. The Gippsland area is located 206 km east of Melbourne close to the High Country of Victoria and is frequently impacted by smoke from either prescribed burns or bushfires in the surrounding forested areas. Ambient PM2.5 measurements were conducted at a central location in each region. Additionally, week-long indoor and outdoor air measurements were conducted at 21 residences in 2014 and 2015 to assess the influence of smoke plumes on indoor air quality (Table S1). Due to the unpredictability of prescribed burns, residences impacted by smoke from either private burn-offs or emissions from domestic wood heaters were also included to assess infiltration of outdoor PM2.5 indoors. Private burn-offs of grass, stubble, undergrowth, and other vegetation are commonly conducted on private properties outside the fire danger period.
Measurements of outdoor PM2.5 were made using a low-volume aerosol sampler, E-Sampler-9800 (Met One Instruments Inc., Grants Pass, Oregon, USA) fitted with a PM2.5 size-selective inlet. The sampler was operated at a height of ~2 m both to collect continuous PM2.5 measurements at 5-min intervals by light scattering and to collect particle mass on preweighed 47-mm Fluoropore membrane filters with a 1 μm pore size (Merck KGaA, Darmstadt, Germany). The gravimetric mass measurements were used to correct the E-Sampler’s response. Inside each residence, continuous PM2.5 concentrations were logged at 5-min intervals in a central location using a DustTrak (DustTrak II; TSI Inc., Shoreview, Minnesota, USA) fitted with a PM2.5 impactor plate. The instrument’s response was corrected against gravimetric PM2.5 concentrations collected on a 37-mm Fluoropore membrane filter over the 7-day period. Zero and flow checks for each instrument were done before and after deployment. The weekly filter samples were analyzed for gravimetric mass using an ultra-microbalance (model XP2U; Mettler Toledo, Port Melbourne, Victoria, Australia) with a specialty filter pan in a temperature (20–23 °C)- and relative humidity (RH) (<30%)-controlled environment. Only gravimetrically corrected values are reported here. Filters collected for gravimetric mass concentrations were also used for analysis of levoglucosan using a Dionex ICS-3000 high-performance anion-exchange chromatograph with an electrochemical detector operated in the integrating (pulsed) amperometric mode (HPAEC-PAD; Thermo Fisher Scientific, Waltham, MA, USA) as described in Reisen et al. (Citation2011) to confirm biomass burning sources. Outdoor meteorological data were obtained from a central weather station in the Yarra Valley and Gippsland.
A short questionnaire, administered to residents, provided information on housing characteristics, including age, building material, type of primary and secondary home heating, stove, and air conditioning system (if present), and number of rooms, windows, and external doors. In 2015, residents also completed a daily diary to identify potential indoor PM sources (e.g., cooking, cleaning, burning candles or incense, smoking, and wood heater operation) and outdoor PM sources (e.g., garden waste burns, barbecue, smoking, mowing) and time periods when doors and windows were opened.
Air exchange rates (AERs)
In this study, no AER measurements were completed for the 21 residences. This is a limitation of the current study, and for any future studies we recommend getting AERs for the corresponding measurement period. In the absence of AER in the current study, we used data from a previous study on indoor and outdoor pollutants in residences in Melbourne during winter and summer of 2003 (Galbally et al. Citation2011) that measured AERs in 15 residences using a carbon dioxide (CO2) release method described in Dunne et al. (Citation2006) (see supplementary materials), with a similar housing stock to the ones in this study. The study assessed relationships between AER(CO2), dwelling age, window openings, wind speed, and indoor-outdoor temperature differences (Galbally et al. Citation2010a, Citation2010b). In the absence of AER measurements, the established relationships that were developed in the Melbourne indoor air study were used to estimate AERs for the residences in this study (see supplementary materials). AERs were also estimated by measuring the decrease in indoor PM2.5 concentrations following an indoor PM peak event. A plot of the natural log of indoor PM2.5 concentrations versus time provides a straight line where the slope equals the total decay rate, a + k. The peaks were required to have a concentration of at least 50 μg m−3, decay over at least 90 min, and a regression with an R2 >0.9 (Kearney et al. Citation2011; Wallace et al. Citation2013). The AER was estimated by assuming deposition rates of 0.2 and 0.4 hr−1 for PM2.5 particles to fall within the range of reported values in the literature (0.17–0.56 hr−1). (Figure S2 and Table S2).
The infiltration factor (Finf) is defined as the fraction of outdoor PM2.5 that enters indoors and remains suspended (Allen et al. Citation2003; Long et al. Citation2001). In the absence of indoor sources, estimates of Finf during smoke plume events were calculated as the ratio of the hourly averaged indoor PM2.5 concentration divided by the hourly averaged outdoor PM2.5 concentration (MacNeill et al. Citation2014).
Results and discussion
During the measurement period, only one significant biomass burning event was observed each year. Due to limited prescribed burning events, we were only able to capture the effects of emissions on two residences in 2015. An additional five residences were impacted by smoke from either private burn-offs or emissions from domestic wood heaters. The housing characteristics of the relevant residences and biomass burning events are detailed in .
Table 1. Characteristics of the houses monitored when biomass burning (BB) events were captured.
Ambient PM2.5 concentrations and composition during biomass burning events
A number of exceedances of the 24-hr advisory for PM2.5 National Environment Protection Measures (NEPM) standard of 25 μg m−3 (National Environmental Protection Council Citation2003) were observed that were due to biomass burning events (Table S3). These included planned burns in the Yarra Valley in 2013 and 2015, extensive bushfires in east Gippsland and an open-cut coal mine fire close to Traralgon in 2014, and a private burn-off close to the monitoring site in Warburton in 2015. Hourly PM2.5 concentrations measured during periods of excessive haze in the Yarra Valley are shown in . Peak hourly PM2.5 concentrations during prescribed burns ( and ) were similar to those observed during bushfires (). The smoke plume events from prescribed burns in 2013 and 2015 were short-lived, with PM2.5 concentrations staying elevated for 9–13 hr. During the bushfire event in 2014, PM2.5 concentrations stayed elevated for 25–54 hr. Generally, impacts from prescribed burns are expected to be shorter in duration than large-scale bushfires (Table S4 and Haikerwal et al. (Citation2015)).
Figure 1. Hourly ambient PM2.5 concentrations during smoke plume events.
During the 2013 prescribed burn smoke event, PM2.5 concentrations were consistent across the Yarra Valley, with both monitoring stations displaying similar PM2.5 concentrations (). The smoke plume originated from a prescribed burn located approximately 40 km southwest of the monitoring site, resulting in uniform plume concentrations across the valley (Figure S3). This is consistent with what has been observed in other studies where monitoring sites were co-located in the same well-mixed airshed and valley (Ward, Hamilton, and Smith Citation2004). However, in 2015, we observed significant spatial variability in PM2.5 concentrations across the valley, with higher concentrations measured at Warburton than at Yarra Junction, located approximately 10 km southwest of Warburton (). This is likely due to the prescribed burn being located approximately 10–20 km to the east of the monitoring stations (Figure S3) and the smoke plume draining into the valley. The closer proximity of Warburton to the prescribed burn resulted in high concentrations, with a dilution of the smoke plume across the valley. This shows that the impact on downwind communities is strongly dependent on the distance to the burn area and the predominant wind directions.
When the PM2.5 filter composition was analyzed, there were high median levoglucosan levels observed in 2015, suggesting influences by local wood heater emissions (Table S3). During the winter, the levoglucosan fraction averaged 21% at Yarra Junction and 13% at Warburton. These levels are consistent with previous observations in the Huon Valley, Tasmania, where fractions averaged 12–24% (Reisen, Meyer, and Keywood Citation2013). Furthermore, a study on wood heater emissions found an average levoglucosan fraction of 25% from well-oxygenated combustion of eucalypt fuels in wood heaters (Meyer et al. Citation2008).
Indoor measurements at residences
Indoor PM2.5 measurements were made in 21 residences, and detailed results are shown in Table S5. Results were highly variable, with hourly and daily PM2.5 concentrations in the ranges of 0–774 and 0.03–80.9 μg m−3, respectively. shows that more than 90% of the 24-hr PM2.5 concentrations were below the 24-hr advisory PM2.5 NEPM standard of 25 μg m−3. The remaining elevated indoor PM2.5 concentrations were either due to indoor activities (e.g., cooking, frying, grilling, smoking, burning candle or incense) (shown in gray) or due to outdoor air pollution events (shown in blue). The contribution of any indoor sources to indoor PM2.5 was identified from the diaries. In addition, we observed elevated indoor PM2.5 concentrations but no concurrent outdoor PM2.5 concentrations. also shows that hourly peak PM2.5 concentrations can be very high and are mainly linked to indoor sources, consistent with peak values observed during cooking activities (He et al. Citation2004). The measured indoor PM2.5 concentrations are comparable to those of other studies where indoor sources of PM2.5 resulted in daily ranges of 0.54–74 and 0.54–140 μg m−3 (Kearney et al. Citation2014) and 0.93–50 and 0.04–100 μg m−3 (MacNeill et al. Citation2014) in winter and summer, respectively. A Canadian study investigating the impact of air cleaners on indoor air quality demonstrated that when the air cleaners were not operational, daily indoor PM2.5 data ranged from <0.1 to 74.9 μg m−3 (Barn et al. Citation2008). Calculated daily indoor concentrations in homes in Brisbane ranged between 7.9 and 17.5 μg m−3 during nonactivity periods and between 8.0 and 36.9 μg m−3 during activity periods (Morawska et al. Citation2003), whereas studies conducted in European cities measured indoor PM2.5 concentrations ranging between 2 and 140 μg m−3 (Hanninen et al. Citation2004).
Figure 2. Frequency distributions of the 24-hr indoor PM2.5 concentrations (left) and hourly indoor PM2.5 concentrations (right) measured at the 21 residences. Outdoor sources are shown in blue, and indoor sources are shown in gray.
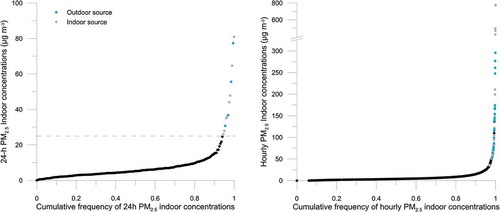
The median PM2.5 indoor/outdoor (I/O) ratio ranged between 0.13 and 2.93, with an outlier of 33.2 observed at a residence where participants were smoking. The frequency distribution showed that approximately 50% of the 24-hr PM2.5 I/O ratios were greater than 1, suggesting that about 50% of the households had significant indoor sources of PM2.5, resulting in higher PM2.5 exposure indoors than outdoors (Figure S4). This is comparable to results from a research study that included 121 measurements of 24-hr averaged PM2.5 within residences in Melbourne from August 2003 to February 2005 where I/O ratios ranged from 0.29 to 26.3 (Abramson Citation2008) (Figure S4). It also is comparable to results from Wheeler et al. (Citation2014) where I/O ratios had a median of 1.11 and a range of 0.17−117.8 on days when wood stoves were operational in homes.
The indoor PM2.5 measurements showed that there are important contributions from indoor sources on indoor PM2.5. Approximately 27% of indoor peaks exceeded an hourly PM2.5 concentration of 100 μg m−3, highlighting that indoor sources need to be considered when assessing population exposures.
Infiltration of outdoor PM2.5 indoors
The outdoor and indoor PM2.5 concentrations measured at seven residences during smoke plume events are summarized in . Plots of hourly outdoor and indoor PM2.5 concentrations are shown in for smoke plume events (e.g., residences 10, 11, 12, and 16) and Figures S5 and S6 for wood smoke events (e.g., residences 7, 8, and 21).
Table 2. Summary of outdoor and indoor PM2.5 measurements during smoke plume events.
Figure 3. Hourly outdoor and indoor PM2.5 concentrations and ventilation conditions during smoke plume events.
In a closed state, the increase in indoor PM2.5 concentrations was delayed (e.g., H16), whereas an immediate increase in indoor PM2.5 concentrations was observed for residences in an open state (e.g., H10 and H12).
Prescribed burns
The time-series plots of the 5-min averaged indoor and outdoor PM2.5 concentrations measured during a smoke plume event at two residences (H10 and H11) are shown in . The two residences are located in Warburton (Victoria), approximately 3 km apart from each other. Outdoor PM2.5 concentrations were comparable at the two residences, with measured maximum hourly PM2.5 concentrations of 336 and 387 μg m−3 and 24-hr averaged PM2.5 concentrations of 89.8 and 99.2 μg m−3, respectively. The plume event lasted approximately 9 hr and outdoor concentrations peaked at ~7 a.m.
Figure 4. Time-series plots of 5-min PM2.5 concentrations measured indoors and outdoors at residence H10 (top) and residence H11 (bottom) during a smoke plume event in 2015.
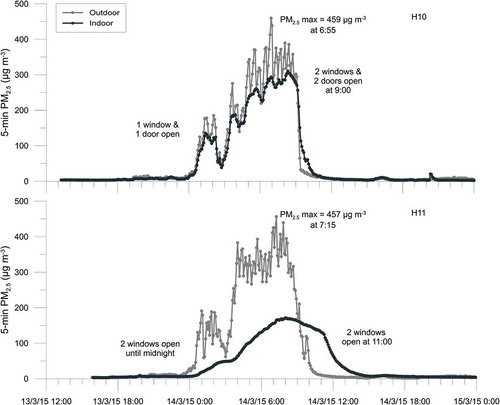
Indoor PM2.5 concentrations differed between the two residences. During the event, the PM2.5 24-hr averaged indoor concentration was 77.4 μg m−3 at residence H10 and 55.6 μg m−3 at residence H11. The difference in indoor PM2.5 concentrations during the smoke plume event was attributed to differences in ventilation and housing characteristics.
Residence H10 had one window and one door open during the smoke plume, which resulted in only a 12% reduction in the maximum hourly indoor PM2.5 concentration compared with the equivalent outdoor values. The I/O ratio remained at approximately 0.8 until more windows and doors were opened at 9 a.m. Opening two doors and two windows at 9 a.m. when the smoke plume had passed resulted in a rapid decrease in indoor PM2.5 concentrations. By remaining indoors, the total exposure to PM2.5 during the smoke plume event was reduced by 14% from 2100 to 1800 μg m−3 hr. The majority of the indoor exposure (95%) occurred during the increase in outdoor PM2.5 concentrations between 12 a.m. and 9 a.m.
A delayed response in the elevation of indoor PM2.5 concentrations was observed at residence H11. The residence had two windows open until midnight, after which the residence remained in a closed-up state. This resulted in a 57% reduction in indoor PM2.5 concentrations. At 8 a.m., there was a decrease in outdoor PM2.5 concentrations; however, indoor PM2.5 concentrations remained elevated as doors and windows remained closed; this shows that it takes time for indoor concentrations to decrease and reequilibrate with outdoor air without active ventilation. During the smoke plume, the I/O ratio was 0.3 until about 8 a.m. A decrease in outdoor concentrations was observed around 8 a.m., which resulted in an increase in the I/O ratio from 0.3 to a maximum of 15 at 11 a.m. Opening two windows at 11 a.m. resulted in a decrease in indoor PM2.5 concentrations and a decrease in the I/O ratio from 15 to 2.6 at 3 p.m. By remaining indoors, the total exposure to PM2.5 during the smoke plume event was reduced by 45%, from 2300 to 1300 μg m−3 hr. Although 63% of the indoor exposure occurred during the increase in outdoor PM2.5 concentrations between 12 a.m. and 9 a.m., 37% of the indoor exposure to PM2.5 occurred when ambient PM2.5 had abated. This shows that leaving windows and doors closed after the smoke plume event can trap fine particles indoors and increase indoor exposure to PM2.5.
Private burn-offs
Private burn-offs included garden waste burns or wood fire burns that residents conducted on their properties during times when fire bans were lifted. During the monitoring period, five residences noted in their activity diaries either garden waste burns on their own property or garden waste burns/wood fire burns on a neighbor’s property, of which two were used to evaluate indoor infiltration (). During the private burn-offs, maximum hourly PM2.5 concentrations of 56 μg m−3 were observed outdoors and the events lasted on average about 3 hr (). Maximum 5-min PM2.5 concentrations ranged from 137 to 190 μg m−3, whereas maximum indoor PM2.5 concentrations ranged from 35 to 114 μg m−3. A reduction of 39–49% in maximum hourly PM2.5 concentrations was observed indoors. The smallest reduction in indoor PM2.5 concentrations was observed at residence H12, which had four windows open during the event, allowing increased infiltration of outdoor particles indoors.
Wood heater emissions
Wood heaters are commonly used in regional areas of Victoria, and emissions from them have been shown to impact on outdoor PM2.5 concentrations (http://www.epa.nsw.gov.au/woodsmoke/; Hibberd et al. Citation2013; Meyer et al. Citation2011). Indoor and outdoor measurements conducted in late May 2014 at Maffra and in winter 2015 in the Yarra Valley highlighted elevated outdoor PM2.5 concentrations, most likely due to domestic woodheating. Levoglucosan levels made up 3–17% of the PM2.5 mass, consistent with filter samples impacted by wood smoke. Maximum 5-min outdoor PM2.5 concentrations ranged from 41 to 390 μg m−3, whereas maximum indoor PM2.5 concentrations ranged from 8 to 59 μg m−3. A reduction of 38–76% in maximum hourly PM2.5 concentrations was observed indoors ().
Infiltration factors
Infiltration factors (Finf) were calculated using indoor/outdoor ratios during the smoke plume event and are shown in . Finf varied from 0.17 to 0.83, indicating that for some houses a significant proportion of outdoor particles remained suspended indoors and the house provided little protection against outdoor PM2.5. It should be noted that windows were often open during smoke plume events, resulting in increased infiltration rates. The lowest Finf of 0.17 was measured at H7, whereas the highest Finf of 0.83 was measured at the oldest residence H10.
The impact on residential indoor air quality from the infiltration of ambient PM2.5 concentrations has been evaluated in a number of studies. These have predominantly been conducted in North America where building characteristics and building codes are very different from Australia. The majority of the studies included traffic emissions as the primary source of ambient PM2.5 (Allen et al. Citation2003; Hystad et al. Citation2009; Kearney et al. Citation2014; MacNeill et al. Citation2014, Citation2012). Infiltration rates ranged significantly in these different studies, with measured Finf in the range of 0.1–1.0 (Barn et al. Citation2008; Kearney et al. Citation2014; MacNeill et al. Citation2014, Citation2012), consistent with this study. The large variability was attributed to season, housing characteristics and dynamics, use of air conditioning, and filtration systems (Allen et al. Citation2003; Barn et al. Citation2008; Hanninen et al. Citation2011; Kearney et al. Citation2014; Long et al. Citation2001; MacNeill et al. Citation2014, Citation2012; Urban et al. Citation2012; Wheeler et al. Citation2014). Overall, infiltration was highest in summer due to window opening frequency, whereas houses in a closed state in winter resulted in the lowest infiltration rates.
Implications of AER, ventilation status, and smoke plume characteristics on indoor PM2.5
Due to the unpredictability of prescribed burns and the short duration of such events, capturing measurements of indoor and outdoor PM2.5 during smoke events are challenging. The limited data set collected in this study showed that remaining indoors protects residents from peak outdoor PM2.5 concentrations with highly variable degrees of protection. Reductions ranged between 12% and 76%. We identified some potential factors likely to result in reduced infiltration of outdoor PM2.5. These include ventilation (e.g., having windows/doors open or closed) and age of building. The study also showed that it is critical to ventilate the house when the smoke plume abates to minimize trapping PM2.5 indoors.
The data were used to further assess whether the age and ventilation status of a house (data that can be easily obtained via a questionnaire and diary) are sufficient to provide an estimate of the infiltration of outdoor PM2.5 indoors and whether a simplified infiltration model can provide an indication of the level of protection that sheltering indoors may provide during a smoke plume event. The infiltration model was based on a mass-balance equation that took into account age and ventilation of a residence, if available, and assuming 80% and 100% penetration efficiencies of PM2.5 particles through the building shell (see supplementary materials). This is based on the fact that particles in the accumulation mode penetrate buildings most effectively (Allen et al. Citation2003; Chen and Zhao Citation2011; Diapouli, Chaloulakou, and Koutrakis Citation2013; Kopperud, Ferro, and Hildemann Citation2004; Long et al. Citation2001; Nazaroff Citation2004; Thatcher et al. Citation2002; Thatcher and Layton Citation1995). In addition, it is generally assumed that a dwelling operates as a single compartment where complete mixing occurs. AER(CO2) was varied as a function of the ventilation status of the house and wind speed based on relationships established for 15 residences in Melbourne (Galbally et al. Citation2010a, Citation2010b). As a previous study conducted on houses in southeastern Australia did not find a relationship between AER(CO2) and indoor-outdoor temperature difference, this factor was not taken into account in this study when estimating AER(CO2) (see supplementary materials for further details). We attributed the observed lack of relationship between AER and indoor-outdoor temperature difference on the different housing stock found in southeastern Australia, which may result in smaller temperature differences and a larger wind effect. The deposition rate k was assumed to remain constant across the measurement period.
shows the measured and modeled PM2.5 concentrations during the prescribed burn event in March 2015, with additional events shown in Figure S7.
Figure 5. Measured and modeled PM2.5 concentrations during smoke plume events.
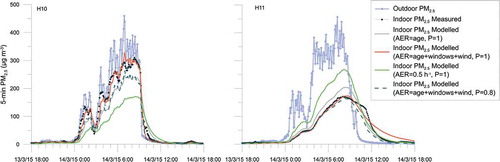
For smoke plume events (due to prescribed burning or private burn-offs, e.g., H10, H11, H12, H16), the model performed reasonably well when the ventilation status was taken into account (Table S6). Differences in measured and modeled indoor PM2.5 concentrations are attributed to uncertainties in the AER(CO2)s and deposition rates as well as local effects of turbulent mixing of air and wind speed/direction in relation to window openings.
For residences impacted by outdoor domestic wood smoke (e.g., H7, H8, H21), indoor PM2.5 concentrations are potentially more challenging to model due to possible contributions from both outdoor wood smoke and smoke escaping from the wood stove use indoors.
Results from the infiltration model showed that for residence H10, closing windows and doors during the smoke plume event decreased hourly indoor PM2.5 concentrations by 29% compared with the measured 12% reduction when windows were open. It was one of the oldest houses, which have previously been demonstrated to have the highest AER(CO2), and even in a closed-up state it provides a small reduction in indoor PM2.5 concentrations. This suggests that for Australian homes, older homes are leaky and may provide the least protection during smoke plume events. For residence H12, the model showed that closing windows resulted in a 68% reduction in hourly PM2.5 concentrations compared with the measured 38.5% when windows were open. Overall, remaining indoors with doors and windows closed provided reduced exposure to peak PM2.5 concentrations ranging from 29% to 76%, with a median of 66.5%. The modeled results confirm that a tighter house, in terms of reduced ventilation, provides greater protection against particle infiltration, with a significant difference between a tight house (AER(CO2) of 0.15 hr−1) and a leaky house (AER(CO2) of 0.8 hr−1). The infiltration factor drops from 0.72 for a leaky house to 0.35 for a tight house.
Opening windows when the outdoor smoke abates can further reduce indoor exposures to PM2.5, but this is dependent upon the smoke plume characteristics. For a rapid drop in outdoor PM2.5 concentrations, e.g., due to change in wind direction, opening windows can significantly reduce indoor PM2.5 concentrations (see Figure S8). This can be assessed by the householder based on outdoor visibility.
The model performance confirmed that information on housing characteristics and the ventilation status of the house during a smoke plume event can provide an approximate assessment of how well protected a house will be during a biomass burning event.
Acknowledgment
The authors would like to thank the study participants for their assistance in this research study.
Additional information
Funding
Notes on contributors
Fabienne Reisen
Fabienne Reisen is a principal research scientist.
Jennifer C. Powell
Jennifer Powell is a senior experimental scientist at CSIRO Oceans and Atmosphere.
Martine Dennekamp
Martine Dennekamp is a senior Environmental Epidemiologist at EPA Victoria and an adjunct Senior Research Fellow with the School of Public Health and Preventive Medicine at Monash University.
Fay H. Johnston
Fay H. Johnston is a public health physician and an environmental epidemiologist at the Menzies Institute for Medical Research, University of Tasmania.
Amanda J. Wheeler
Amanda Wheeler is a Senior Research Fellow at the Australian Catholic University and an adjunct Research Fellow with the Menzies Institute for Medical Research at the University of Tasmania.
References
- Abramson, M., 2008. Personal communication, Monash university, Department of epidemiology and preventative medicine, Melbourne, Victoria Australia. NHMRC project grant 236934. The relationship between airborne particle exposure, incident respiratory symptoms and decline in lung function.
- Allen, R., T. Larson, L. Sheppard, L. Wallace, and L. J. S. Liu. 2003. Use of real-time light scattering data to estimate the contribution of infiltrated and indoor-generated particles to indoor air. Environ. Sci. Technol. 37 (16):3484–92. doi:10.1021/es021007e.
- Australian Uniform Building Regulations Co-ordinating Council. 1991. Building code of Australia 1990. Canberra: Butterworths.
- Barn, P., T. Larson, M. Noullett, S. Kennedy, R. Copes, and M. Brauer. 2008. Infiltration of forest fire and residential wood smoke: An evaluation of air cleaner effectiveness. J. Exposure Sci. Environ. Epidemiol. 18 (5):503–11. doi:10.1038/sj.jes.7500640.
- Chen, A. L., Q. L. Cao, J. Zhou, B. Yang, V. W. C. Chang, and W. W. Nazaroff. 2016. Indoor and outdoor particles in an air-conditioned building during and after the 2013 haze in Singapore. Build Environ. 99:73–81. doi:10.1016/j.buildenv.2016.01.002.
- Chen, C., and B. Zhao. 2011. Review of relationship between indoor and outdoor particles: I/O ratio, infiltration factor and penetration factor. Atmos. Environ. 45 (2):275–88. doi:10.1016/j.atmosenv.2010.09.048.
- Dennekamp, M., and M. J. Abramson. 2011. The effects of bushfire smoke on respiratory health. Respirology 16 (2):198–209. doi:10.1111/j.1440-1843.2010.01868.x.
- Department of Environment and Heritage. 2004. Unflued gas appliances and air quality in Australian homes. Technical Report No. 9. Commonwealth of Australia, Department of Environment and Heritage, Australia.
- Diapouli, E., A. Chaloulakou, and P. Koutrakis. 2013. Estimating the concentration of indoor particles of outdoor origin: A review. J. Air Waste Manag. Assoc. 63 (10):1113–29. doi:10.1080/10962247.2013.791649.
- Dunne, E., W. Kirstine, I. E. Galbally, J. Powell, P. Selleck, and S. Lawson. 2006. A study of gaseous indoor air quality for a Melbourne home. Clean Air Environ. Qual. 40 (3):45–51.
- Flannigan, M. D., M. A. Krawchuk, W. J. de Groot, B. M. Wotton, and L. M. Gowman. 2009. Implications of changing climate for global wildland fire. Int. J. Wildland Fire 18 (5):483–507. doi:10.1071/WF08187.
- Galbally, I., M. Cheng, R. Gillett, M. Keywood, S. Lawson, S. Molloy, and J. Powell. 2010a. Indoor Air project. Part 1: Main report - Indoor Air in typical Australian dwellings CSIRO: Aspendale, Victoria. http://www.environment.gov.au/protection/publications/indoor-air-project.
- Galbally, I., M. Cheng, R. Gillett, M. Keywood, S. Lawson, S. Molloy, and J. Powell. 2010b. The indoor Air project. Part 2: Appendices, CSIRO, Aspendale, Victoria. http://www.environment.gov.au/protection/publications/indoor-air-project.
- Galbally, I., M. D. Keywood, J. C. Powell, S. L. Lawson, M. Cheng, E. Dunne, R. Gillett, S. Molloy, P. Selleck, J. Ward, et al. 2011. An overview of the CSIRO 2008-2009 indoor air quality study. Air Qual. Clim. Change 45 (1):27–35.
- Haikerwal, A., F. Reisen, M. R. Sim, M. J. Abramson, C. P. Meyer, F. H. Johnston, and M. Dennekamp. 2015. Impact of smoke from prescribed burning: Is it a public health concern? J. Air Waste Manag. Assoc. 65 (5):592–98. doi:10.1080/10962247.2015.1032445.
- Hanninen, O., G. Hoek, S. Mallone, E. Chellini, K. Katsouyanni, C. Gariazzo, G. Cattani, A. Marconi, P. Molnar, T. Bellander, et al. 2011. Seasonal patterns of outdoor PM infiltration into indoor environments: Review and meta-analysis of available studies from different climatological zones in Europe. Air Qual. Atmos. Health 4 (3–4):221–33. doi:10.1007/s11869-010-0076-5.
- Hanninen, O. O., E. Lebret, V. Ilacqua, K. Katsouyanni, F. Kunzli, R. J. Sram, and M. Jantunen. 2004. Infiltration of ambient PM(2.5) and levels of indoor generated non-ETS PM(2.5) in residences of four European cities. Atmos. Environ. 38 (37):6411–23. doi:10.1016/j.atmosenv.2004.07.015.
- He, C. R., L. Morawska, and D. Gilbert. 2005. Particle deposition rates in residential houses. Atmos. Environ. 39 (21):3891–99. doi:10.1016/j.atmosenv.2005.03.016.
- He, C. R., L. D. Morawska, J. Hitchins, and D. Gilbert. 2004. Contribution from indoor sources to particle number and mass concentrations in residential houses. Atmos. Environ. 38 (21):3405–15. doi:10.1016/j.atmosenv.2004.03.027.
- Henderson, D. E., J. B. Milford, and S. L. Miller. 2005. Prescribed burns and wildfires in Colorado: Impacts of mitigation measures on indoor air particulate matter. J. Air Waste Manag. Assoc. 55 (10):1516–26. doi:10.1080/10473289.2005.10464746.
- Hibberd, M., P. Selleck, M. D. Keywood, D. Cohen, E. Stelcer, and A. Atanacio. 2013. Upper Hunter valley particle characterization study. In Final Report to NSW office of Environment and Heritage and NSW department of health. CSIRO, Aspendale, Victoria.
- Hystad, P. U., E. M. Setton, R. W. Allen, P. C. Keller, and M. Brauer. 2009. Modeling residential fine particulate matter infiltration for exposure assessment. J. Exposure Sci. Environ. Epidemiol. 19 (6):570–79. doi:10.1038/jes.2008.45.
- Johnston, F., I. Hanigan, S. Henderson, G. Morgan, and D. Bowman. 2011. Extreme air pollution events from bushfires and dust storms and their association with mortality in Sydney, Australia 1994–2007. Environ. Res. 111 (6):811–16. doi:10.1016/j.envres.2011.05.007.
- Johnston, F. H., S. B. Henderson, Y. Chen, J. T. Randerson, M. Marlier, R. S. DeFries, P. Kinney, D. Bowman, and M. Brauer. 2012. Estimated global mortality attributable to smoke from landscape fires. Environ. Health Perspect. 120 (5):695–701. doi:10.1289/ehp.1104422.
- Jolly, W. M., M. A. Cochrane, P. H. Freeborn, Z. A. Holden, T. J. Brown, G. J. Williamson, and D. Bowman. 2015. Climate-induced variations in global wildfire danger from 1979 to 2013. Nat. Commun. 6:7537. doi:10.1038/ncomms8537.
- Kearney, J., L. Wallace, M. MacNeill, M. E. Heroux, W. Kindzierski, and A. Wheeler. 2014. Residential infiltration of fine and ultrafine particles in Edmonton. Atmos. Environ. 94:793–805. doi:10.1016/j.atmosenv.2014.05.020.
- Kearney, J., L. Wallace, M. MacNeill, X. Xu, K. VanRyswyk, H. You, R. Kulka, and A. J. Wheeler. 2011. Residential indoor and outdoor ultrafine particles in Windsor, Ontario. Atmos. Environ. 45 (40):7583–93. doi:10.1016/j.atmosenv.2010.11.002.
- Kopperud, R. J., A. R. Ferro, and L. M. Hildemann. 2004. Outdoor versus indoor contributions to indoor particulate matter (PM) determined by mass balance methods. J. Air Waste Manag. Assoc. 54 (9):1188–96. doi:10.1080/10473289.2004.10470983.
- Long, C. M., H. H. Suh, P. J. Catalano, and P. Koutrakis. 2001. Using time- and size-resolved particulate data to quantify indoor penetration and deposition behavior (vol 35, pg 2089, 2001). Environ. Sci. Technol. 35 (22):4584–4584. doi:10.1021/es011283d.
- MacNeill, M., J. Kearney, L. Wallace, M. Gibson, M. E. Heroux, J. Kuchta, J. R. Guernsey, and A. J. Wheeler. 2014. Quantifying the contribution of ambient and indoor-generated fine particles to indoor air in residential environments. Indoor Air 24 (4):362–75. doi:10.1111/ina.12084.
- MacNeill, M., L. Wallace, J. Kearney, R. W. Allen, K. Van Ryswyk, S. Judek, X. Xu, and A. Wheeler. 2012. Factors influencing variability in the infiltration of PM2.5 mass and its components. Atmos. Environ. 61:518–32. doi:10.1016/j.atmosenv.2012.07.005.
- Metropolitan Fire and Emergency Services Board. 2011. A best practice approach to shelter-in-place for Victoria. East Melbourne, VIC: Victorian Emergency Management Grants Program (issuing body).
- Meyer, C. P., A. K. Luhar, R. W. Gillett, and M. D. Keywood. 2008. Measurement of real-world PM10 emission factors and emission profiles from wood-heaters by in situ source monitoring and atmospheric verification methods. Final Report of Clean Air Research Project 16 for the Australian Government Department of the Environment, Water, Heritage and the Arts, CSIRO, Aspendale, Victoria.
- Meyer, C. P., F. Reisen, M. D. Keywood, and S. Crumeyrolle. 2011. Impacts of smoke from regeneration burning on air quality in the Huon Valley, Tasmania. Aspendale, Victoria: CSIRO.
- Morawska, L., C. R. He, J. Hitchins, K. Mengersen, and D. Gilbert. 2003. Characteristics of particle number and mass concentrations in residential houses in Brisbane, Australia. Atmos. Environ. 37 (30):4195–203. doi:10.1016/S1352-2310(03)00566-1.
- Morgan, G., V. Sheppeard, B. Khalaj, A. Ayyar, D. Lincoln, B. Jalaludin, J. Beard, S. Corbett, and T. Lumley. 2010. Effects of bushfire smoke on Daily Mortality and hospital admissions in Sydney, Australia. Epidemiology 21 (1):47–55. doi:10.1097/EDE.0b013e3181c15d5a.
- National Environmental Protection Council. 2003. National Environment Protection (Ambient Air Quality) Measure (Amendment). EPHC, Canberra.
- Nazaroff, W. W. 2004. Indoor particle dynamics. Indoor Air 14:175–83. doi:10.1111/j.1600-0668.2004.00286.x.
- Reisen, F., C. P. Meyer, L. McCaw, J. C. Powell, K. Tolhurst, M. D. Keywood, and J. L. Gras. 2011. Impact of smoke from biomass burning on air quality in rural communities in southern Australia. Atmos. Environ. 45 (24):3944–53. doi:10.1016/j.atmosenv.2011.04.060.
- Reisen,F., C.P. Meyer, and M. D. Keywood. 2013. Impact of biomass burning sources on seasonal aerosol air quality. Atmos. Environ. 67:437– 47. doi:10.1016/j.atmosenv.2012.11.004.
- Sharma, R., and R. Balasubramanian. 2017. Indoor human exposure to size-fractionated aerosols during the 2015 Southeast Asian smoke haze and assessment of exposure mitigation strategies. . Environ. Res. Lett. 12 (11):114026. doi:10.1088/1748-9326/aa86dd.
- Thatcher, T. L., A. C. K. Lai, R. Moreno-Jackson, R. G. Sextro, and W. W. Nazaroff. 2002. Effects of room furnishings and air speed on particle deposition rates indoors. Atmos. Environ. 36 (11):1811–19. doi:10.1016/S1352-2310(02)00157-7.
- Thatcher, T. L., and D. W. Layton. 1995. Deposition, resuspension, and penetration of particles within a residence. Atmos. Environ. 29 (13):1487–97. doi:10.1016/1352-2310(95)00016-R.
- Turetsky, M. R., E. S. Kane, J. W. Harden, R. D. Ottmar, K. L. Manies, E. Hoy, and E. S. Kasischke. 2011. Recent acceleration of biomass burning and carbon losses in Alaskan forests and peatlands. Nat. Geosci. 4 (1):27–31. doi:10.1038/ngeo1027.
- Urban, R. C., M. Lima-Souza, L. Caetano-Silva, M. E. C. Queiroz, R. F. P. Nogueira, A. G. Allen, A. A. Cardoso, G. Held, and M. L. A. M. Campos. 2012. Use of levoglucosan, potassium, and water-soluble organic carbon to characterize the origins of biomass-burning aerosols. Atmos. Environ. 61:562–69. doi:10.1016/j.atmosenv.2012.07.082.
- Victorian Government. 2015. Community smoke, air quality and health standard. Air quality assessment, forecasting and health protection messaging for particulate matter. Melbourne, Australia: Victorian Government.
- Wallace, L., W. Kindzierski, J. Kearney, M. MacNeill, M. E. Heroux, and A. J. Wheeler. 2013. Fine and ultrafine particle decay rates in multiple homes. Environ. Sci. Technol. 47 (22):12929–37. doi:10.1021/es402580t.
- Ward, T. J., R. F. Hamilton, and G. C. Smith. 2004. The Missoula, Montana PM2.5 speciation study - seasonal average concentrations. Atmos. Environ. 38 (37):6371–79. doi:10.1016/j.atmosenv.2004.07.012.
- Westerling, A. L., H. G. Hidalgo, D. R. Cayan, and T. W. Swetnam. 2006. Warming and earlier spring increase western US forest wildfire activity. Science 313 (5789):940–43. doi:10.1126/science.1128834.
- Wheeler, A. J., M. D. Gibson, M. MacNeill, T. J. Ward, L. A. Wallace, J. Kuchta, M. Seaboyer, E. Dabek-Zlotorzynska, J. R. Guernsey, and D. M. Stieb. 2014. Impacts of air cleaners on indoor air quality in residences impacted by wood smoke. Environ. Sci. Technol. 48 (20):12157–63. doi:10.1021/es503144h.
- Wilson, W. E., D. T. Mage, and L. D. Grant. 2000. Estimating separately personal exposure to ambient and nonambient particulate matter for epidemiology and risk assessment: Why and how. J. Air Waste Manag. Assoc. 50 (7):1167–83. doi:10.1080/10473289.2000.10464164.
- Zhou, J., A. L. Chen, Q. L. Cao, B. Yang, V. W. C. Chang, and W. W. Nazaroff. 2015. Particle exposure during the 2013 haze in Singapore: Importance of the built environment. Build Environ. 93:14–23. doi:10.1016/j.buildenv.2015.04.029.