
ABSTRACT
The portable high-efficiency air filtration (PHEAF) device is an engineering control common to the environmental remediation industry. Damage to the high-efficiency particulate air (HEPA) filter (e.g., filtration media, gasket), improper installation of the filter into the mounting frame, or defects in the filtration housing affect the capture efficiency of the device. PHEAF devices operating at less than marketed efficiencies justify periodic leak testing of the PHEAF device, especially when the filtered air is exhausted into occupied spaces. A leak test is accomplished by injecting a known concentration of aerosol upstream of the HEPA filter and measuring the percentage of aerosol penetrating through the filtration system. The test protocol scripted for stationary systems (i.e., biological safety cabinets) states that upstream concentrations can be empirically determined using the aerosol photometer to measure particulate matter (PM) in the airstream. This practice requires a homogenous mixture of the aerosol challenge agent within the airstream. However, design of the PHEAF device does not include a validated induction point for the aerosol. Absent of an acceptable means to achieve a homogenous mixture for upstream measurement, the aerosol concentration is mathematically derived based on the measured air volume passing through the PHEAF equipment. In this study, intake volume and exhaust volume for each PHEAF device were measured by either the balometer or the hot wire anemometer. Variability of measurements was examined by instrument and sample location (intake vs. exhaust) to understand which combination would be most consistent for measuring airflow volume. From this study, the authors conclude that the balometer is preferred compared with the hot wire anemometer for measuring airflow through the PHEAF device. Exhaust measurement by balometer seems more reliable than intake measurements by hot wire anemometer.
Implications: Although testing of PHEAF devices is recommended by various public health authorities, no nationally recognized test protocol has been published in the United States. In support of measuring the performance of the PHEAF device in a field setting, this study evaluated the hot wire anemometer and balometer techniques and sample locations (intake vs. exhaust) to reliably measure airflow through the PHEAF device. Since accuracy of the particle measurement is associated with airflow volume, it is essential to obtain a true airflow reading. This study suggests that the balometer was more consistent in measuring airflow through the PHEAF device.
Introduction
The notoriety of “sick building syndrome” and the legacy of toxic building products, such as asbestos and lead-based paint, have established an interest among public health practitioners to reduce occupant exposure to particulate matter (PM) during construction activities. When renovation activities occur indoors, housekeeping is a practical method for reducing settled dust, whereas filtration systems are effective for removing airborne PM. The portable high-efficiency air filtration (PHEAF) device is an engineering control essential to the environmental remediation industry. Such devices are used during asbestos abatement, mold remediation, and other construction-related activities. The PHEAF device is similar to stationary filtration systems equipped with high-efficiency particulate air (HEPA) filters used in the nuclear, biomedical, and pharmaceutical industries in that its function is to control PM within the work environment. PHEAF devices are typically deployed within temporary containment barriers constructed around the work zone, thereby isolating the dust generating tasks from surrounding areas. When incorporated into the construction project, PHEAF devices benefit both the contractor’s employees and building occupants. To minimize contamination from construction activities, filtered air from the PHEAF device is exhausted outside of the containment system to establish an air pressure differential. Maintaining a negative pressure differential between the containment zone and adjacent areas limits infiltration of PM into otherwise clean areas. Exhaust air should be vented outside of the building; however, building configurations (e.g., sealed windows) may require discharge of the filtered air within the building envelope.
Figure 1. Diagram of PHEAF device showing major components.
Damage to the HEPA filter, improper installation of the filter into the mounting frame, or defects in the filter housing affect the filtration device’s capture efficiency (Department of Energy Citation2003). For these reasons, stationary systems (e.g., biological safety cabinets) are frequently tested to verify the integrity of the filtration system; however, such practice is not common for PHEAF devices (Brandys and Brandys Citation2011). British Columbia is an example jurisdiction where periodic testing of each PHEAF device is required by law (Workers’ Compensation Board of British Columbia Citation2017), although we are not aware of federal regulation within the United States defining a method, requirement, or frequency for testing the effectiveness of the PHEAF device. Deficiencies affecting filtration performance may go unnoticed without testing the PHEAF device. A previous field study of metal cabinet PHEAF devices showed that approximately 92% of performance tests failed to capture at least 99.97% of the aerosol challenge agent (Newcomer et al. Citation2018). Capture efficiencies less than an advertised value (e.g., 99.97% at 0.3 µm for HEPA filters) support the need for periodic testing of the PHEAF device, especially when the filtered air is exhausted into occupied spaces.
The NSF International Standard/American National Standards Institute 49: Biosafety Cabinetry: Design, Construction, Performance, and Field Certification protocol is referenced for testing biological safety cabinets (NSF International Standard/American National Standards Institute Citation2014). Testing is performed by injecting a homogenous concentration of aerosol upstream of the HEPA filter and measuring the percentage of aerosol penetrating through the filtration system. The baseline is determined by calibrating the photometer to the upstream aerosol challenge concentration. A homogenous upstream mixture is obtained by introducing the aerosol at the location identified by the manufacturer of the HEPA system (Institute of Environmental Sciences and Technology Citation2016).
Since performance testing of the PHEAF device is not standard practice in the United States, manufacturers have not identified a validated aerosol induction location. A mixing chamber could be used in lieu of an induction point; however, the field setting may not be a practical environment to construct a mixing chamber for testing each PHEAF device. Furthermore, the mixing chamber technique is not sensitive to pinpointing leaks through the filtration system. In lieu of calibrating the photometer’s baseline setting empirically, the aerosol concentration can be mathematically derived. Calibrating the aerosol photometer is performed by setting the internal reference value to a known aerosol concentration. The test administrator calculates the aerosol challenge concentration based on airflow conveyed by the PHEAF device. This approach to setting the aerosol photometer means accurate and reliable airflow measurements are critical to the success of the performance test. For example, if the measured air volume conveyed through the PHEAF device is less than the actual airflow, then the real aerosol concentration would be higher than anticipated by the photometer, meaning that the efficiency of the PHEAF device would be overestimated.
Absent of a consensus standard or nationally recognized practice for field testing PHEAF equipment, the test administrator would need to determine an appropriate methodology to quantify airflow. Conceivably, the test administrator would employ a strategy analogous to the biological safety cabinet filter leak test protocol. However, manufacturers of PHEAF devices typically do not provide instruction or reference standardized procedures to conduct such testing. In this context, the test location and instrument technique for measuring airflow would not have been validated for measurement error by the equipment manufacturer. Consequently, the means to reliably calculate the aerosol challenge value to calibrate the photometer setting is undefined for the PHEAF device. Applying the protocol authored for biological safety cabinets, airflow measurements through the PHEAF device can be taken by balometer (i.e., primary method) or hot wire anemometer (i.e., alternative method) (NSF International Standard/American National Standards Institute Citation2014). Although both methods are referenced in the HEPA leak test standard for biological safety cabinets, the primary method is preferred for its accuracy and consistency (NSF International Citation2015).
This study evaluates the reliability of the balometer and hot wire anemometer in measuring airflow through the PHEAF device in a field environment. We explored measurement techniques that conceivable would be employed by field technicians when standardized methods to monitor airflow are difficult to apply without modifying the PHEAF device. In this study, intake volume and exhaust volume for each PHEAF device were measured by the same instrument and compared as a measure of reliability.
Methods
This study was conducted from May 2012 through February 2015 during construction activities within a multistory building. Contractor-owned PHEAF devices were utilized to control PM within the building envelope during construction work. The study included 79 PHEAF devices from four known manufacturer models. PHEAF devices were grouped by manufacturer model and denoted as D, E, F, and H. Although the sample population included different manufacturer makes and models, model E was the most prevalent model type in the sample population.
Airflow through the PHEAF device was measured by balometer (Alnor EBT731; TSI Incorporated, Shoreview, USA, Minnesota) or hot wire anemometer (TSI VelociCalc 9545-A). The balometer is designed to measure airflow volume ranging from 25 to 2500 cubic feet per minute (cfm) (±3% of reading). The TSI VelociCalc measures air velocity from 0 to 6000 feet per minute with an accuracy of ±3%. Instruments were factory calibrated as part of the research protocol. Prior to conducting airflow measurements, the pre-filter was removed from the PHEAF device to inspect the condition of the HEPA filter and measure the size of the air intake opening. The pre-filters were replaced prior to measuring airflow.
As shown in , the intake side of the HEPA filter is protected by a door hinged onto the PHEAF’s sidewall panel. The door has equally spaced cutouts that form a grid superimposed over the PHEAF device’s intake area. Using the door cutouts for reference, the intake area was dividing into nine sectors of equal area.
Using a hot wire anemometer, the PHEAF device’s face velocity was measured by placing the probe approximately 1 inch away from the surface of the hinged door at the center of each sector, for a total of nine measurements. Air through the PHEAF device is exhausted through a 2–3-inch collar protracting from the cabinet, which is preceded by a rectangular cutout. Exhaust velocity was measured by placing the probe tip along the centerline of the exhaust plenum to approximate the average airflow. For each measurement, the hot wire anemometer probe was held until a steady reading was measured. Velocity values were transformed to volumetric airflow by multiplying the (average) velocity measurement(s) by the cross-sectional area of the intake or exhaust location.
Using the balometer, the PHEAF device’s airflow volume was measured by placing the fabric hood over the face of the intake grille or exhaust port with sufficient pressure to adequately seal the hood against the PHEAF cabinet. The fabric hood was adequate in size to surround the intake and exhaust openings, thereby capturing airflow at the sample location.
The variability of the measurements was investigated by instrument and location. Since the same instrument is used to measure intake and exhaust measurements, we would expect the reading for each location to be similar across tests for each manufacturer model. Repeatability of the test method and instrumentation was evaluated by analyzing the variability of measurements for each location across tests. A repeated-measures analysis was employed, where measurements were nested within test units, to evaluate and compare the within-unit variability, which are indicative of the repeatability or internal consistency of the instrument.
Results
The study resulted in 315 paired measurements taken at the intake and exhaust locations of each PHEAF device. Many PHEAF units were measured multiple times across different test rounds. The intervals between test rounds and the number of units tested in each round varied depending on ongoing construction activities. Over the course of the study, the construction contractor intentionally adjusted the number of PHEAF devices in service due to equipment disrepair or project need. Measurements by hot wire anemometer and balometer were taken at different periods of the study.
A total of 139 tests were made by hot wire anemometer technique during test rounds 1 through 3. Only PHEAF devices from manufacturer models E, F, and H were available for testing during this study period. Subsequently, 176 volumetric measurements were taken by the balometer technique in rounds 4 to 9. shows the mean airflow volumes measured by each technique at intake and exhaust locations grouped by manufacturer model.
Table 1. Summary of volumetric airflow for PHEAF manufacturer models measured by hot wire anemometer or balometer.
We find that the average airflow volume was predominantly measured to be less than the manufacturer’s stated capacity. For example, a PHEAF model having a marketed airflow of 1975 cfm had a measured average airflow (i.e., (intake + exhaust)/2) of 1127 cfm by hot wire anemometer and 1250 cfm by balometer, which were respectively 43% and 37% lower than the advertised capacity. Generally, both techniques recorded airflow capacities substantially lower than the rated capacity, with the balometer having higher readings than the hot wire anemometer on average. Further examination of the data collected from PHEAF devices in model E showed that the hot wire anemometer measured lower air velocities on average but showed high variability compared with the balometer ().
Figure 2. Distribution of hot wire anemometer and balometer readings in this study, grouped by location, for PHEAF model E. The vertical line denotes the manufacturer’s advertised capacity of 1975 cfm.
Although the median measurements from the hot wire anemometer were lower than the manufacturer’s rated capacity of 1975 cfm, 3 intake measurements and 20 exhaust measurements exceeded 2100 cfm, the highest claimed capacity of any manufacturer model. We also note here that intake measurements are generally lower than exhaust measurements on average. For the remainder of this section, we limit our analyses to data from manufacturer model E, since this make and model covers 89% (281 out of 315) of the tests conducted during this study and data from other manufacturer models were sparse (). This strategy also simplified the analysis, since each manufacturer’s device had different airflow ratings.
We acknowledge that accuracy of our measurements was not directly assessed, since we did not use any primary standard method (e.g., pitot tube) to measure airflow through each unit during each test. Instead, factory calibration of the instrument was relied upon, since most practitioners in the field use this method for calibration traceability. We did assess consistency of measurements by location and technique through the estimated variability of the measurements. We can see () that the exhaust hot wire anemometer readings are substantially more variable than the other three readings. These standard deviation (SD) estimates do not take into account the fact that repeated measurements have been taken on the same machines over different test rounds. We account for the repeated measures by fitting random intercept models with volumetric readings nested within PHEAF units; the within-unit SD represents an estimate of the measurement error for the particular technique-location combination ().
Table 2. Estimates of measurement error for different volume measurement techniques (PHEAF manufacturer model E).
We note that the intake hot wire anemometer volume measurement is quantified as an average of nine sector-based measurements. summarizes the airflow velocities measured at each sector; the volumetric measurements are derived by multiplying each PHEAF device’s average face velocity for each section by the cross-sectional area of the intake face.
Table 3. Face velocities (feet per minute) measured at nine filter sectors on PHEAF manufacturer model E, mean (coefficient of variation) (n = 126 measurements per sector).
These measurements are highly correlated (minimum pairwise correlation of 0.95), resulting in the average across the nine sectors not having a lower variability than an individual sector measurement but involving 9 times the work. The nine measurements are also not significantly different from each other; a one-way repeated-measures analysis of variance (ANOVA) F test (F8,1075) produced a P value of 0.25. The center sector velocity measurements have the lowest variability of all the sectors (), which is reflected in the low within-unit SD of the volumetric measurement in ; it also has the lowest average measurement, which makes it most discrepant from the advertised airflow of the machine. The balometer measurement involves a single measurement and as evidenced by the within-unit SD estimates in perform similarly regardless of the location of the measurement (intake vs. exhaust).
Relation between intake and exhaust measurements
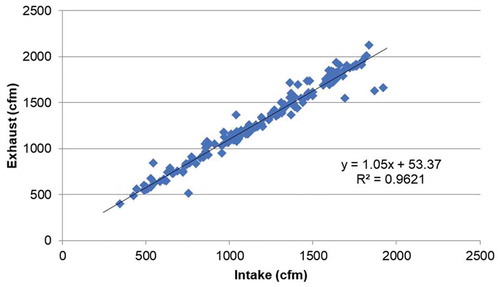
One would expect that for PHEAF devices in good working order, the airflow measurements at the intake and exhaust would be similar. and show the intake and exhaust airflow measurements for PHEAF model E units for the hot wire anemometer and balometer, respectively. Simple linear regression analysis was used to show correlation between the intake and exhaust measurements by measurement technique. The hot wire anemometer shows increased outliers at lower intake airflow volumes. The slope of the line is 0.84 (95% confidence interval [CI]: 0.64–1.04), showing a strong positive relationship, but the regression line only explains 36% of the variability of the exhaust measurements. The balometer shows good correlation between intake and exhaust measurements. The slope of the regression line is 1.05 (95% CI: 1.0–1.09), and the regression explains 96% of the variability of the exhaust measurements. This analysis suggests that the balometer measurements may be less dependent on the location of measurement.
Figure 3. Simple linear regression model of intake volume and exhaust volume as measured by hot wire anemometer for PHEAF model E.
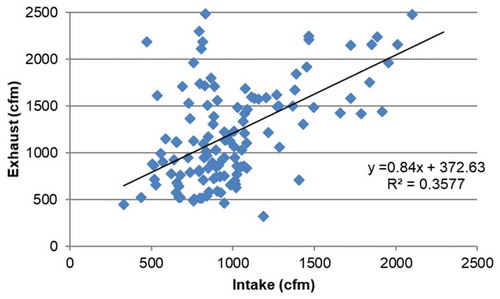
Figure 4. Simple linear regression model of intake volume and exhaust volume as measured by balometer for PHEAF model E.
Significance of volume measurement
The relationship between measured airflow and the calculated photometer setting is illustrated in .The airflow referenced in the table reflects the mean values reported in this study for manufacturer model E’s intake volume by the hot wire anemometer (1025 cfm) and exhaust volume by balometer (1308 cfm).
Table 4. Effect of volume measurement on percent capture efficiency when particle penetration is measured at 10%.
To describe the relationship between the airflow measurement and photometer setting, assume that the measured airflow volume through the PHEAF device was 1025 cfm with a recorded particle penetration of 10%. However, when adjusted to the actual airflow (i.e., 1308 cfm), the particle penetration is 12.38%, which is an approximate difference of 21% between the measured capture efficiency and actual % capture efficiency.
Discussion
In this study, the hot wire anemometer and balometer techniques were evaluated for their reliability to measure airflow moved through the PHEAF device. The PHEAF device sample population represents the design and construction characteristic of units used during asbestos abatement and mold remediation projects. Such device types are also deployed for dust control during interior renovation projects.
Over the course of the study, measured airflow volumes were observed to be substantially less than the models’ rated capacity. Stated airflow capacity may vary from brand to brand because manufacturers use different rating methods and components. For example, a manufacturer can describe the unit’s airflow capacity based on a test bench rating of the centrifugal fan. In this case, the airflow produced by the device will be substantially lower when enclosed in a cabinet with an inline HEPA filter. Other manufacturers describe the airflow capacity with the HEPA filter installed in the cabinet. In a field setting, the measured airflow may further differ from the manufacturer’s rating due to the saturation level of the HEPA filter. Furthermore, a blower with lower horsepower compared with a blower with higher horsepower will have a greater reduction of airflow as the dust loading on the filter increases.
Often, the manufacturer’s rated airflow is referenced by project designers to calculate air exchange rates for a work space of known volume. The findings from this study suggest that this approach would practically lead to the underestimate of PHEAF device capacity, and that additional PHEAF devices may be necessary to acquire the desired air exchange rate or negative air pressure differential for containment areas. As evident from this study, the appropriate number of PHEAF devices should be verified at the project site by quantifying individual airflow capacity.
For each instrument, a difference in airflow rate was measured between the sample locations. We found the average intake volume to be less than the average exhaust volume for each PHEAF device model; however, the mean intake airflow measured by hot wire anemometer was relatively less compared with the same location measured by balometer. The measurements by balometer also showed high positive correlation between sample locations across PHEAF devices. Although these general patterns suggest that balometer measurements are more consistent, we did not take paired balometer and hot wire anemometer measurements on the devices, which prevents a direct comparison between instruments.
Measurement variability by the same instrument could be attributed to unequal distribution of air at the exhaust location. Since configuration of the PHEAF device’s exhaust port may disrupt airflow, an option to promote proper formation of the velocity profile is use of a straight duct extension to the collar. Although this technique is recommended to improve symmetrical airflow for measurement accuracy by hot wire anemometer, the practical use of an extension at least seven duct diameters in length would be unlikely in the field due to the necessity to have multiple extensions to accommodate the variety of collar diameters found among PHEAF devices. The effect of an uneven velocity distribution across the balometer’s sensor array may also lead to measurement error. Compared with the hot wire anemometer, there is an increase distance between the exhaust port and balometer’s sensing manifold due to the length of the fabric flow hood. One could speculate that the increased distance may reduce the effect of disparate velocity on measurement accuracy; however, further study is required to prove this hypothesis.
A general observation that we note in this study is that the measured airflow at the intake is lower than the corresponding measurement at the exhaust. This could be attributed to air leaking between the PHEAF device’s intake cover and cabinet. Air infiltrating between the cover and cabinet would not be measured as air was drawn into the PHEAF device. Air can also enter through fasteners used to secure the cabinet components. The location where the control panel penetrates the PHEAF cabinet can leak air if not sealed by caulk or gasket. Another explanation for a lower intake airflow is that the metal cover limited the proximity of the hot wire anemometer probe to the filter face, resulting in a lower reading as suggested by Whyte, Whyte, and Green (Citation2010). The inverse relationship between distance from the filter face and measured velocity reported by Whyte et al. suggests that a higher velocity would be measured closer to the filter face, translating to higher volumetric flow rate for the PHEAF device. A research project exploring other techniques to assess airflow through the PHEAF device may be insightful. However, it is unlikely, in our opinion, that a more accurate and reliable measurement strategy would give estimates comparable to the manufacturer’s rated volume. For this reason, we suspect the manufacturer’s airflow rating for PHEAF devices in this study likely does not take the presence of the HEPA filter into account.
In our data analysis, we observed that the middle-center sector had the lowest average velocity compared with the perimeter sectors at the intake location. This phenomenon could be associated with higher velocity along the intake perimeter cabinet walls compared with the middle-center sector. We also considered whether we could get consistent estimates of velocity by taking a single measurement at the intake location with the hot wire anemometer instead of averaging the measurements from the nine sectors. Although multiple traverses across the cross-section of the intake opening is recommended practice, the correlation of the nine sectors suggests that one could do just as well with a single measurement at the middle-center sector as averaging over the nine sectors.
Real-world application
Increase in PM concentration, including fungal contaminants, is associated with demolition and renovation activities (Curtis et al. Citation2005; Fournel et al. Citation2010; Goebes et al. Citation2008; Sautour et al. Citation2007). Building materials themselves, as well as dirt and dust accumulating on the substrate, can harbor fungal contamination, which can aerosolize when disturbed. Fungal contaminants traced to construction activity in the health care setting has been linked to morbidity among susceptible patients.
During construction activities in a health care setting, the lowest feasible concentration of contaminants within the patient care area needs to be achieved; otherwise, patients who are immunocompromised may be at an increased risk of a health care–associated infection (HAI). Species of Aspergillus associated with HAIs during construction activities have previously been reported (Chang et al. Citation2008; Patwari et al. Citation2014; Vonberg and Gastmeier Citation2006). An increase of >1 colony forming units per cubic meter (cfu/m3) has been identified with a 4-fold increase in Aspergillus-associated HAIs (Arnow et al. Citation1991); therefore, any increase in the concentration of airborne Aspergillus heightens the risk of HAIs among susceptible individuals (Latgé Citation1999). For this reason, an Infection Control Risk Assessment Matrix adopted by hospitals accredited by The Joint Commission recommends use of PHEAF devices to minimize cross-contamination outside of the work area (Bartley Citation2000). As previously stated, effectiveness of the PHEAF device is related to its capture efficiency, which is derived from the difference between the upstream and downstream aerosol challenge concentrations. This study emphasized the importance of the airflow measurement in determining the upstream baseline aerosol concentration.
To highlight the significance of the upstream baseline concentration, assume that a PHEAF device exhausting into the building envelope had a measured airflow of 1025 cfm with a calculated average capture efficiency of 90%. A study of a large tertiary hospital undergoing renovation reported a mean Aspergillus concentration of 13.2 cfu/m3 inside the work zone (Curtis et al. Citation2005). Adopting this finding to our scenario presented in translates to a fungal concentration of 1353 cfu/m3 (1025 cfm × 13.2 cfu/m3 × 1–90%) exhausting from the PHEAF device into the building space. However, applying the true airflow rate suggests that the actual fungal concentration would be approximately 2137.5 cfu/m3 (1308 cfm × 13.2 cfu/m3 × 1–87.62%) or a 45% difference. Such a difference in the calculated emission rate compared with the actual emission rate could affect decision-making in the risk assessment process.
Limitations
There are several limitations of this study. First, the hot wire anemometer measurements at the exhaust location were derived from single centerline values. We acknowledge widely referenced ventilation standards that advise not to use the centerline measurement to approximate average velocity. We chose this approach recognizing the practice of single-point measurement is referenced by manufacturers of hot wire anemometers as a quick check in the field setting. Considering the configuration of the PHEAF device’s exhaust port, it is reasonable to assume that the single centerline measurement technique could be adopted by field technicians without data discrediting the practice. This study suggests that a single centerline measurement produces variable results and is not appropriate for approximating airflow through the PHEAF device.
As mentioned earlier, we did not take parallel balometer and hot wire anemometer measurements on any of the PHEAF devices, thus preventing a direct comparison of the two techniques. We also recognize that this study did not evaluate measurement accuracy, since we did not have access to a laboratory setting to objectively determine the actual airflow through the machines. Issue with instrument accuracy could be associated with the laboratory parameters used during factory calibration compared with the field settings present in this study. Calibration drift can also affect the accuracy of the instrument, although during this study the instruments were factory serviced on 12-month intervals.
Finally, we only took one volumetric airflow measurement at each sampling location for each PHEAF device in each sampling round, which prevents us from evaluating the intrinsic measurement error of each technique across repeated independent measurements of the same unit under the same conditions.
Conclusion
This study illustrates the importance of identifying a reliable technique for measuring airflow when mathematically setting the aerosol photometer’s 100% baseline to estimate the efficiency of the PHEAF device. Capture efficiency measurements are directly dependent upon the span setting of the aerosol photometer, which can be calibrated to the measured air volume through the PHEAF device. Our preference for using the balometer technique is based on the following factors: (1) fewer measurements are required by balometer compared with the hot wire anemometer to approximate airflow through the PHEAF device; (2) the hot wire anemometer produces fluctuating readings from inadvertent probe movement within the airstream; and (3) likely need of a duct extension to produce a symmetrical velocity profile when measuring exhaust airflow using the hot wire anemometer.
Acknowledgment
The authors would like to thank Scott Robins for assistance in the collection of field measurements in support of this study.
Additional information
Notes on contributors
Derek A. Newcomer
Derek A. Newcomer is an industrial hygienist at the Division of Occupational Health and Safety, National Institutes of Health, Bethesda, MD.
Peter LaPuma
Peter LaPuma and Amanda Northcross are professors at the Milken Institute School of Public Health, George Washington University, Washington, DC.
Robert Brandys
Robert Brandys is a principal with Occupational & Environmental Health Consulting Services, Inc., Las Vegas, NV.
Abhijit Dasgupta
Abhijit Dasgupta is a consultant with ARAAstat, Germantown, MD.
References
- Arnow, P. M., M. Sadigh, C. Costas, D. Weil, and R. Chudy. 1991. Endemic and epidemic Aspergillosis associated with in-hospital replication of Aspergillus organisms. J. Infect. Dis. 164 (5):998–1002. doi:10.1093/infdis/164.5.998.
- Bartley, J. M. 2000. APIC state-of-the-art report: The role of infection control during construction in health care facilities. Am. J. Infect. Control 28 (2):156–69. doi:10.1067/mic.2000.109907.
- Brandys, R., and G. Brandys. 2011. In-field test methods and reference standards for portable high efficiency air filtration (PHEAF) equipment. Hinsdale, IL: OEHCS Publications.
- Chang, C. C., E. Athan, C. O. Morrissey, and M. A. Slavin. 2008. Preventing invasive fungal infection during hospital building works. Intern. Med. J. 38 (6b):538–41. doi:10.1111/j.1445-5994.2008.01727.x.
- Curtis, L., S. Cali, L. Conroy, K. Baker, C.-H. Ou, R. Hershow, F. Norlock-Cruz, and P. Scheff. 2005. Aspergillus surveillance project at a large tertiary-care hospital. J. Hosp. Infect. 59 (3):188–96. doi:10.1016/j.jhin.2004.07.016.
- Department of Energy. 2003. Nuclear air cleaning handbook. DOE-HDBK-1169-2003, U.S. Department of Energy, Washington.
- Fournel, I., M. Sautour, I. Lafon, N. Sixt, C. L’ollivier, F. Dalle, P. Chavanet, G. Couillaud, D. Caillot, and K. Astruc. 2010. Airborne Aspergillus contamination during hospital construction works: Efficacy of protective measures. Am. J. Infect. Control 38 (3):189–94. doi:10.1016/j.ajic.2010.01.013.
- Goebes, M. D., E. J. Baron, K. L. Mathews, and L. M. Hildemann. 2008. Effect of building construction on Aspergillus concentrations in a hospital. Infect. Control Hosp. Epidemiol. 29 (5):462–64. doi:10.1086/590662.
- Institute of Environmental Sciences and Technology. 2016. IEST-RP-CC034.4: HEPA and ULPA Filter Leak Tests. Schaumburg, IL: Institute of Environmental Sciences and Technology.
- Latgé, J.-P. 1999. Aspergillus Fumigatus and Aspergillosis. Clin. Microbiol. Rev. 12 (2):310–50. doi:10.1128/CMR.12.2.310.
- Newcomer, D. A., P. LaPuma, R. Brandys, and A. Northcross. 2018. Capture efficiency of portable high-efficiency air filtration devices used during building construction activities. J. Occup. Environ. Hyg. 15 (4):285–92. doi:10.1080/15459624.2017.1422869.
- NSF International. 2015. What to expect when having your biosafety cabinet field certified. https://www.nsf.org/newsroom_pdf/Biosafety_Cabinets_Memo_Facilities.pdf.
- NSF International Standard/American National Standards Institute. 2014. Biosafety cabinetry: Design, construction, performance, and field certification. Ann Arbor, MI: NSF International.
- Patwari, P., J. Cutrell, A. Bhaskaran, S. Trevino, and P. Sreeramoju. 2014. Surveillance of patients identified with fungal mold at a public academic medical center. Am. J. Infect. Control 42 (7):776–80. doi:10.1016/j.ajic.2014.03.025.
- Sautour, M., N. Sixt, F. Dalle, C. L’Ollivier, C. Calinon, V. Fourquenet, C. Thibaut, H. Jury, I. Lafon, and S. Aho. 2007. Prospective survey of indoor fungal contamination in hospital during a period of building construction. J. Hosp. Infect. 67 (4):367–73. doi:10.1016/j.jhin.2007.09.013.
- Vonberg, R., and P. Gastmeier. 2006. Nosocomial Aspergillosis in outbreak settings. J. Hosp. Infect. 63 (3):246–54. doi:10.1016/j.jhin.2006.02.014.
- Whyte, W., W. M. Whyte, and G. Green. 2010. The measurement of air supply volumes and velocities in cleanrooms. Int. J. Vent. 8 (4):325–36. doi:10.1080/14733315.2010.11683856.
- Workers’ Compensation Board of British Columbia. 2017. Workers compensation act. Occupational Health and Safety Regulation. 143. WorkSafeBC. 2019. Part 06 Substance Specific Requirements. Accessed March 1, 2019. https://www.worksafebc.com/en/law-policy/occupational-health-safety/searchable-ohs-regulation/ohs-regulation/part-06-substance-specific-requirements.