
ABSTRACT
We report results from a blind comparison of five analytical laboratories ISO/IEC 17025 (International Organization for Standardization/International Electrotechnical Commission) accredited for the analysis of sulfate collected in H2O2(aq) from industrial stacks in accordance with the European Standard Reference Method (SRM) for sulfur dioxide (SO2) (EN 14791): the method produced under European Commission mandate to support the enforcement of the Industrial Emissions Directive (IED). Both “synthetic” (sodium sulfate dissolved in aqueous hydrogen peroxide [H2O2(aq)]) and “real” (extracted and collected from a stack simulator facility in accordance with EN 14791) samples were prepared across 2–10 and 10–290 mg·m0−3 emission equivalent concentration ranges, respectively. From the measurements returned by the laboratories, it was found that in 35% of the former and 28% of the latter the stated expanded uncertainty limits did not intersect with the mean. It was also found with the real samples that in 30% of the 46 different concentration test levels the stated expanded uncertainty of at least two of the laboratories did not intersect. With respect to compliance monitoring, it was found that EN 14791 was capable of enforcing emission limits under the IED associated with waste incinerators (i.e., 50 mg·m0−3), as only 3% of the deviations were in excess of the required uncertainty (commensurate with a 95% level of confidence). However, with respect to the use of EN 14791 for calibration of automated measuring systems (AMSs), it was found that 38.5% of the deviations were in excess of the uncertainty recommended by at least one national regulator as being necessary for EN 14791 to be an “effective tool” for the calibration of AMSs. With emission limits under the IED and the Best Available Technique Reference (BREF) documents it adopts becoming increasingly stringent, it is clear that more work is needed to determine the capability of the SRM and also alternative methods based on portable instruments.
Implications: The deviations observed between laboratories ISO/IEC 17025 accredited for sulfate analysis bring into question the monitoring communities’ ability to routinely meet the uncertainty requirements associated with increasingly stringent SO2 emission limits under the European Union’s Industrial Emissions Directive. Furthermore, with even further reductions in the near future due to legislative adoption of BREF documents, such issues are only likely to be exacerbated. If the European monitoring community is to have confidence in the capability of the existing Standard Reference Method described in EN 14791 for enforcing increasingly stringent limits, work is needed to validate this method at these lower emission levels.
Introduction
The impacts of sulfur dioxide (SO2) pollution are well understood in terms of acidification of ecosystems, worsening of respiratory complaints, and a cooling effect on the atmosphere via secondary particle formation. Since 1983, signatories to the United Nations Economic Commission for Europe (UNECE) Convention on Long-range Transboundary Air Pollution (CLRTAP) have been required to develop policies and strategies to limit and reduce air pollution (UNECE Citation1979). Within Europe, SO2 national emission ceiling limits have been established under both the UNECE Gothenburg Protocol (UNECE Citation1999) and the European Union’s (EU) National Emission Ceilings Directive (NECD; European Commission [EC] Citation2001a). Both these agreements have been developed in parallel, and, at the time of writing, for many member states stricter limits are generally found in the latter. To monitor compliance, member states are required to report national emission inventories into the European Pollutant Release and Transfer Register (E-PRTR; EC Citation2006), which in compliance with the Kiev Protocol (United Nations [UN] Citation2003) is publically available, ensuring that progress in reducing pollution is transparent and accountable.
Previously, the industrial sector was covered by seven different directives, including Large Combustion Plant (EC Citation2001b) and Waste Incineration (EC Citation2000), specifying emission limit values (ELVs) varying with process type and size. In order to enable enforcement of SO2 ELVs, the EC mandated Comité Européen de Normalisation (CEN) to produce a Standard Reference Method (SRM) for the measurement of emissions from stacks and flues, namely, EN 14791: “Stationary Source Emissions: Determination of Mass Concentration of Sulphur Dioxide—Reference Method” (CEN Citation2005a). EN 14791 describes a method including both extraction and collection of SO2 followed by analytical laboratory sulfate measurement. The method involves inserting a heated probe into the stack and extracting a sample of the emission (generally hot and wet, e.g., 400 °C, 25%vol H2O) through a heated filter (to remove dust) and bubbled through a series of glass impingers filled with aqueous hydrogen peroxide (H2O2(aq)). Any SO2 present is dissolved in the impingers as sulfate, which is decanted and dispatched to an analytical laboratory for measurement, i.e., the SRM is not a real-time method. The analysis portion of the SRM requires the use of either ion chromatography or thorin titration to determine the concentration of sulfate present. Combining this with knowledge of the total volume of stack gas extracted allows the SO2 emissions to be expressed at standard temperature and pressure in mg·m0−3 (ELVs in applicable directives are generally specified using these units. NB: the subscript 0 represents standard temperature and pressure and is defined as 273 K and 101.3 kPa).
It is not always mandatory to use the SRM, and a national regulator may permit the use of an alternative method (AM) if it has been demonstrated to produce equivalent data to the SRM in accordance with CEN/TS 14793: “Stationary Source Emission—Intralaboratory Validation Procedure for an Alternative Method Compared to a Reference Method” (CEN Citation2005b). An example of this has been reported previously where a UK method based on portable Fourier transform infrared spectroscopy (Environment Agency for England [EA] Citation2012b) was shown to produce equivalent data to the SRM for SO2 and some other key pollutants (Coleman et al. Citation2015). However, it should be noted that there is something of a split across Europe in that some national regulators permit the use of AMs whereas others do not. At the time of writing, CEN is elevating 14793 from a Technical Specification (TS) to an European Norm (EN) level document, meaning that adoption as a national standard will become mandatory (adoption of a TS is optional and some member states had opted out). However, even with full adoption, national regulators are not obliged to accept the use of AMs, so the split is likely to remain for the foreseeable future. There are both advantages and disadvantages associated with either position, but these are beyond the scope of this paper.
The SO2 SRM is used for both what is commonly referred to as “compliance monitoring” and the calibration of automated measuring systems (AMSs; often referred to as continuous emission monitors [CEMs] in the United States and the United Kingdom). Compliance monitoring involves the site operator contracting a stack testing organization to periodically visit the site to measure the emissions demonstrating compliance with the applicable ELV(s). However, with more and more processes being required to install AMSs (required by the Industrial Emissions Directive [IED] at any plant with a thermal input of 100 MW or more), calibration has become an increasingly important activity. An AMS is an instrumental system (e.g., gas filter correlation) installed by the operator on the stack to continuously measure emissions year round. It is a regulatory requirement that such systems are annually calibrated (or calibration checked) via in situ parallel measurements against the SRM, and the method for this is provided in EN 14181: “Stationary Source Emissions—Quality Assurance of Automated Measuring Systems” (CEN Citation2014). Again, in some member states where alternative methods are permitted, AMSs are calibrated in accordance with EN 14181 against such alternative methods. However, as it is a requirement to demonstrate that an AM is equivalent to the applicable SRM in accordance with CEN/TS 14793, it can be seen that the SRM provides the common reference point for all measurements of a given measurand in the industrial sector, i.e., in principle the accuracy of all emission measurements is dependent on the SRM.
Uncertainty requirements in emission measurements are expressed in terms of percentage of ELV; consequently, as ELVs become increasingly stringent so do the absolute uncertainty requirements. In 2013, the Large Combustion Plant, Waste Incineration, and five other directives were replaced by the Industrial Emissions Directive (EC Citation2010). Although this provided some practical consolidation, the key change was to bring in a raft of increasingly stringent ELVs in the continued effort to reduce pollution. Industry has in general kept pace with these requirements by adapting processes to produce less waste and improving plant abatement technologies. Consequently, processes that used to emit 100s mg·m0−3 of SO2 now emit 10s mg·m0−3 or in some cases even less. Also, given that the global AMS market is estimated to be worth ~$1 billion, with Europe making up a significant portion, unsurprisingly instrument manufacturers have developed AMSs capable of measuring ever decreasing amounts of emission. Hence, with decreased emissions and increasingly stringent ELVs on the horizon, it is timely to take stock of the measurement capability at the disposal of the emissions community in terms of both compliance monitoring and also calibration of AMSs.
We report the results of a study involving splitting (to eliminate stack gas extraction and collection uncertainties) sulfate samples collected from a stack simulator facility and also samples prepared synthetically. The split samples were dispatched to five UK analytical laboratories ISO/IEC 17025 (International Organization for Standardization/International Electrotechnical Commission) accredited for sulfate analysis routinely used by UK stack testing organizations. None of the analytical laboratories were aware that they were involved in the study, i.e., all testing was blind. Deviations in returned analyses were compared with the maximum permissible uncertainty from applicable legislation/standards.
Experimental
Two types of samples were prepared for the study: “synthetic samples,” prepared in a laboratory, and “real samples,” collected from the National Physical Laboratory’s (NPL) stack simulator facility (Coleman et al., Citation2013, Citation2010). For the former, two solutions were prepared at nominally 1 and 5 µg·mL−1 by dissolving sodium sulfate in 0.3% H2O2(aq)—this being the solvent that EN 14791 stipulates is used for absorbing SO2 from extracted stack gas. Each solution was split 20-fold (the capability to prepare homogeneous solutions being demonstrated by NPL’s ISO/IEC 17025 [ISO Citation2005] accreditation for this activity) and dispatched to five UK analytical laboratories ISO/IEC 17025 accredited for the measurement of sulfate. This resulted in each laboratory receiving four samples of each concentration test level, i.e., eight samples in total. In order to ensure that all testing was “blind,” none of the five laboratories were aware that they were involved in the study and all the synthetic samples were dispatched by the NPL Stack Emissions Team with the usual chains of custody—i.e., as far as the laboratories were aware, all the samples had been collected from a real stack as part of routine monitoring work (this to ensure representative data and to avoid any potential influence on behavior, for example, similar to behavioral changes that can sometimes occur when participating in a proficiency testing scheme). The five laboratories all returned certificates of analyses and measurement uncertainties. The results were converted from µg·mL−1 to mg·m0−3 if 0.5 m3 of stack gas had been extracted at standard temperature and pressure: on a real stack, a typical period per sample is 30 min, and at a typical extraction flow rate (e.g., 16 L·min−1) this equates to approximately 0.5 m3 of stack gas being passed through the absorbing solution.
The “real samples” were collected by generating test matrices using NPL’s stack simulator facility replicating concentrations found at waste incinerator processes and in some tests extending up to concentration levels found at large combustion plants. The simulator was run at 180 °C with a recirculating gas velocity of 12 m·sec−1. In total 46 separate test matrices were generated, varying each species across the following ranges: SO2, 0–290 mg·m−3; carbon monoxide (CO), 0–100 mg·m−3; nitric oxide (NO), 0–300 mg·m−3; hydrogen chloride (HCl), 0–60 mg·m−3; and water (H2O), 0–14%vol. Other species were included at fixed concentrations: 15 mg·m−3 ammonia (NH3); 30 mg·m−3 nitrogen dioxide (NO2); volatile organic compound (VOC) mixture (9 mg·m−3 methane [CH4]/8 mg·m−3 ethane [C2H6]/8.5 mg·m−3 propane [C3H8]); 10%vol carbon dioxide (CO2); and 10%vol oxygen (O2). Samples were collected from the facility in accordance with EN 14791 using an Apex heated probe with titanium liner (heated to 180 °C to avoid condensation loses) (West Virginia, USA), insulated polytetrafluoroethylene (PTFE) line (also heated to 180 °C), borosilicate glass impingers, Apex XC-572 Metric Meter Console (for measuring temperature and total volume sampled), and an Apex XE-0523 Method 5 pump. Four impingers were used: the first two filled with 0.3% H2O2(aq), the third empty (to catch any bubble over of solution), and the fourth filled with silica gel (all impingers were placed in an ice bath to remove water vapor from the gas phase to protect downstream apparatus, the silica gel in the fourth impinger providing additional assurance of this). At the end of each 30-min run, any liquid in the third impinger was poured into the second along with rinsings of the glass connector between the first and second impingers (ensuring that any sulfate captured in condensate on the internal walls of this connector was not lost). The analytical laboratory results confirmed that in all cases the EN 14791 absorption efficiency test was passed, i.e., >95% of the total sulfate measured was found in the first impinger (the principle of this test being that if >95% of the total sulfate is found in the first impinger, then it is unlikely that any SO2 has passed through both impingers without being captured). All sample collections were carried out by members of NPL’s stack emission monitoring team certified to Monitoring Certification Scheme (MCERTS) Level 2 under the Environment Agency for England Personal Competency Standard (EA Citation2012a). NPL holds ISO/IEC 17025 accreditation for the implementation of EN 14791 and ISO/IEC 17043 (ISO Citation2010) accreditation for proficiency testing based in the stack simulator facility.
A sufficient volume of H2O2(aq) was used in the impingers to allow each of the 46 samples to be split 3-fold. This eliminated any bias in the stack gas extraction and collection (e.g., leaks), ensuring that any laboratory-to-laboratory deviation would be purely due to the laboratories themselves. Three out of the five ISO/IEC 17025–accredited laboratories used for the synthetic samples were arbitrarily chosen to analyze the stack simulator samples. In common with the synthetic samples, none of the laboratories were aware that they were involved in the study and chains of custody documents were included so the samples appeared as if collected in the course of routine monitoring work.
Results and discussion
For the synthetically prepared sulfate samples, it is seen that 14 out of the 40 measurements (35%) do not agree within the laboratory’s stated expanded (k = 2) uncertainties with the mean of each test (). To give these data context, it is necessary to examine the requirements of the SO2 SRM described in EN 14791. EN 14791 requires a maximum permissible uncertainty of ≤20% (k = 2) of the ELV and within that describes a number of performance requirements (that will contribute to the total uncertainty) that must be met. For example, with regard to extracting and collecting SO2 from the stack, it requires that the leak rate is ≤2.0% of the total flow rate: although the sampling apparatus is a “closed” system, EN 14791 acknowledges that because of glass joints, etc., achieving a perfectly leak tight system is not always possible; hence, the requirement is to measure the rate at which ambient air is leaking into the system (via blocking the front of probe and measuring the flow rate whilst the pump is running) and take account of this in the uncertainty budget (if the leak rate is >2.0%, the system/data cannot be used). With regard to the laboratory analysis, the requirement is a repeatability of 2.5% of value. Achieving this, even at the relatively low concentrations considered here, is generally a trivial matter. However, repeatability is not the same as uncertainty, rather a component thereof. Uncertainty is a combination of both systematic and random sources, and repeatability only provides an estimate of the latter. Hence, EN 14791 does not stipulate a specific uncertainty requirement for the analytical laboratory measurement: this in contrast to other elements of the method, e.g., it is required that the extracted volume of stack gas is known to an uncertainty of 2.5% (k = 1) of value.
Figure 1. Blind comparison of laboratory measurements of synthetic sulfate samples at two test levels. Mean of each test (—); uncertainty limits as stated by each respective laboratory at 95% confidence (k = 2).
Uncertainty is defined as an upper and a lower limit between which the “true” value is expected to reside within a specified level of confidence. In these discussions, we consider that the mean of the measurements at each test level (calculated across the 20 samples) is a reasonable estimate of the “true” value. This assumption being made on the basis that the selected laboratories are well regarded in the United Kingdom for this type of measurement and hold ISO/IEC 17025 accreditation for sulfate analysis. Hence, for the purposes of discussion, we consider that the deviation of each laboratory’s measurement from the mean provides an estimate of the laboratory’s uncertainty in measuring the test sample. In addition, regardless of whether the mean is a reasonable estimate of the “true” value or not, if deviations from the mean are significant in relation to the maximum permissible uncertainty, then this shows that the laboratory-to-laboratory deviation is also significant. If the deviations are significant, then this shows that if extracted and collected samples are sent for analysis to one laboratory or other, then the reported emissions will alter significantly. If this deviation is approaching or in excess of the maximum permissible uncertainty, then this raises questions over the real accuracy that can routinely be achieved under EN 14791. However, due to the limited number of laboratories included in the study here, this would be more an indication that this should be examined by the community more comprehensively rather than a final definitive answer. Or to put it another way, more testing would be needed to have confidence that the five laboratories included in the study here are representative of the broader population of accredited laboratories.
It should be noted that it is considered that the deviations observed here are due purely to the laboratories themselves, as the sample-to-sample variance is deemed negligible. ISO/IEC 17025 accreditation of the preparatory laboratory evidences that the solutions are homogeneously mixed, contamination of sample bottles is unlikely because all bottles are acquired from the same supplier in the same batch, and in transporting samples to laboratories sulfate in 0.3% H2O2(aq) is considered stable because it is neither light nor temperature sensitive (sample bottles could leak, but this would be obvious and in any case would not alter the solution concentration).
The SO2 SRM (in common with SRMs for other species) was validated under a mandate from the European Commission across a series of field trials. As part of the validation work, an interlaboratory test of 22 analytical laboratories was carried out analyzing four sulfate solutions: blank, 50.1, 61, and 86 μg·mL−1. The validation found that for the 86 μg·mL−1 solution, the standard deviation of repeatability was 2.5% of value (the basis for the EN 14791 requirement) and the standard deviation of reproducibility was 6.5% of value. As already described, EN 14791 does not specify a required measurement uncertainty for the analytical laboratory. However, as the mandated validation work determined a reproducibility of 6.5% of value, it is reasonable to compare the deviation from the measurements reported here with this threshold.
Comparing the data with this threshold, it is found that 21 out of the 40 measurements (52.5%) show a deviation in excess of 6.5% (). On the one hand, it might be argued that this is a challenging test because the concentrations involved are significantly lower than that used in the mandated validation, since if included on the plot () a solution of 86 μg·mL−1 would appear as an emission of 172 mg·m0−3. But on the other hand, testing at low concentrations is justifiable, since there are now many processes emitting at these levels. So if accredited laboratories do not routinely show reproducibility on the order of 6.5%, then it is important to consider whether this has implications for the total uncertainty associated with the SO2 SRM.
Figure 2. Relative deviation of each measurement from the associated mean from . Laboratory-to-laboratory standard deviation of reproducibility found for EN 14791 during its original validation under European Commission mandate (--).
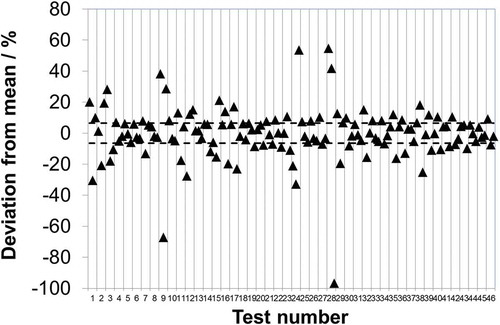
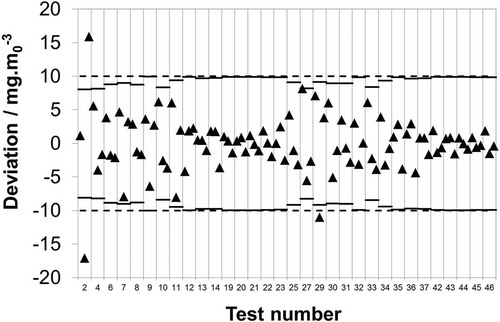
To test whether the level of deviation seen at low concentration was maintained across a broader concentration range, and also to introduce a real stack matrix, the “real samples” collected from the stack simulator were dispatched to laboratories b, d, and e. It is seen that in 39 out of 138 measurements (28%) the stated uncertainty limits do not intersect with the mean and, moreover, that in 14 of the 46 tests (~30%) the uncertainty limits stated by at least two of the laboratories do not intersect (). Further, it is found that 72 out of the 138 measurements (52.2%) show a deviation in excess of 6.5% (). It is noteworthy that the relative deviation () does not appear to have a concentration dependency and the data are relatively evenly distributed (e.g., test 18 vs. test 19). However, in contrast, there does appear to be some concentration dependency when considering the synthetic samples. Here, it is seen that out of the 14 measurements where the stated uncertainty does not intersect with the mean, 12 come from the lower test level. Only one of the five laboratories increases the relative uncertainty it quotes at lower concentrations and contributes only 1 of these 12 instances. The other four laboratories all assume that the absolute uncertainty scales as a function of concentration, i.e., that the relative uncertainty stays fixed. Although this might hold true over a limited higher range, the data here imply that at these lower levels the absolute uncertainty may no longer be scaling down proportionately with concentration. Given that these laboratories quote a limit of detection significantly below these levels (e.g., 2 orders of magnitude below in the case of laboratory e), this highlights the importance of considering how the uncertainty scales as a function of concentration. Hence, whereas the real samples show evidence that the relative uncertainty may remain fixed across ~10–290 mg·m0−3, the synthetic samples indicate that this breaks down below the 10 mg·m0−3 level and that the relative uncertainty starts to increase.
Figure 3. Blind comparison of laboratory b, d, and e measurements of real sulfate samples extracted and collected from a stack simulator facility. Uncertainty limits as stated by each respective laboratory at 95% confidence (k = 2).
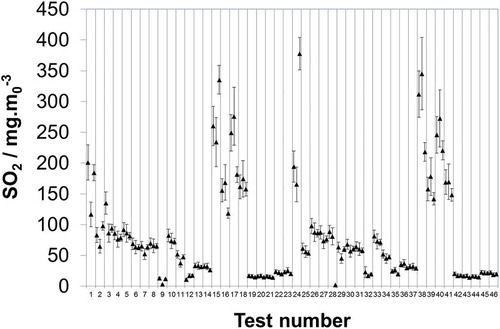
Figure 4. Relative deviation of each measurement from the associated mean from . Laboratory-to-laboratory standard deviation of reproducibility found for EN 14791 during its original validation under European Commission mandate (--).
A key role of the SRM is what is known as “compliance monitoring” where stack testing organizations carry out periodic measurements to show that process operator facilities are emitting within the ELVs stipulated in associated licenses. Waste incinerator processes are widespread across Europe, and it has become a general convention within the industry to benchmark the performance of methods and their associated techniques against the requirements for this type of process. The SO2 ELV for waste incinerators is 50 mg·m0−3, so as the maximum permissible uncertainty is 20%, this equates ±10 mg·m0−3 (k = 2). The valid measurement range for waste incinerators is stipulated in the IED as 1.5 × ELV; hence, extracting the data across a concentration range of 0–75 mg·m0−3 enables the deviations to be put into the context of this common type of process plant. Across this emission range, it is seen that only three measurements exceed the maximum permissible uncertainty, and given that the uncertainty requirement is expressed at 95% confidence, a small number of determinations would reasonably be expected to be beyond these limits (). However, it is not the analytical laboratory’s uncertainty alone that must meet this requirement but rather the total uncertainty, including also the sources attributable to extraction and collection of SO2 from the stack. It is noteworthy that one of the laboratories quotes an uncertainty of 17% of value; hence, as the emission approaches 50 mg·m0−3, this then leaves a reduced tolerance for the extraction and collection uncertainties, specifically ≤5.3 mg·m0−3. Table 2 of EN 14791 describes the significant uncertainty sources associated with extracting and collecting SO2. These being the volume of the absorption solution, leak in the sampling line, value of the field blank, and volume of extracted gas. A typical value combining these sources at 50 mg·m0−3 is ~3.6 mg·m0−3 (k = 2), i.e., ~7.2%. Subtracting (in quadrature) 7.2% of the mean value in each test from the IED uncertainty requirement shows the portion remaining that the analytical laboratory must not exceed if the measurement is to be compliant. Consequently, it is seen again that only the same three measurements (3.1%) deviate in excess of the directive required maximum permissible uncertainty (). Consequently, under the caveat that sampling uncertainties do not exceed 7.2%, this level of performance evidences no issues in meeting the uncertainty requirement and therefore in enforcing the associated emission limit (i.e., 50 mg·m0−3) via “compliance monitoring.”
Figure 5. Data reproduced from in units of concentration covering a 0–75 mg·m0−3 range. Industrial Emissions Directive maximum permissible uncertainty for measuring waste incinerators at 95% confidence (--); maximum permissible uncertainty remaining after subtraction of typical uncertainties attributable to extraction and collection of SO2 from the stack (—).
The other role of the SRM (and indeed SRMs for other species) is the calibration of AMSs. The IED, Part 3, clause 8 requires that “Sampling and analysis of relevant polluting substances and measurements of process parameters as well as the quality assurance of automated measuring systems and the reference measurement methods to calibrate those systems shall be carried out in accordance with CEN standards.” In support of this, CEN have provided EN 14181 covering the calibration of AMSs via parallel measurements against the applicable SRM (in this case EN 14791), which in addition requires that all AMS are type approved in accordance with EN 15267-3 (CEN Citation2007). EN 15267-3 describes laboratory and field testing of the AMS in order to determine its performance characteristics, e.g., drift, linearity, and sensitivity to atmospheric temperature. From these performance characteristics, the independent instrument testing laboratory is able to determine a combined uncertainty for the instrument. Clause 14 of EN 15267-3 requires that the “…uncertainty of the AMS determined from the tests according to this standard should be at least 25% below the maximum permissible uncertainty specified.” The rationale being that there needs to be a safety margin on the AMS performance to ensure that when installed on a stack, it should when operating normally be able to successfully pass quality assurance level 2 (QAL2) and quality assurance level 3 (QAL3) requirements of EN 14181. So, as the IED specifies 20% of the ELV, the AMS is required to meet 15% of the ELV if it is to successfully achieve type approval. Metrologically speaking, an AMS should be calibrated against an SRM capable of at least the same uncertainty as the AMS itself. It is seen that if the maximum permissible uncertainty requirement is reduced from ±10 to ±7.5 mg·m0−3 in line with this and the typical uncertainty attributable to extraction and collection of the SO2 is subtracted (in quadrature), now 12 out of 96 (12.5%) of the measurements show a deviation in excess of the uncertainty requirement, which is above the number of outliers that would be expected at a 95% confidence limit.
Further to the above, in the United Kingdom, the document produced by the national regulator for the implementation of EN 14181 (EA Citation2015) states that it shall be assured that the SRM uncertainty is “…well below the uncertainties specified in the IED (ideally, no more than half the uncertainties specified in the IED). If these conditions are not fulfilled, then EN 14181 will not be an effective tool for calibration of the CEM.” Consequently, if the maximum permissible uncertainty is reduced from ±10 to ±5 mg·m0−3 and the typical uncertainty attributable to extraction and collection of SO2 is subtracted (in quadrature), this results in 37 out of 96 (38.5%) of the measurements showing a deviation in excess of this threshold. Of course, ±5 mg·m0−3 is not a regulatory requirement because the quoted text states “ideally,” but what it does show is that there is at least one national regulator responsible for the enforcement of the IED that considers that this level of uncertainty is necessary for reliably carrying out calibration of AMSs under EN 14181.
Data from proficiency testing of stack organizations measuring SO2 on a stack simulator facility have indicated that the SRM uncertainty goes from around 15% at 60 mg·m0−3 to 35% at 20 mg·m0−3 (European Suppliers of Waste-to-Energy Technology [ESWET], Confederation of European Waste-to-Energy Plants [CEWEP], and European Federation of Waste Management and Environmental Services [FEAD] Citation2016). A key difference between these data and the study presented here is that the former are subject to extraction and collection uncertainty sources. This implies that although analytical laboratory uncertainty may scale with concentration data over a range seen here, between 10 and 290 mg·m0−3, this may not be the case for extraction and collection uncertainties. Consequently, in the example above, it may be an underestimation to only subtract (in quadrature) an extraction and collection uncertainty of 7.2% from the maximum permissible uncertainty. The ESWET et al. data indicate that the extraction and collection uncertainty is probably greater than 7.2% at 50 mg·m0−3 and, even more importantly, that it is significant greater than 7.2% at lower concentrations. Therefore, the three previous examples of subtracting 7.2% (in quadrature) from the half, three-quarter, and full IED uncertainty requirement represent an optimistic view of the number of deviations in excess of said requirements.
An obvious improvement that should be considered for EN 14791 that might address some of these issues would be to include an uncertainty requirement for the analytical laboratory low enough to ensure that with typical extraction and collection uncertainties, the directive maximum permissible uncertainty is likely to be met. The current requirement of the analytical laboratory to demonstrate 2.5% repeatability of value is arguably insufficient, as this does not do enough to help ensure compliance of the overall method with the directive maximum permissible uncertainty. Of course, it is the responsibility of the stack testing organization to combine the analytical laboratory’s quoted uncertainty with those it has estimated attributable to extraction and collection and to ensure compliance of the overall measurement. However, setting a defined requirement of the analytical laboratory in EN 14791 should lead to fewer instances of unreportable data due to noncompliance with the maximum permissible uncertainty.
A common argument with respect to “wet chemistry” methods such as EN 14791 is that the uncertainty can be improved by increasing the sampling time. This is a valid argument, as the absolute uncertainty of the volume meter (for measuring the volume of stack gas extracted) is expected to remain fixed, i.e., doubling the run times halves the relative uncertainty contributing to the overall uncertainty budget, giving a net gain. The same argument is also commonly made with respect to sulfate measurement in the analytical laboratory. However, the evidence presented here does not appear to show that absolute uncertainty stays fixed as the concentration increases rather that it scales in proportion. Hence, these data combined with the ESWET et al. report would seem to imply that run times would have to be increased by a quite a significant margin and that more work is needed to determine whether the length of time needed would actually remain practical.
The authors stress that the above evidence is not presented to advocate the community moving away from the SRM and more broadly adopting alternative methods based on portable instrumental techniques. Rather, that more work is needed to understand the limitations and indeed to develop such techniques for the future. As mentioned in Introduction, an alternative method can be used in place of the SRM for compliance and QAL2 calibration purposes if equivalency data produced in accordance with CEN/TS 14793 are accepted by the national regulator. The word “equivalency” is the key point here, i.e., the studies to date involving portable Fourier transform infrared (FTIR) spectroscopy, nondispersive infrared spectroscopy, infrared gas filter correlation, electrochemical cell, and ultraviolet (UV) absorption (Coleman et al. Citation2015, Citation2010) have shown evidence of “equivalence.” However, equivalent performance arguably is not enough, and what is needed is evidence of improved performance, as what is clear is that ELVs are becoming increasingly stringent. A significant change between the IED and the seven directives it replaced is that now Best Available Technique Reference (BREF) documents are adopted. As BREF documents are adopted under Article 13(1) of the IED, the associated emission levels (AELs) they stipulate now have a legal meaning and are enforceable. For some processes, AELs are particularly low for SO2, e.g., the Large Combustion Plants BREF (EC Citation2017) stipulates an AEL range of 8–70 mg·m0−3 for biomass plants, so some very low limits are expected in the future. Hence, it is important for the community to reassess the tools in its capability (both SRM and alternative methods) to better understand what is realistically enforceable and better direct future research efforts to meet the increasingly stringent emission limits on the horizon.
Conclusion
In blind testing of five UK analytical laboratories ISO/IEC 17025 accredited for the measurement of sulfate in H2O2(aq), some significant deviations were found in the context of the maximum permissible uncertainty requirements of the EU’s Industrial Emissions Directive. For the synthetic samples, it was found that in 35% of the measurements (2–10 mg·m0−3 range) the stated uncertainties did not interest with the mean, whereas the analogous value for the real samples was 28% (10–290 mg·m0−3 range). In addition, the latter also showed that in ~30% of the 46 different concentration test levels the stated uncertainties of at least two of the laboratories did not intersect, this providing evidence of an underestimation of measurement uncertainties by one or more of the analytical laboratories included in the study. The deviations across all the concentrations evidenced that the absolute uncertainty was scaling as a function of concentration (i.e., the relative uncertainty remained fixed) before this broke down at the sub-10 mg·m0−3 level. Hence, analytical laboratories may need to look more closely at what uncertainties should be quoted at low levels. Across a measurement range of the real samples applicable to waste incineration processes (10–75 mg·m0−3), it was found that if typical uncertainties were assumed for extraction and collection of SO2 from the stack, a stack testing organization following EN 14791 for compliance monitoring would be likely to comply with the IED maximum permissible uncertainty, as only 3% of the measurements fell beyond this limit (commensurate with a 95% level of confidence). However, if examined across the same range and with respect to the calibration of AMSs, then 38.5% of measurements were in excess of the uncertainty recommended by at least one national regulator as being necessary for EN 14791 to be an “effective tool” for the calibration of AMSs. From these data and other reports in the literature, it is clear that the emissions community may have issues in enforcing increasingly stringent emission limits. More work is needed to better characterize the real-world uncertainty that is possible with the community’s current capability, including both the SRM and proposed alternative methods based on portable instruments. This is needed so that the community can determine what can be enforced from the emission limits stipulated in the EU’s IED and the BREF documents it adopts, ensuring that the measurement data are robust and defendable.
Acknowledgment
The authors thank Sonya Beccaceci for assistance in preparation of the synthetic sulfate samples.
Additional information
Funding
Notes on contributors
Marc D. Coleman
Marc D. Coleman, Matthew Ellison, Rod A. Robinson, and Thomas O.M. Smith are all metrologists working in the Emissions and Atmospheric Metrology Group at the UK‘s National Metrology Institute (the “National Physical Laboratory”).
References
- Coleman, M. D., S. Render, C. Dimopoulos, A. Lilley, R. A. Robinson, T. O. M. Smith, R. Camm, and R. Standring. 2015. Testing equivalency of an alternative method based on portable FTIR to the european standard reference methods for monitoring emissions to air of CO, NOx, SO2, HCl, and H2O. J. Air Waste Manag. Assoc. 65 (8):1011–19.
- Coleman, M. D., R. A. Robinson, M. B. Williams, M. J. Clack, and D. M. Butterfield. 2013. State of UK emissions monitoring of stacks and flues: An evaluation of proficiency testing data for SO2, NO and particulates. Accred. Qual. Assur. 18:517–24. doi:10.1007/s00769-013-1011-x.
- Coleman, M. D., R. A. Robinson, M. Williams, R. Elliott, M. Clack, and A. Curtis. 2010. Demonstrating equivalence of an alternative method for SO2 emissions monitoring using NPL’s stack simulator facility. PPChem. 12 (4):218.
- Comité Européen de Normalisation. 2005a. Stationary source emissions – determination of mass concentration of sulphur dioxide – reference method. EN 14791. http://www.cen.eu/
- Comité Européen de Normalisation. 2005b. Stationary source emission – intralaboratory validation procedure for an alternative method compared to a reference method. CEN/TS 14793. http://www.cen.eu/.
- Comité Européen de Normalisation. 2007. Air quality – certification of automated measuring systems. EN 15267–3. http://www.cen.eu/.
- Comité Européen de Normalisation. 2014. Stationary source emissions – quality assurance of automated measuring systems. EN 14181. http://www.cen.eu/
- Environment Agency for England. 2012a. Personnel competency standard for manual stack emission monitoring. version 8.1 http://www.gov.uk/
- Environment Agency for England. 2012b. Technical guidance note m22, measuring stack gas emissions using FTIR instruments. version 3 . http://www.gov.uk/
- Environment Agency for England. 2015. Technical guidance note M20, Quality assurance of continuous emission monitoring systems - application of EN 14181 and BS EN 13284–2. version 3. http://www.gov.uk/
- European Commission. 2000. Directive 2000/76/EC of the European parliament and of the council of 4 December 2000 on the incineration of waste. Off. J. Eur. Commun L332: 91–111.
- European Commission. 2001a. Directive 2001/81/EC of the European parliament and of the council of 23 October 2001 on national emission ceilings for certain atmospheric pollutants. Off. J. Eur. Commun L309: 22–30.
- European Commission. 2001b. Directive 2001/80/EC of the european parliament and of the council of 23 october 2001 on the limitation of emissions of certain pollutants into the air from large combustion plants. Off. J. Eur. Commun L309: 1–21. http://www.gov.uk/
- European Commission. 2006. Regulation (EC) No 166/2006 of the european parliament and of the council of 18th January 2006 concerning the establishment of a european pollutant release and transfer register and amending council directives 91/689/EEC and 96/61/EC. Off. J. Eur. Union L33: 1–17.
- European Commission. 2010. Directive 2010/75/EU of the european parliament and of the council of 24 November 2010 on industrial emissions (integrated pollution prevention and control). Off. J. Eur. Commun L334: 17–119.
- European Commission. 2017. Best Available Techniques (BAT) reference document for large combustion plants. http://eippcb.jrc.ec.europa.eu/reference/
- European Suppliers of Waste-to-Energy Technology (ESWET), Confederation of European Waste-to-Energy Plants (CEWEP), European Federation of Waste Management and Environmental Services (FEAD). 2016. Study on AMS and SRM performances and their impact on the feasibility of lowering ELVs for air emissions in the context of the BREFs and BATs revision and of BAT AELs elaboration according to the IED. 22nd July. Brussels, Belgium: FEAD.
- International Organization for Standardization. 2005. General requirements for the competence of testing and calibration laboratories. ISO/IEC 17025. http://www.iso.org/
- International Organization for Standardization. 2010. Conformity assessment — general requirements for proficiency testing. ISO/IEC 17043. http://www.iso.org/
- United Nations. 2003, May 21. Protocol on pollutant release and transfer registers. Kiev, Ukraine: UN.
- United Nations Economic Commission for Europe. 1979. Convention on long-range transboundary air pollution. Geneva, Switzerland: UNECE.
- United Nations Economic Commission for Europe. 1999. Protocol to abate acidification, eutrophication and ground-level ozone to the convention on long-range transboundary air pollution. Gothenburg, Sweden: UNECE.