
ABSTRACT
In May 2018, the University of Denver repeated on-road optical remote sensing measurements at two locations in Lynwood, CA. Lynwood area vehicle tailpipe emissions were first surveyed in 1989 and 1991 because the area suffered from a large number of carbon monoxide (CO) air quality violations. These new measurements allow for the estimation of fuel-specific CO and total hydrocarbon (HC) emissions reductions, changes in the longevity of emission-control components, and the prevalence of high emitters in the current fleet. Since 1989 CO emissions decreased approximately factors of 10 (120 ± 8 to 12.3 ± 0.2 gCO/kg of fuel) and 20 (210 ± 8 to 10.4 ± 0.4 gCO/kg of fuel) at our I-710/Imperial Highway and Long Beach Blvd. sites, respectively. These reductions are also reflected in the local ambient air measurements. Tailpipe HC emissions have decreased by a factor of 25 (50 ± 4 to 2.1 ± 0.3 gHC/kg of fuel) since 1991 at the Long Beach Blvd. location. The decreases are so dramatic that the vast majority of vehicles now have HC measurements that are indistinguishable from zero. The decreases have increased the skewedness of the emissions distribution with the 99th percentile now responsible for more than 37% (CO) and 28% (HC) of the totals. Ammonia emissions collected in 2018 at both Lynwood locations peak with 20-year-old vehicles (1998 models), indicating long lifetimes for catalytic converters.
In 1989 and 1991, the on-road Lynwood fleets had significantly higher emissions than fleets observed in other locations within the South Coast Air Basin. The 2018 fleets now have means and emissions by model year that are consistent with those observed at other sites in Los Angeles and the U.S. This indicates that modern vehicle combustion management and after-treatment systems are achieving their goals regardless of community income levels.
Implications: Recent on-road vehicle emission measurements at two locations in the Lynwood, CA area, first visited in 1989, found significant fuel specific CO and HC emission reductions. CO emissions have decreased by a factor of 10 and 20 at each location and HC emissions have declined by a factor of 25. This has increased the skewedness in both species emissions distribution. The 2018 fleets have means and emissions by model year that are now consistent with those observed at other U.S. sites indicating that modern vehicle emissions control advancements are achieving their goals regardless of community income levels.
Introduction
The burning of carbon-based fuels can result in the emissions of a number of unwanted constituents, such as carbon monoxide (CO), particulate matter (PM), volatile organic hydrocarbons (VOCs) and oxides of nitrogen (NOx ≡ NO + NO2), which can directly or indirectly impact human health. As a result, the United States (U.S.) has made a concerted effort to regulate emissions of many of these substances by establishing National Ambient Air Quality Standards (NAAQS) and regulations to limit the public’s exposure (U. S. Environmental Protection Agency Citation2018). While CO and PM have been targeted because their direct emissions have significant health effects, vehicle VOCs and NOx emissions are limited due to their importance in the photochemical production of ground-level ozone (Di et al. Citation2017; Jerrett et al. Citation2009; Stedman Citation2004).
A. J. Haagen-Smit was the first to associate automobile exhaust with the irritating and hazy skies that were becoming a part of the growing metropolitan post-war Los Angeles, CA (Haagen-Smit, Bradley, and Fox Citation1953; Haagen-Smit and Fox Citation1954). The hourly averaged ozone concentrations that exceeded 500 ppb levels in the South Coast Air Basin at that time have slowly but steadily declined to where the basin design value for the 8-hr ozone NAAQS has been reduced to ~100 ppb (Parrish et al. Citation2017). Significant reductions of ambient VOC and NOx concentrations, by factors of 50 and 4 since 1960, have been major contributors (Pollack et al. Citation2013; Warneke et al. Citation2012). However, the downward trend in ozone levels has slowed since 2010; and with the recent revision of the 8-hr NAAQS for ozone from 75 ppb to 70 ppb, compliance is still predicted to be decades into the future (Fujita et al. Citation2016; Parrish et al. Citation2017; U. S. Environmental Protection Agency Citation2015).
In 1987 as part of the Southern California Air Quality Study, a small amount of research funds were allocated to measure vehicle emissions in a Van Nuys, CA tunnel to compare with the State of California’s then current mobile source computer model EMFAC7C (Ingalls, Smith, and Kirksey Citation1989). Tunnel measurements provide a way to determine vehicle emissions in their gram/mile certification standards, allowing direct comparisons to the model predictions. The tunnel measurements found that CO, HC, and NOx emission factors were 1.1 to 3.6, 1.4 to 6.9 and 0.6 to 1.4 times the emission factors estimated by the computer model. These results were met with considerable disbelief and questions were raised for both the experiment and the model (Pierson, Gertler, and Bradow Citation1990).
In December 1989, the University of Denver, under contract with the California Air Resources Board (CARB), brought the first vehicle exhaust remote sensor capable of measuring tailpipe CO/carbon dioxide (CO2) ratios to survey vehicle emissions in the South Coast Air Basin (Bishop et al. Citation1989). As part of that first Los Angeles campaign, measurements were collected at four locations in the Lynwood, CA area and at two other sites within the Basin (Lawson et al. Citation1990; Stedman et al. Citation1991). Lynwood was selected because an air quality sensor with a significant number of basin violations for CO was located on Long Beach Blvd. in Lynwood. The remote sensing emission measurements indicated that a minority of high emitting in-use vehicles were responsible for a majority of the observed fleets CO emissions and in general supported the tunnel results. A follow-up Los Angeles measurement campaign was conducted in the summer of 1991 with a third generation instrument that added the capabilities to measure the HC/CO2 ratios in vehicle exhaust, and the Lynwood site on Long Beach Blvd. was revisited for a day of measurements (Beaton et al. Citation1995; Guenther et al. Citation1995; Stedman et al. Citation1994).
Both the 1989 and 1991 Lynwood measurements found a vehicle fleet that was higher emitting and much older than other sites visited within the Basin. Since those measurements the only reported measurements from the South Los Angeles area fleet were chased car measurements from 113 vehicles in 2010 which again showed an older and higher emitting fleet (Park et al. Citation2016). Because average fleet age can often be correlated with income, it was not too surprising that median household incomes determined using owner registration zip codes from the 1991 measurements collected on Long Beach Blvd. were found to be ~$6,000 lower than the 1989 average for Los Angeles County (~$35,000 in 1989 dollars, U.S. Census Bureau, Citation2019a). While 2017 median household income levels have improved in Lynwood ($46,000 in 2017 dollars) they have fallen farther behind the county average of $61,000 (U.S. Census Bureau, Citation2019b).
Since the late 1980s light and medium-duty vehicle emissions have experienced significant reductions across the U.S. despite average fleet age increases due to the effects of the 2008 recession and improved vehicle longevity (Bishop and Haugen, Citation2018; Bishop and Stedman Citation2014). This is in part the result of improved emissions control technology driven by more stringent standards and dramatic increases in their useful life. In the spring of 2018, the University of Denver revisited Lynwood, CA to collect a new set of in-use emission measurements from the current fleet using two of the sites previously visited in 1989 to gauge how national emission trends have translated to this south Los Angeles fleet over the past 29 years. These new data sets allow a direct comparison to be made between the past and present Lynwood area vehicle fleets.
Experimental methods
In-use vehicle tailpipe exhaust measurements were collected with a remote sensor developed at the University of Denver named Fuel Efficiency Automobile Test (FEAT). The current instrument is composed of infrared (IR) and ultraviolet (UV) light sources placed on one side of the road with a detector unit on the opposite side. Four non-dispersive lead selenide IR sensors are used for a reference channel (3.9 μm), CO (3.6 μm), CO2 (4.3 μm) and HC (3.3 μm) in combination with two dispersive UV spectrometers connected via a quartz fiber coupling. The first spectrometer collects spectra for nitric oxide (NO), sulfur dioxide (SO2) and ammonia (NH3) between 198 and 227 nm while the second records nitrogen dioxide (NO2) spectra between 430 and 450 nm. The detectors sample at 100 Hz and the equipment and methodology has been fully described in the literature (Bishop and Stedman Citation1996; Burgard et al. Citation2006a; Burgard, Bishop, and Stedman Citation2006b).
FEAT measures vehicle exhaust gases as a molar ratio to exhaust CO2 (i.e., CO/CO2, HC/CO2, NO/CO2, etc.) since the path length of the plume is never known and the ratios are constant for an individual plume. The molar ratios are converted into fuel-based emission factors of grams of pollutant per kg of fuel by the carbon balance method. This uses a carbon mass fraction for the fuel of 0.86 and a doubling of the HC/CO2 ratio to normalize the reading with a flame ionization detector and compensate for the weak IR absorbance of many aromatic compounds (Burgard et al. Citation2006a; Singer et al. Citation1998). Each measured species ratio is scaled using certified gas cylinder ratios measured daily as needed at each site by FEAT. This corrects for variations in instrument sensitivity and most importantly ambient CO2 levels caused by changes in atmospheric pressure, temperature, and background pollutants. Three cylinders (certified to ± 2% accuracy) used with the current system contain: (a) 6% CO, 0.6% propane, 6% CO2 and 0.3% NO, balance nitrogen; (b) 0.05% NO2 and 15% CO2, balance air (Praxair, Salt Lake City, UT) and c) 0.1% NH3 and 0.6% propane, balance nitrogen (Airgas, Denver CO). Since fuel sulfur has been reduced to very low levels in U.S. motor fuels, the SO2 channel was not calibrated for these measurements and the data are not included in this analysis.
Speed and acceleration measurements are attempted on each vehicle using a pair of parallel IR beams (Banner Engineering) 1.8 m apart and approximately 0.66 m above the roadway. Each measurement includes a video image of the license plate of the vehicle that is manually transcribed and used to retrieve non-personal vehicle information from the California registration records. Registration information included make, model year, vehicle identification number (VIN) and fuel type. This information was combined with the emission measurements into a single database for analysis.
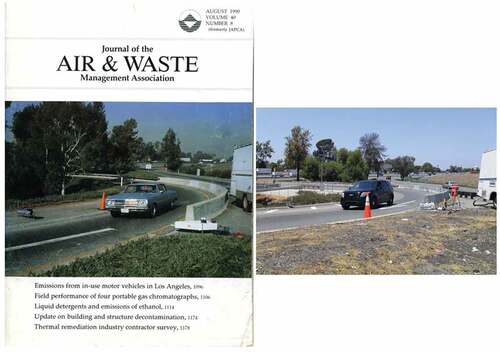
In the spring of 2018, 29 years after the first measurements in Lynwood, CA, we returned to collect similar measurements at these two sites. The southbound Long Beach Blvd. site near Norton Ave was originally two lanes with generous shoulders in 1989 and 1991 but in 2018 had been enlarged to three lanes with a large concrete planter between the south and northbound lanes, leaving no shoulder room for a safe remote sensing installation. To monitor Long Beach Blvd., we relocated to the on-ramp from southbound Long Beach Blvd. to eastbound I-105 (not yet constructed in 1991), which was 6 or 7 blocks south of the original site. This is a two-lane on-ramp with the outside lane designated as a High Occupancy Vehicle lane. Measurements were collected across both lanes but only successful emission measurements from the inside lane, where the majority of vehicles traveled, included a license plate image. After plate transcription, the digital images for all of the valid measurements were reviewed and any measurements suspected of having a coincident vehicle in the outside lane were eliminated from the database. The off-ramp from northbound I-710 to westbound Imperial Highway was relatively unchanged from 1989 (see ) allowing measurements to be collected in the identical location. Figure S1 in the supplemental material is a satellite image of Lynwood indicating the locations of the 1989, 1991 and the 2018 measurement sites.
Figure 1. August 1990 Cover of the Journal of the Air & Waste Management Association showing the 1989 FEAT 1 setup on the northbound I-710 off-ramp to westbound Imperial Highway (left) and the same location used in 2018 with the current FEAT instrument setup for measurements (right).
Results
Measurements were collected Monday, May 7 through Wednesday, May 9, 2018 between the hours of 8:00 a.m. and 5:30 p.m. on the on-ramp from southbound Long Beach Blvd. to eastbound I-105 (Figures S2 and S3 in the supplemental material). This was followed with three additional days of measurements collected Thursday, May 10 to Saturday, May 12, 2018 during similar hours on the off-ramp from northbound I-710 to westbound Imperial Highway ( and S4). Transcribed California license plates were submitted to the CARB for matching against registration records for all non-personal vehicle information. These databases, as well as others compiled by the University of Denver, are available at www.feat.biochem.du.edu.
contains a historical summary for the Lynwood in-use measurements with sampling dates, sampling metrics, mean model year, estimated mean fleet age, mean fuel-based emission factors with standard error of the mean uncertainties, percent contribution by the 99th percentile, mean vehicle specific power (VSP) and measured speed and acceleration for light and medium-duty vehicles. Speed and acceleration were not measured in our early data sets, and only the 2018 data set includes these values. Fleet age has been estimated assuming that the new vehicle model year begins in September. Vehicle specific power has been calculated using the equation from Jimenez et al. (Jimenez et al. Citation1999). The 2018 HC means have had their zero emissions normalized to the lowest HC emitting sub-fleet (a specific make and/or model year) to minimize site-specific systematic offsets that arise from thermal created detector offsets (see supplemental material). The standard error of the mean uncertainties is determined from the daily means for the multi-day measurements (see supplemental material for this process and an estimation of the in-use instrument noise). For the single day measurements in 1989 at the I-710 off-ramp and the 1991 measurements on Long Beach Blvd., resampling statistics were used to estimate the standard error of the mean.
Table 1. Mean emission comparisons by site for the 1989, 1991, and 2018 Lynwood, CA, measurements.
Mean CO emission factors show decreases of approximately factors of 10 and 20 at the I-710 and Long Beach Blvd. sites, respectively. HC emission factors show decreases of a factor of 25 from the 1991 Long Beach Blvd. measurements. CARB mobile source emission inventory estimates for CO and reactive organic gases for the South Coast Air Basin show similar decreases with an approximate order of magnitude reduction for both species over the same period (California Air Resources Board Citation1999, Citation2019a).
Average fleet age has changed little along Long Beach Blvd. but the characteristics of the age distribution are different for the two campaigns, as shown in . Zero year vehicles are 1990 and 2018 for the respective data sets and the differences in the zero year vehicle contributions are due to the later collection date of the 2018 measurements (see ). Eleven- and twelve-year old vehicles (1978 and 1979 models) represent the two largest contributors to the 1989 fleet and the trough at ~7-year-old vehicles likely reflects the impact of the 1981 recession. The largest contributors to the 2018 fleet distributions are 1- to 3-year-old vehicles (2017–2015), while the 7-to 9-year-old vehicles show the effects of the 2008 recession (Bishop and Stedman Citation2014). This shift to newer vehicles in 2018 is balanced with more 15-year-old (2003), and older vehicles showing the longevity of today’s vehicle fleet.
Figure 2. Fleet percentage vs.vehicle age in years for the 1989 Long Beach Blvd. (filled bars) and 2018 Long Beach Blvd./I-105 (open bars) measurements. The 25-year-old category includes 25-year-old and older vehicles, and zero year vehicles are 1990 and 2018 models, respectively.
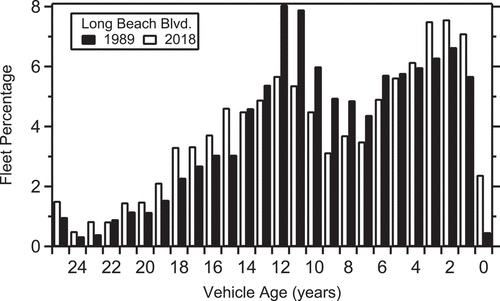
The fleet observed at the I-710 off-ramp site in 1989 was younger than the fleet observed along Long Beach Blvd. and while there is a peak in the percentage of 11and 12-year-old vehicles, 1 to 6-year-old vehicles were the dominate ages (see Figure S6 in the supplemental material). The increase in average fleet age at the I-710 off-ramp in 2018 (7.4–10.3 years, see ) includes a necessarily larger shift to older vehicles. The result is that unlike in 1989, the I-710 age distribution in 2018 is now similar to the one observed along Long Beach Blvd (see Figure S7 in the supplemental material).
While the average fleet ages were similar between 1989 (9.7) and 2018 (10.1) Long Beach Blvd. measurements, it is important to recognize that vehicle technology has changed dramatically. The 1989 and 1991 California fleets still had large numbers of carbureted and oxidation catalytic converter-equipped vehicles. Fuel injected (throttle and port) vehicles with early generation 3-way catalytic converters likely represent less than a quarter of the fleet with 1986 and newer vehicles (pre-Low Emission Vehicle (LEV) standards) accounting for only 25% and 30% of the 1989 and 1991 measurements, respectively. In 2018, half of the fleet is 2009 models and newer (LEV II certified) with >96% newer than 1995 models (LEV I certified) indicating some type of computer-controlled fuel injection (DieselNet Citation2018).
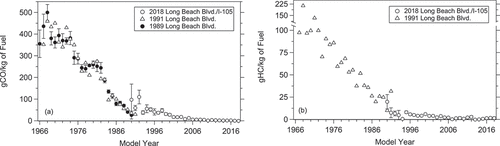
is a graph of the mean fuel specific CO (a) and HC (b, split y-axis) emissions by model year for 1989 (●), 1991 (△) and 2018 (○) measurements collected along Long Beach Blvd. The uncertainties plotted are the standard error of the mean calculated from the daily means for the multi-day measurements. Both the CO and HC measurements from 1989 and 1991 show steep emission increases from the earliest model years with good agreement between the 1989 and repeat 1991 CO measurements. In contrast, the 2018 measurements show little increase in average emissions at this scale until approximately 15- to 17-year-old vehicles (2002–2004 model years) depending on the species. Even after all of the 29 model years have been plotted, the few remaining 1990 model year vehicles emissions (only 13 CO and 12 HC measurements) have average emissions comparable to 3- to 6-year-old vehicles measured in 1989 and 1991.
Figure 3. (a) Fuel specific CO and (b) HC (split y-axis) emissions by model year for the 1989, 1991 and 2018 Long Beach Blvd. measurements in Lynwood, CA. Uncertainties for the 1989 and 2018 measurements are the standard error of the mean calculated using the daily means.
shows that the observed emission distributions in 2018 have become more skewed for both CO and HC. The percent of CO emissions that the 99th percentile is responsible for has grown significantly from less than 6% of the total to more than 37%. For HC, it has grown similarly from 9% of the total in 1991 to 28–30% in 2018. The changes in the shape of the emissions distributions are shown in using a normal probability plot. The left panel compares the fuel specific CO emissions for the 1989 (▲) and 2018 (●) I-710 off-ramp measurements against the percent of data. The right panel compares the emission distributions for the fuel specific HC emissions along Long Beach Blvd. for the 1991 (▲) and 2018 (●) measurements. These plots represent the probability that a vehicle emission measurement in the database will have a CO or HC emission rate that is less than or equal to the value on the y-axis. If the underlying data were from a normal distribution, the data would plot as a straight diagonal line. Negative values are the result of normally distributed instrument noise for a zero ratio measurement. The open symbols are the means for each distribution.
Figure 4. (a) Normal probability plots comparing the fuel specific CO emission distributions for the 1989 (▲) and 2018 (●) I-710 off-ramp measurements and (b) the fuel specific HC emission distributions for the 1991 (▲) and 2018 (●) Long Beach Blvd. measurements (b). Open symbols are the respective means for each distribution.
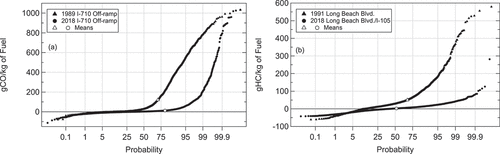
The large reductions in CO emission factors observed between the 1989 and 2018 data collected at the I-710 off-ramp have shifted all but the highest emission measurements to higher probabilities. This has increased the “emissions” weight found in the long tail of the distribution, as shown by the percent of emissions contributed by the 99th percentile. However, for CO the worst of the worst emitters in 2018 still converge with the 1989 measurements slightly above 1000 gCO/kg of fuel at the very top of the distribution (above the 99.9th percentage). However, the age of the vehicles at the top of the 2018 distribution is markedly older. The average age for the vehicles at or above the 99th probability for the 1989 I-710 off-ramp fleet was 11.5 (1978.8) years old, while it is 23.8 (1994.9) years old in 2018, or more than double. The change between the two distributions, as a percent of the 1989 CO values, is a reasonably constant 92% reduction in fuel specific CO between the 40th and the 95th percent levels. Above the 95th percent level, the distributions slowly converge reducing the percentage reduction. For example, there is a factor of 4 reduction in the 1989 CO emissions at the 99th percent level that decreases to only 20% at the 99.9th percent level. The comparison between the 1989 and 2018 Long Beach Blvd. CO distributions are similar (see supplemental material Figure S8).
The 2018 HC emissions show large reductions across the entire distribution, even for emissions beyond the 99.9th percent line (see , right panel). Mean HC emissions for the 2018 measurements continue to move toward the median and not until approximately the 95th percent level do the emissions begin to increase significantly. The vast majority of vehicles in the Lynwood area in 2018 have on-road HC emissions that are now indistinguishable from zero. The dramatic reductions at the top of the HC distribution reflect the huge improvements in emissions control and reliability in the current Lynwood fleet. The few failure modes for high HC emissions that still exist now appear to be expressed differently in the fleet, as the average age of the few vehicles above the 99th percent level is now newer than found in 1991, 10.4 (~2008) versus 14.8 (~1977) years old.
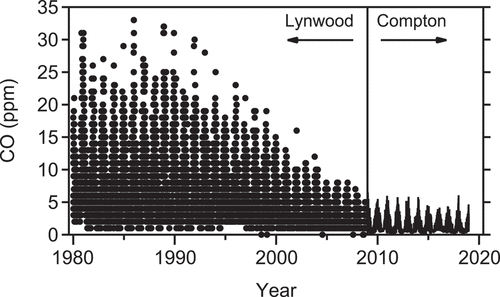
The South Coast Air Quality Management District operated an air monitoring station in Lynwood near the intersection of Long Beach Blvd. and the Imperial Highway until late 2008 (about 2 blocks north of the 2018 I-105 sampling site). In 2009, the station was moved further south to Compton (see Figure S1). CO emission measurements obtained from these two sites supports the large reductions in tailpipe CO emissions observed (California Air Resources Board Citation2019b). is a time series of daily 1-hr maximum CO measurements collected by the Lynwood station (●) between 1980 and 2008 and then from the Compton station (–) between 2009 and 2018. Maximum hourly CO values in Lynwood occurred in the fall and winter months of the late 1980s with a peak around 1990. Since 1990, there has been a steady decrease in the maximum hourly values, with levels today at least a factor of 6 lower. Similar CO reductions have also been observed basin wide as Pollack et al. report a factor of 3 reduction in CO through 2010 at select ground measurement sites. At their estimated −5.7 ± 0.3%/year rate of reduction, when extrapolated through 2018, would produce a factor of ~4.5 reduction in ambient CO since 1990 (Pollack et al. Citation2013).
Figure 5. Daily maximum 1-hr CO measurements collected at the South Coast AQMD Lynwood (●) and Compton (–) air quality monitoring stations. The Compton station replaced the Lynwood station beginning in 2009.
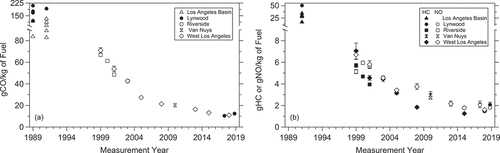
The late 1980s and early 1990s fleets measured in the Lynwood area exhibited emissions higher than other sites visited within the Los Angeles basin (Beaton et al. Citation1995; Stedman et al. Citation1994, Citation1991). The older fleet observed in Lynwood (8.8 vs. 6.8 years at other sites) was a factor in the higher mean emissions, but the fleet also had significantly higher emissions on a model year basis for all but the two newest model years, indicating causes other than age alone. plots mean fuel specific CO (a), HC and NO (b) emissions from all of the sites the University of Denver has collected from light-duty vehicles within the Los Angeles basin (Bishop and Stedman Citation2008, Citation2015). Both y-axes have been split to include the 1989 and 1991 measurements, and the 2018 Lynwood measurement years have been offset for the Long Beach Blvd. (2017.3) and I-710 (2018.8) sites to improve visibility. Uncertainties are the standard error of the mean calculated using the daily means. All three species means exhibit an exponential decay since 1999, although HC emission means have changed little since the 2008 measurements. The 2018 Lynwood means now are similar to the 2015 and 2018 measurements from the West Los Angeles site. In addition, emission levels by model year are now also similar when the Lynwood data are compared to the 2018 West Los Angeles data sets (see Figure S9 in the supplemental material).
Figure 6. (a) Fuel specific CO, (b) HC and NO means for on-road measurements collected by the University of Denver in the Los Angeles basin by measurement year. Uncertainties are the standard error of the mean calculated from the daily means. The 2018 Lynwood measurement years have been offset a half-year for the Long Beach Blvd. (2017.3) and I-710 (2018.8) sites to improve visibility.
shows fuel specific NH3 emissions by model year for Long Beach Blvd./I-105 (●), the I-710 off-ramp (○), and 2018 West Los Angeles (△) measurements. Uncertainties are the standard error of the mean calculated using the daily means. Ammonia emissions were observed to be 30% higher at the Long Beach Blvd./I-105 site than at the I-710 and Imperial Highway site (see ). The Long Beach Blvd./I-105 site has consistently higher emissions for the first 21 model years when compared to the I-710 site. However, the model year trends between these two sites are similar with a correlation plot between the two resulting in a slope of 0.96 ± 0.9 with an intercept of −0.16 (84% of the difference in the means) and an R2 of 0.86 suggesting that the Long Beach Blvd. NH3 emissions are simply offset to a higher level. The Long Beach Blvd. site’s driving mode does have a higher VSP; however, NH3 emissions on a fuel specific basis show little dependence on VSP (see Figure S10 in the supplemental material). One potentially important difference between the two locations is the upstream traffic conditions. The Long Beach Blvd. site collects traffic off of Long Beach Blvd. that is traffic light controlled at all of the major cross streets, which forces stop and go driving. The I-710 off-ramp vehicles come from the freeway via a long dedicated exit lane, and while stop and go freeway traffic is common on LA freeways it is not as regular as traffic lights. In addition, the Long Beach Blvd. measurements for the newest LEV II vehicles (2009 and newer) are similar to the mean emission levels observed at the West Los Angeles site. This site also measures vehicles that are leaving a major traffic light-controlled arterial (southbound La Brea Ave.). Dynamometer studies have shown that the hydrogen stores on catalytic converters can be increased when acceleration events are preceded by a deceleration event, which may explain the 30% difference observed between these two similar fleets (Huai et al. Citation2003).
Figure 7. Fuel specific NH3 emissions by vehicle age in years for the Lynwood Long Beach Blvd./I-105 (●), I-710 off-ramp (○) and 2018 West Los Angeles (△) measurements. Uncertainties are the standard error of the mean calculated using the daily means.
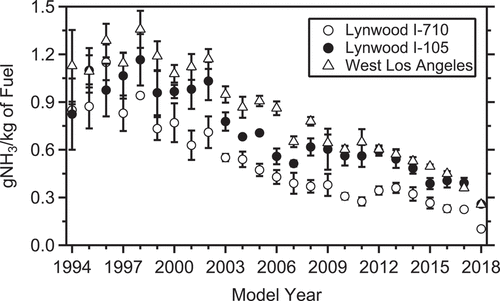
The production of exhaust NH3 results when engine-out NO emissions are reduced on a catalytic converter with available hydrogen. Its presence in the exhaust requires a functioning catalytic converter and indirectly provides a gauge to estimate converter lifetimes. Converter lifetimes have been increasing since our first NH3 measurements on Tulsa, OK and Denver, CO fleets in 2005 when peak NH3 emissions were found in 10- to 12-year-old vehicles (Burgard, Bishop, and Stedman Citation2006b). This increased to ~16-year-old vehicles in 2013 fleets, and for the 2018 Lynwood measurements shown in , peak NH3 is found to be in ~20-year-old vehicles (Bishop and Stedman Citation2015). The fact that converter lifetimes in the Lynwood area fleet are similar to those in the West Los Angeles and other U.S. fleets is another indicator of the dramatic improvements that have taken place in this South Los Angeles area fleet since 1989.
Conclusion
The University of Denver carried out three days each of remote sensing measurements at two locations in the Lynwood, CA area in May 2018, first visited in 1989 and 1991. The first site was an on-ramp from southbound Long Beach Blvd. to I-105 and the second an off-ramp from northbound I-710 to westbound Imperial Highway. CO emissions show decreases of approximately factors of 10 and 20 at the I-710 and Long Beach Blvd. sites, respectively. These reductions parallel locally observed ambient air measurements with 1-hr maximum CO levels being reduced by more than a factor of 6. HC emissions show decreases of a factor of 25 from the 1991 Long Beach Blvd. measurements. These vehicle emission measurements are also now consistent with those observed at other sites in Los Angeles and the U.S., indicating that modern vehicle combustion management and after-treatment systems are achieving their goals regardless of community income levels.
Average fleet age at the Long Beach Blvd. locations changed little between the 1989 (9.7 yr), 1991 (10.1 yr) and 2018 (10.1 yr) measurements. However, the age distribution in 2018 contains more new (2015 models and newer) and older models (2003 models and older) when compared with the 1989 distribution where 11- (1979 models) and 12- (1978 models) year old vehicles were the two most common ages. The average fleet age increased significantly at the I-710 off-ramp site, such that both Lynwood fleets measured in 2018 had a similar age and distribution.
Historical decreases in the fleet means were driven by lower vehicle emission levels found between the median and the 99th percentiles. This has significantly increased the skewedness of the distribution for both CO and HC, with the 99th percentile now responsible for more than 37% and 28% of the totals, respectively. Unlike in 1989 and 1991, when the Lynwood fleets had significantly higher emissions than other locations within the South Coast Air Basin, the 2018 fleets now have means and emissions by model year characteristics that are similar to those found at our West Los Angeles measurement site.
NH3 emissions collected in 2018 were 30% higher at the Long Beach Blvd./I-105 site when compared with the similar fleet at the I-710 off-ramp. When compared on a model year basis, the Long Beach Blvd. and I-710 measurements share similar trends, but the Long Beach Blvd. measurements are offset to a higher level. These higher levels, for the newest LEV II vehicles, are similar to those found in 2018 at the West Los Angeles site and suggest the differences between the two Lynwood sites are the result of traffic light-controlled stop-and-go driving on Long Beach Blvd. This likely increases the amount of available hydrogen in the catalyst for reduction of engine-out NO to NH3. NH3 emissions at both Lynwood locations peak with 20-year-old vehicles (1998 models) indicating catalytic converters with long lifetimes that are also consistent with those measured in other U.S. locations.
Supplemental Material
Download MS Word (35.8 MB)Acknowledgment
The author would like to acknowledge the financial support of the Coordinating Research Council (E-124) and the Real World Emissions Committee. We also thank the California Air Resources Board for permission to use the 2018 West Los Angeles data, We thank Youssef Pishdadian and Masoud Nassimi of the California Department of Transportation for permitting help, Lew Cohen for logistical support while in Los Angeles, Annette Bishop for license plate transcription, Chris Reuhl of the California Air Resources Board, Dan Burgard for helpful discussions and the University of Denver. The author would also like to acknowledge the late Dr. Donald Stedman whose ideas and inspiration made this work possible. The results and conclusions presented here are solely the responsibility of the author and may not represent the views of the sponsor.
Supplemental data
Supplemental data for this article can be accessed here.
Additional information
Funding
Notes on contributors
Gary A. Bishop
Gary A. Bishop is a Senior Research Engineer at the University of Denver, in Denver, CO.
References
- Beaton, S. P., G. A. Bishop, Y. Zhang, L. L. Ashbaugh, D. R. Lawson, and D. H. Stedman. 1995. On-road vehicle emissions: Regulations, costs and benefits. Science 268:991–93. doi:10.1126/science.268.5213.991.
- Bishop, G. A., and D. H. Stedman. 1996. Measuring the emissions of passing cars. Acc. Chem. Res. 29:489–95. doi:10.1021/ar950240x.
- Bishop, G. A., and D. H. Stedman. 2008. A decade of on-road emissions measurements. Environ. Sci. Technol. 42:1651–56.
- Bishop, G. A., and D. H. Stedman. 2014. The recession of 2008 and it impact on light-duty vehicle emissions in three western U.S. cities. Environ. Sci. Technol. 48:14822–27. doi:10.1021/es5043518.
- Bishop, G. A., and D. H. Stedman. 2015. Reactive nitrogen species emission trends in three light-/medium-duty United States fleets. Environ. Sci. Technol. 49:11234–40. doi:10.1021/acs.est.5b02392.
- Bishop, G. A., J. R. Starkey, A. Ihlenfeldt, W. J. Williams, and D. H. Stedman. 1989. IR long-path photometry, A remote sensing tool for automobile emissions. Anal. Chem. 61:671A–677A. doi:10.1021/ac00185a746.
- Bishop, G. A., and M. J. Haugen. 2018. The story of ever diminishing vehicle tailpipe emissions as observed in the Chicago, Illinois area. Environ. Sci. Technol. 52:7587–93. doi:10.1021/acs.est.8b00926.
- Burgard, D. A., G. A. Bishop, R. S. Stadtmuller, T. R. Dalton, and D. H. Stedman. 2006a. Spectroscopy applied to on-road mobile source emissions. Appl. Spectrosc. 60:135A–148A. doi:10.1366/000370206777412185.
- Burgard, D. A., G. A. Bishop, and D. H. Stedman. 2006b. Remote sensing of ammonia and sulfur dioxide from on-road light duty vehicles. Environ. Sci. Technol. 40:7018–22. doi:10.1021/es061161r.
- California Air Resources Board. 1999. The 1999 California almanac of emissions and air quality. Accessed April, 2019. https://www.arb.ca.gov/aqd/almanac/almanac99/almanac99.htm.
- California Air Resources Board. 2019a. CEPAM: 2016 SIP – Standard emission tool. Accessed April, 2019. https://www.arb.ca.gov/app/emsinv/fcemssumcat/fcemssumcat2016.php.
- California Air Resources Board. 2019b. Quality assurance air monitoring site information search. Accessed January, 2019. https://www.arb.ca.gov/qaweb/siteinfo.php.
- Di, Q., Y. Wang, A. Zanobetti, Y. Wang, P. Koutrakis, C. Choirat, F. Dominici, and J. D. Schwartz. 2017. Air pollution and mortality in the Medicare population. N. Engl. J. Med. 376:2513–22. doi:10.1056/NEJMoa1702747.
- DieselNet. 2018. Emission standards, United States, cars and light-duty trucks - California. Accessed December, 2018. https://www.dieselnet.com/standards/us/ld_ca.php.
- Fujita, E. M., D. E. Campbell, W. R. Stockwell, E. Saunders, R. Fitzgerald, and R. Perea. 2016. Projected ozone trends and changes in the ozone-precursor relationship in the South Coast Air Basin in response to varying reductions of precursor emissions. J. Air Waste Manage. Assoc. 66:201–14. doi:10.1080/10962247.2015.1106991.
- Guenther, P. L., D. H. Stedman, G. A. Bishop, J. H. Bean, and R. W. Quine. 1995. A hydrocarbon detector for the remote sensing of vehicle emissions. Rev. Sci. Instrum. 66:3024–29. doi:10.1063/1.1146498.
- Haagen-Smit, A. J., C. E. Bradley, and M. M. Fox. 1953. Ozone formation in photochemical oxidation of organic substances. Ind. Eng. Chem. 45:2086–89. doi:10.1021/ie50525a044.
- Haagen-Smit, A. J., and M. M. Fox. 1954. Photochemical ozone formation with hydrocarbons and automobile exhaust. J. Air Pollut. Control Assoc. 4:105–09.
- Huai, T., T. D. Durbin, J. W. Miller, J. T. Pisano, C. G. Sauer, S. H. Rhee, and J. M. Norbeck. 2003. Investigation of NH3 emissions from new technology vehicles as a function of vehicle operating conditions. Environ. Sci. Technol. 37:4841–47.
- Ingalls, M. N., L. R. Smith, and R. E. Kirksey. 1989. Measurements of on-road vehicle emission factors in the California South Coast air basin - Volume I: Regulated emissions. Atlanta, GA: SwRI-1604.
- Jerrett, M., R. T. Burnett, C. A. Pope, K. Ito, G. Thurston, D. Krewski, Y. Shi, E. Calle, and M. Thun. 2009. Long-term ozone exposure and mortality. N. Engl. J. Med. 360:1085–95. doi:10.1056/NEJMoa0803894.
- Jimenez, J. L., P. McClintock, G. J. McRae, D. D. Nelson, and M. S. Zahniser. 1999. Vehicle specific power: A useful parameter for remote sensing and emission studies, ninth coordinating research council on-road vehicle emissions workshop, 7–45–47–57. San Diego, CA: Coordinating Research Council, Inc.
- Lawson, D. R., P. J. Groblicki, D. H. Stedman, G. A. Bishop, and P. L. Guenther. 1990. Emissions from in-use motor vehicles in Los Angeles: A pilot study of remote sensing and the inspection and maintenance program. J. Air Waste Manage. Assoc. 40:1096–105. doi:10.1080/10473289.1990.10466754.
- Park, S. S., A. Vijayan, S. L. Mara, and J. D. Herner. 2016. Investigating the real-world emission characteristics of light-duty gasoline vehicles and their relationship to local socioeconomic conditions in three communities in Los Angeles, California. J. Air Waste Manage. Assoc. 66:1031–44. doi:10.1080/10962247.2016.1197166.
- Parrish, D. D., L. M. Young, M. H. Newman, K. C. Aikin, and T. B. Ryerson. 2017. Ozone design values in Southern California‘s air basins: Temporal evolution and U.S. background contribution. J. Geophys. Res. Atmos. 122:11,166–111,182. doi:10.1002/2016JD026329.
- Pierson, W. R., A. W. Gertler, and R. L. Bradow. 1990. Comparison of the SCAQS tunnel study with other on-road vehicle emission data. J. Air Waste Manage. Assoc. 40:1495–504. doi:10.1080/10473289.1990.10466799.
- Pollack, I. B., T. B. Ryerson, M. Trainer, J. A. Neuman, J. M. Roberts, and D. D. Parrish. 2013. Trends in ozone, its precursors, and related secondary oxidation products in los angeles, california: A synthesis of measurements from 1960 to 2010. Journal of Geophysical Research, [Atmospheres] 118:1–19. doi:10.1002/jgrd.50472.
- Singer, B. C., R. A. Harley, D. Littlejohn, J. Ho, and T. Vo. 1998. Scaling of infrared remote sensor hydrocarbon measurements for motor vehicle emission inventory calculations. Environ. Sci. Technol. 32:3241–48. doi:10.1021/es980392y.
- Stedman, D. H. 2004. Photochemical ozone formation, simplified. Eviron. Chem. 1:65–66. doi:10.1071/EN04032.
- Stedman, D. H., G. A. Bishop, J. E. Peterson, and P. L. Guenther. 1991. On-road CO remote sensing in the Los Angeles basin. Sacramento, CA: State of California Air Resources Board Research Division.
- Stedman, D. H., G. A. Bishop, S. P. Beaton, J. E. Peterson, P. L. Guenther, I. F. McVey, and Y. Zhang. 1994. On-road remote sensing of CO and HC emissions in California. Sacramento, CA: State of California Air Resources Board Research Division.
- U. S. Census Bureau. 2019a. Historical income tables: Counties. Accessed 2019. https://www.census.gov/data/tables/time-series/dec/historical-income-counties.html.
- U. S. Census Bureau. 2019b. American FactFinder. Accessed 2019. https://factfinder.census.gov/faces/nav/jsf/pages/community_facts.xhtml?src=bkmk.
- U. S. Environmental Protection Agency. 2015. National ambient air quality standards for ozone. Accessed February 2018. https://www.gpo.gov/fdsys/pkg/FR-2015-10-26/pdf/2015-26594.pdf.
- U. S. Environmental Protection Agency. 2018. National ambient air quality standards. Accessed 2018. https://www.epa.gov/criteria-air-pollutants.
- Warneke, C., J. A. de Gouw, J. S. Holloway, J. Peischl, T. B. Ryerson, E. Atlas, D. Blake, M. Trainer, and D. D. Parrish. 2012. Multiyear trends in volatile organic compounds in Los Angeles, California: Five decades of decreasing emissions. J Geophys. Res. [Atmospheres] 117:1–10.