
 ?Mathematical formulae have been encoded as MathML and are displayed in this HTML version using MathJax in order to improve their display. Uncheck the box to turn MathJax off. This feature requires Javascript. Click on a formula to zoom.
ABSTRACT
Increases in large wildfire frequency and intensity and a longer fire season in the western United States are resulting in a significant increase in air pollution, including concentrations of PM2.5 (particulate matter <2.5 µm in aerodynamic diameter) that pose significant health risks to nearby communities. During wildfires, government agencies monitor PM2.5 mass concentrations providing information and actions needed to protect affected communities; this requires continuously measuring instruments. This study assessed the performance of seven candidate instruments: (1) Met One Environmental beta attenuation monitor (EBAM), (2) Met One ES model 642 (ES642), (3) Grimm Environmental Dust Monitor 164 (EDM), (4) Thermo ADR 1500 (ADR), (5) TSI DRX model 8543 (DRX), (6) Dylos 1700 (Dylos), and (7) Purple Air II (PA-II) in comparison with a BAM 1020 (BAM) reference instrument. With the exception of the EBAM, all candidates use light scattering to determine PM2.5 mass concentrations. Our comparison study included environmental chamber and field components, with two of each candidate instrument operating next to the reference instrument. The chamber component involved 6 days of comparisons for biomass combustion emissions. The field component involved operating all instruments in an air monitoring station for 39.5 days with hourly average relative humidity (RH) ranging from 19% to 98%. Goals were to assess instrument precision and accuracy and effects of RH, elemental carbon (EC), and organic carbon (OC) concentrations. All replicate candidate instruments showed high hourly correlations (R2 ≥ 0.80) and higher daily average correlations (R2 ≥ 0.90), where all instruments correlated well (R2 ≥ 0.80) with the reference. The DRX and Purple Air overestimated PM2.5 mass concentrations by a factor of ~two. Differences between candidates and reference were more pronounced at higher PM2.5 concentrations. All optical instruments were affected by high RH and by the EC/OC ratio. Equations to convert candidate instruments data to FEM BAM type data are provided to enhance the usability of data from candidate instruments.
Implications: This study tested the performance of seven candidate PM2.5 mass concentration measuring instruments in two settings - environmental chamber and field. The instruments were tested to determine their suitability for use during biomass combustion events and the effects of RH, PM mass concentrations, and concentrations of EC and OC on their performance. The accuracy and precision of each monitor and effect of RH, PM concentration, EC and OC concentrations are varied. The data show that most of these candidate instruments are suitable for measuring PM2.5 concentration during biomass combustions with a proper correction factor for each instrument type.
Introduction to Wildfire PM2.5 Monitoring
Motivation
In the western United States, large wildfires are increasing in frequency and intensity and the fire season is growing longer (Westerling et al. Citation2006). Prescribed fires, which are used to manage wildlands and to reduce the risk of wildfires, are also increasing. Increases in frequency and intensity of fires result in a significant increase in air pollution, including concentrations of fine particulate matter (PM2.5), posing higher health risks to residents in nearby communities (Reid et al. Citation2016) and to those most vulnerable (Upton and Wheeling Citation2017). It is important to measure mass concentrations of PM2.5 on a real-time base during fire incidents to issue timely health advisories to protect public health and to better understand atmospheric processes.
Objective
The objective of this study was to identify potential candidate monitors for measuring PM2.5 mass concentrations generated during biomass combustion over the wide concentration ranges expected during wildland fires that are accurate, precise, easy to transport and setup, relatively inexpensive, and can transmit data. This was accomplished using environmental chamber and field tests.
The environmental chamber test was used to identify the effects of humidity, PM, and organic and elemental carbon concentrations on the performance of the candidate monitors under controlled conditions. The field test data were used to determine instrument precision and to compare the candidate monitors to the FEM BAM 1020 (BAM) in real-world conditions.
Comparison to the FEM BAM was used to determine accuracy. Duplicate candidate monitors were compared to each other for precision.
Regulatory environment
In 1997 the U.S. EPA established PM2.5 mass concentration standards that were revised in 2012 to make them more stringent. With these standards, the U.S. EPA also set requirements for instruments that can be used to measure ambient PM2.5 mass concentrations and approved several instruments as federal reference methods (FRM) and federal equivalent methods (FEM) to determine compliance with the ambient air quality standards (U.S. EPA Citation2013). According to the 15 December 2017 list of FRMs and FEMs (U.S. EPA/ORD Citation2017), most of the approved methods are filter-based, where particles are collected on filters, equilibrated and their mass determined in approved environmental laboratories by weighing filters before and after PM sampling. Filter-based methods are accurate and precise, but measurements are expensive, time consuming, and provide little spatiotemporal information (McMurry Citation2000). Since 2008, some automated methods have been approved as FEMs for PM2.5 mass concentration measurements. The approved automated instruments for all pollutants, other than for PM10, are acceptable for use only when operated in a shelter where the temperature is between 20°C and 30°C as prescribed in the method (U.S. EPA Citation2013).
Instrument needs
Automated or continuous measurements provide quick and higher resolution temporal PM2.5 data (Solomon and Sioutas Citation2008). These timely and high-resolution data can be used by authorities to make timely decisions to protect public health. During emergencies (e.g., wildfires) measurements should be taken near and downwind of the incident and therefore, the monitoring equipment should require no shelter and be easily transportable and installable when needed. None of the approved automated methods can be used if the incidence occurs away from monitoring stations as they require proper sheltering. Preparing the required instrument shelter in remote locations is time consuming, hence not practical in emergency situations.
Principles of optical PM monitoring
Many continuous instruments use light scattering optical methods – photometers or optical particle counters (OPC) for continuous PM measurements. Optical methods are based on the interaction of light with particles. OPCs characterize the light scattered by individual particles to estimate particle number concentrations for different particle size ranges. This is very important because for small particles (diameter d much smaller than wavelength λ, i.e., d < 0.06 λ), the particle scattering cross section is proportionally to the particle volume squared making the mass scattering efficiency proportional to the particle volume or mass (Moosmüller and Sorensen Citation2018a, Citation2018b). Therefore, total scattering is a poor indicator for mass concentration unless it is measured as function of particle size. Particle number is converted to PM mass using particle size distribution and assumptions for particle mass density and shape. Photometers measure PM mass based on light scattering by an ensemble of particles present in the optical detection volume. Based on the signal intensity, PM mass concentration is determined. Most commercial light scattering instruments use wavelengths of ~600 nm (Hinds Citation1999; Giechaskiel et al. Citation2014).
Evaluation of optical PM monitoring instruments
Some optical PM instruments – Environmental Dust Monitor (EDM) (Grimm and Eatough Citation2009), Purple Air (SCAQMD, Citation2017), and Dylos (Carvlin et al., Citation2017) use OPCs to determine PM number concentrations. EDM and Purple Air convert PM number concentrations (m−3) to PM mass concentrations (µg/m3) using pre-established conversion factors while the Dylos outputs only PM number concentrations. The interactions of light with PM and the relation of that interaction to PM mass concentration depends on particle size, shape, mass density, optical properties, and composition (Wallace et al. Citation2011; Yanosky, Williams, and MacIntosh Citation2002). Therefore, relationships between the outputs of real-time continuous optical instruments and standard gravimetric methods used to evaluate compliance with air quality standards need to be established.
In 2003 and 2006, the performance of several continuous PM2.5 mass monitors was characterized in an environmental chamber at the U.S. Department of Agriculture Forest Service Missoula Technology and Development Center (Trent Citation2003, Citation2006). In 2003, the performance of the Met One EBAM and ES642 and of the Thermo-Electron MIE DataRAM 4 were evaluated relative to the FRM. Three years later, the TSI DustTrak and the modified Met One EBAM and ES642 were also evaluated. During these evaluations, the chamber PM2.5 mass concentration from biomass combustion varied between 21 µg/m3 and 1706 µg/m3. The FRM vs. the modified EBAM yielded a coefficient of determination (R2) of 0.96 and a slope of 1.01 while the FRM vs. DustTrak yielded R2 of 0.96 and slope of 3.17, with the DustTrak overestimating the PM concentration by 217%. The FRM vs. ES642 yielded R2 of 0.94 and slope of 1.18. The MIE DataRam4 vs. FRM yielded R2 of 0.96 and slope of 2.45. The principle of operations for EBAM is based on attenuation of beta particles and that of the DustTrak, Thermo-Electron MIE DataRAM 4, and ES642 are based on light-scattering.
DataRAM 4
In laboratory and field experiments, Costa et al. (Citation2012) used a DataRAM 4 to measure mass concentrations of PM2.5. During laboratory biomass combustion, the average diameter of particles emitted was between 0.06 and 0.5 µm aerodynamic diameter. The highest PM concentrations were in the smallest diameter range. The smallest sizes were registered for emissions from the flaming phase of the combustion with larger sizes emitted during the smoldering phase. During the field experiment, the average diameters ranged between 0.035 and 0.26 um and again, the smallest particle sizes and largest PN concentrations were associated with the flaming phase of combustion. They reported that DataRAM 4 is an appropriate instrument for measuring PM2.5 mass concentrations.
EBAM
The EBAM uses beta attenuation for PM mass concentration measurement (Jaklevic et al. Citation1981). A recent study by Schweizer et al. (Citation2016) reported result of a comparison of co-located EBAM and FEM BAM ambient hourly and daily averaged data. The comparison was made between April and November 2006 with maximum hourly average of 93 µg/m3 and maximum daily average of 40 µg/m3 mass concentrations. The coefficient of determination (R2) of the hourly average was 0.70 while for the daily average it was 0.90. The mean difference between the EBAM and the BAM was an over prediction of PM mass concentrations by the EBAM of ~24%. Increases in RH above 40% further increased this disagreement. When considering only data for RH below 40%, R2 increased to 0.76 for the hourly and to 0.93 for the daily average. Furthermore, the hourly average data of the EBAM fluctuated more than those of the BAM. The authors recommended invalidating EBAM data when RH is greater than 40% to limit the EBAM over prediction.
EDM, FDMS, GRIMM 1.108, TSI DustTrak
Comparison of EDM model 1.107 with a filter dynamics measurement system for ambient air at Fresno and Rubidoux, California, showed good agreement in measuring total PM concentrations including semi-volatile PM. The use of a Nafion dryer allowed measurement of total PM2.5 mass concentrations without particle-bound water (Grimm and Eatough Citation2009). In a comparison of GRIMM model 1.108 and TSI Model 8520 DustTrak with Dichotomous FRM, the DustTrak overestimated PM2.5 mass concentrations while the GRIMM 1.108 EDM underestimated them (Cheng Citation2008).
Personal data RAM, TSI aerotrak OPC, TSI DustTrak DRX, personal modular impactor
Wang et al. (Citation2016) compared the performance of real-time instruments – Thermo Scientific pDR-1500 (personal data RAM), TSI Aerotrak Optical Particle Counter (OPC) model 8220, and TSI DustTrak DRX model 8534 against that of a Personal Modular Impactor (PMI) with PM2.5 size cut based on 24-hr average concentrations. The test occurred inside a high-rise residential green building with non-smoking and smoking residences. The pDR-1500 vs. PMI2.5 had R2 of 0.937 with no significant bias. Based on a 1-h average data, the OPC underestimated PM mass concentrations by a factor of 2.5 while DRX overestimated them by a factor of 2 compared to the pDR-1500. But both were correlated well with pDR; R2 = 0.936 vs. OPC and R2 = 0.863 vs. DRX. Because of the high R2 values, they recommended the use of these monitors for indoor monitoring as long as proper correction factors are applied. The ADR-1500 uses a pDR-1500 nephelometer and incorporates temperature and RH sensors to deal with positive bias during higher RH condition. The ADR-1500 was developed for ambient measurements (MIE ADR-1500 Instruction Manual Citation2010).
Emergence of low-cost monitors
In recent years the emergence of low-cost monitors (sensors) to measure criteria pollutants has attracted much attention (Kumar et al. Citation2015; Rai et al. Citation2017). These sensors are relatively cheap, small in size, easy to transport, install, and operate. Being low cost and easy to use provides opportunities for communities and citizens to monitor their local air quality and to help them to be more informed and educated on larger air quality issues (Snyder et al. Citation2013). These sensors can be used to develop affordable near-source fence line monitoring, to supplement air quality network, for source identification and characterization, and for educational purposes (U.S. EPA Citation2014). Currently, many sensors such as Purple Air, Dylos, etc. are in these markets and are being used by citizens and community members in collaboration with government agencies and academia (e.g., https://www.ivan-imperial.org/air) to collect ambient PM data. Because of their widespread and increasing use, some government agencies (e.g., SCAQMD and EPA) and academics (e.g., Carvlin et al. Citation2017; Manikonda et al. Citation2016; Sousana et al. Citation2016) have started to determine accuracy (comparability to FEMs or FRMs) and precision of these sensors and their suitability for their intended purposes.
Purple air
The Purple Air (PA) is a low-cost dual laser particle counter. Two models are available – PA-I with one PM1003 sensor and PA-II with two PMS5003 sensors. PA-II uses dual PMS5003 sensors and each sensor provides counts of suspended particles in size bins of 0.3, 1.0, 2.5, 5.0, and 10 µm. The PA measures particle count and converts it to particle mass concentration (µg m−3) using a built-in algorithm. The resulting data are posted online. During the South Coast Air Quality Management District (SCAQMD) sensors’ performance study, comparison of PA-II data with those of the Met One BAM FEM for PM2.5 resulted in R2 values of 0.93 to 0.97 for triplicated sensors (SCAQMD Citation2017). A study by the Lane Regional Air Protection Agency reported that PA-II measured PM2.5 mass concentrations ~2.5 times higher than an FEM (LRAPA Citation2018). In a study by Gupta et al. (Citation2018), comparison of PA-II to FEM BAM yielded R2 > 0.90 using hourly average concentrations. However, PA-II overestimated PM2.5 mass concentration compared to FEM BAM with higher bias with increase in concentrations. Using daily average PM2.5, PA-II consistently overestimated PM2.5 mass concentrations by 35% with values ranging between 15 and 50 µg m−3. Comparison of PA-I (PMS1003) with FRMs in ambient environment, Kelly et al. (Citation2017) reported correlation of 0.88 with gravimetric method while it overestimated concentrations and began to exhibit a non-linear response when concentrations exceed 40 µg m−3. In a similar study, Jayaratne et al. (Citation2018), PMS1003 measured 28% higher PN concentrations for fine particle size when RH% increased above 50%. The effect of RH was higher for larger particle size.
Dylos
The Dylos is a low-cost optical laser particle counter. It counts suspended particles in two bins – low (>0.5 µm) and high (>2.5 µm) size ranges. As part of a community engaged air monitoring study to generate continuous real-time ambient PM2.5 data with increased spatial resolution for Imperial County, CA, United States, Carvlin et al. (Citation2017) increased the number of existing regulatory monitors to measure PM2.5 alongside a network of modified Dylos. The modification included increasing the particle size bins from 2 to 4, using an algorithm to convert PM number to mass, adding a custom circuit board and network capabilities and integrated RH and temperature sensors. They used RH data to correct PM number concentrations before converting them to PM mass. They collocated and compared data from the modified Dylos 1700 with those from FEM BAM and FRM gravimetric filters for PM2.5 and PM10. The hourly correlation (r) of the Dylos data with the FEM BAM PM2.5 mass concentration data was 0.90. In the inter-comparison of low-cost sensors for occupational PM aerosol, Sousana et al. (Citation2016) reported that the Dylos 1700 had high precision with a low coefficient of variability (7.4%) and was highly correlated (R2 = 0.99) with a reference instrument. During the SCAQMD sensor evaluation study, Dylos data were compared to FEM BAM data for Rubidoux, CA, United States providing R2 of 0.65 to 0.85 (SCAQMD Citation2017).
CARB use of EBAMs and future instrument needs
The California Air Resources Board (CARB), the United States Department of Agriculture Forest Service (USDA-FS), and some California air districts have been using portable, real-time smoke monitors to measure PM2.5 mass concentrations. Measurements have been made primarily using the EBAM, which provides hourly average values and became the instrument of choice for wildfire smoke monitoring. Since 2006, CARB has purchased over 30 EBAMs for use during wildfire seasons. USDA-FS and a number of local air districts have also purchased several EBAMs. An EBAM has three parts in three separate boxes – EBAM box, power supply box, and a box containing telemetry and a battery that powers the system. Having three separate boxes to install and connect is cumbersome during emergency conditions, especially when multiple incidences occur within a day. Since 2006, many new instruments (some mentioned above) have made it to the market and a new comparative study of their capabilities was needed.
Materials and methods
The environmental chamber test was conducted over 6 days at the Desert Research Institute (DRI) Biomass Combustion Facility in Reno, Nevada, United States. Data generated from this test were analyzed for precision, accuracy, effect(s) of relative humidity (RH), and organic carbon/elemental carbon (OC/EC) mass concentration on monitors’ performances. The field test was conducted during the California, United States fire season (24 October to 19 December 2017) when all candidate instruments were operated next to the FEM BAM.
Instruments tested
Two each of seven candidate monitors – Met one EBAM and ES642, TSI DRX 8543 (DRX), Thermo ADR 1500 (ADR), GRIMM EDM 164 (EDM), Purple Air II (PA-II), and Dylos 1700 (Dylos) () were tested. In addition, two BAMs, one polytetrafluoroethylene (PTFE)-filter-based FRM and one quartz-filter-based URG filter sampler were used during the chamber test. Two BAMs were used as reference instruments. The samples from URG filters were analyzed for organic carbon (OC) and elemental carbon (EC) using thermo-optical analysis (Chow et al. Citation2004). During the field test, one BAM was used as a reference instrument.
Table 1. Candidate instrument features.
For the DRX and EDM, inlets provided by the manufacturers were used. The ADR, EBAM, and BAM monitors were fitted with PM2.5 sharp cut cyclone inlets. The Dylos and Purple Air are classified as low-cost sensors (<$500) with no specified flow or inlet system but use a fan for inducing sample air flow. All monitors were setup and operated according to the manufacturers’ recommended specifications.
Dylos, unlike the other particle counters (EDM and PA-II), does not have a conversion factor to convert particle number concentrations to mass concentrations. For this study, Dylos particle number concentration data were converted to mass concentrations by regressing field hourly Dylos particle number (PN) concentrations from the field data (this study) (x-axis) against BAM hourly PM2.5 mass concentrations. First linear fit was checked. The quadratic fit gave slightly higher R2 (−1E-06x2 + 0.0168x + 11.49, R2 = 0.3547) and was subsequently used to convert Dylos PN data from chamber and field tests to PM2.5 mass concentrations (Figure S1). Using the BAM data to convert Dylos number to mass and in turn comparing the Dylos to the BAM limits the strength of our Dylos evaluation.
To compare PA-II to each other and to the reference BAM, PM2.5 data from the two sensors – A and B of each PA-II were averaged. No correction factor was applied to data from both sensors.
All candidate instruments have real-time telemetry capability (except for ADR and Dylos), provided that there is Wi-Fi or other internet connection available. The EBAM uses satellite communication to send data to the required server that is on the network.
Instrument calibrations
All candidate instruments, except for EBAMs and reference BAMs, were calibrated at the factory and their calibrations were good for 1 year. For BAM and EBAMs, flow calibrations were performed per the manufacturer’s protocols. For factory calibrations, the manufacturers used different materials for DRX and ADR (NIST certified Arizona Road Dust), EDM (NIST certified mono dispersed polystyrene latex (PSL) for particle detection and dolomite for mass calculation), ES642 (NIST traceable 0.54 micron microsphere PSL), PA-II (30 PA-II at once in a chamber calibrated using vaporizer with polyethylene glycol/glycerin smoke fluid) and for EBAM and BAM (burning incense stick in a chamber). No calibration information is available for Dylos. TSI, manufacture of DRX, recommends custom calibration if instrument is used for monitoring particulates that are different than the one used at the factory.
Instrument maintenance and service
For the BAM and EBAM, established procedures were used to check and calibrate flow rates and to service the instruments. For EDM, ADR, ES642, and DRX, manufacturer’s instructions in their respective manual were used to clean and calibrate the instruments. The Dylos and PA-II were cleaned on the inside with compressed air where possible and clean cloth was used to remove any visible dirt. When instruments failed to operate, they were sent to their respective manufacturer for service. At the end of the chamber test, before the field test, instruments were cleaned and calibrated.
Chamber test
For the chamber test, all monitors were installed at the DRI biomass combustion chamber for the controlled study. The chamber is made of aluminum and measures 1.83 m width by 1.83 m length by 2.06 m high. The chamber is equipped with a dilution sampler and is attached to a metal manifold with multiple sampling ports for interfacing with different monitors. The chamber was configured in such a way that it generated open combustion PM under different humidity conditions; generated PM can be aged in an oxidation flow reactor to simulate real-world aging (Bhattarai et al. Citation2018; Sengupta et al. Citation2018). The sealed system reduces particle/gas loss, ensures flow stability and uniformity in the stack and better purifications of the dilution air. Up to 50 g of solid biomass fuels can be burned under controlled conditions of dilution and relative humidity (RH). Temperature and RH are controlled by the building HVAC system with the option of increasing RH with humidifiers placed in the chamber. The chamber can generate PM mass concentrations ranging from ambient to more than 10 mg/m3.
Near the top of the inside of the biomass chamber, an emission sample was drawn from the chamber using copper tubing to a manifold with multiple outlets. More details about the chamber can be found in Tian et al. (Citation2015), describing a close replicate of the DRI chamber. For this study, dried Jeffrey pine (Pinus jeffreyi) needles collected from the forest floor, near Truckee, CA, United States were used as biomass fuel, representative of fuels burnt in many wildland fires in the western U.S. Four ultrasonic humidifiers were used to change RH condition in the chamber. The RH inside the chamber ranged from 24% to 68% with the average of 41%. Concentrations of CO2 and CO were measured during the tests to determine the modified combustion efficiency, which was found to be 95% with a standard deviation of 3%. All monitors were connected to the various outlets of the manifold except for the Dylos and the Purple Air, which have no specific flow system but use a fan for inducing sample air flow; they were placed inside of the chamber, near its top and just below the location from where sample was drawn to the manifold. Two filter-based samplers – one FRM with PTFE filter for mass and one URG sampler with quartz filter for organic carbon (OC) and elemental carbon (EC) analysis were connected to ports of the manifold. The burn schedule was synchronized with each sampling period of the BAMs. At the start of the hour when the BAM started sampling, the burn started. When the BAM stopped sampling, around 10 min before the end of the hour, the burn chamber was flushed with outside air and opened for fuel replenishment. The connected instruments were used to monitor PM mass concentrations for about 1 hr after combustion initiation. This was repeated several times each day for 6 days to allow monitoring over a wide range of PM mass concentration and at two humidity levels – ambient and high RH conditions.
Field test
For the field test, the criteria described in the Code of Federal Regulations Title 40, Part 58 were used for proper siting (spacing from obstructions, trees, sources, and roadways, and horizontal and vertical placements) of the instruments to the maximum extent possible (U.S. EPA Citation2013).
The field study was conducted for 39.5 days (during October 24 to December 19, 2017 period) at the Weaverville, CA, United States existing air monitoring station, on top of a single-story part of the Weaverville Courthouse. Weaverville is a small northern California town with a population of less than 4,000. During November and December, the average high temperature is 11°C and the average low is 0°C. During these cold months, residential heating is mainly done with wood burning.
Fourteen instruments (seven candidates in duplicate) were deployed next to a FEM BAM, which was used as reference instrument that is permanently installed at this station. Identifying a site with an existing FEM BAM helped reduce the overall logistics needed for this study. Unlike the candidate instruments tested here, the FEM BAM 1020 (BAM) requires a shelter. The availability of enough space for 14 candidate instruments and some kind of connectivity (cellular, Wi-Fi, and/or internet) in addition to the likelihood of encountering wildland fire smoke were of the essence for selecting the Weaverville site for the field test.
Both during the chamber and field tests, all instruments (except EBAM, DRX, and ES642) were directly connected to a laptop that operates PEAQS (portable emission data acquisition system). Data from all candidate instruments were directly pulled into a spreadsheet in comma separated value (csv) format. Data from DRX and ES642 were pulled from the cloud into the same spreadsheet. Data from the EBAM and BAM were downloaded directly from the instrument.
Data validation
Basic quality assurance/quality control procedures were used for the data from the candidate and reference instruments. For candidate instruments, negative values and obvious outliers were removed. Outliers were determined based on visual assessment of scatter plots. When an instrument restarts after service, the first hour of data were removed to allow for steady-state operation. Also, when instruments indicated errors, the corresponding data were removed.
Chamber test results
Summary statistics for the chamber test results are given in . The average RH was 41% ranging between 24% and 68%. The average PM2.5 mass concentrations measured by EBAM and ADR were closer to those of the reference BAM than those of other candidate instruments. The EDM, Dylos, and ES642 PM2.5 mass concentrations were lower than those of the FEM BAM, while those of the PA-II and Dylos were higher. The differences between BAM and Dylos and PA-II PM2.5 mass concentrations were more pronounced at high PM concentrations than at low ones.
Table 2. Descriptive statistics of the chamber data.
In time series plots of the hourly averages of PM2.5 mass concentrations measured with the FEM BAMs and candidate instruments; all candidates track measurements by the BAM (). PA-II and DRX measured PM2.5 mass concentrations substantially higher than the BAM and the other candidate instruments and the EDM measured the lowest concentrations. Measurements by the EBAM, ADR, and ES642 were closer to the BAM, with the EBAM and ADR the closest. Cheng (Citation2008) and Trent (Citation2006) reported over-prediction of PM2.5 by the earlier DustTrack version of the DRX, as compared to the reference. Also, a study at Lane Regional Air Protection Agency (LRAPA Citation2018) reported that Purple Air over predicted PM2.5 by a factor of ~2.5 times compared to the reference.
Figure 1. Time series plots of PM2.5 mass concentrations measured with reference BAM and candidate instruments.
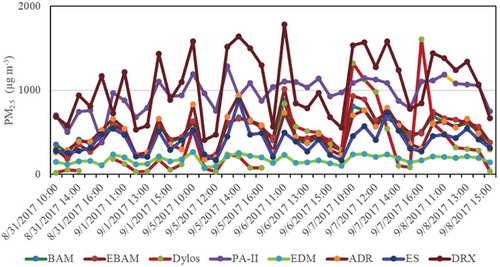
Figure S2 provides scatter plots of all candidate instruments against reference BAM measurements. The average of replicate candidates is used to compare candidates to the reference BAM for this and subsequent statistical analysis. All candidate instrument measurements tracked with BAM measurements. The variability among the candidates was higher with higher PM2.5 mass concentrations.
Based on the chamber data box plots (Figures S3), more than 75% of the measurements by the PA-II and the DRX are higher than maximum measured by the BAM, ADR, and ES642. All (100%) measurements by the EDM and Dylos are below the minimum measured by the PA-II and DRX and below 25 percentile of the BAM, EBAM, ADR, and ES642. The median measurements of the EBAM, ADR, and ES642 were closer to the median of the BAM. On the lower end, the ES642 measurements were closer to those of the BAM and on the higher end, lower than those of the BAM. The short lower whiskers indicate lesser variability at the lower end concentrations and longer whiskers at the higher concentrations suggests more variability among monitors at high concentrations. The use of Dylos-BAM regression to convert Dylos particle number to PM may have affected the findings for the BAM vs Dylos relationship.
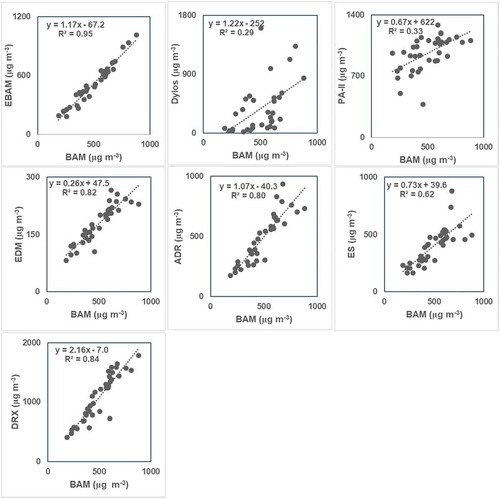
Comparisons of candidates to a reference FEM BAM using hourly average data are given in and Table S1. Except for the Dylos, PA-II, and ES642, correlation coefficients R2 for most of the candidate instruments were ≥0.8. For Dylos, PA-II, and ES642, the R2 values were 0.29, 0.33, and 0.62, respectively. EBAM is the most correlated with BAM (R2 of 0.95) followed by EDM, ADR, and DRX all with R2 of 0.8. Based on the slope of the regression equations, EBAM, Dylos, and ADR slopes were higher than 1.00, while those of PA-II, EDM, and ES642 were lower than 1.00 with the EDM having the lowest slope (= 0.26) resulting in larger intercept values.
Figure 3. Regression analysis of candidate/BAM ratios of hourly PM2.5 mass concentrations as function of RH for the chamber study.
Effect of RH on candidate instrument performance
The RH ranged from 24% to 68% in the chamber during the study. The effect of RH on candidate instrument performance was evaluated using regression analysis of candidate/BAM ratios of hourly PM2.5 mass concentrations as a function of RH ( and Table S2). shows that measured PM concentrations decreased as a function of RH for all optical instrument relative to BAM reference measurements. Table S2 shows further statistical results of the linear regression analysis of candidate/BAM ratios of hourly PM2.5 mass concentrations as a function of RH. The second column (Slope) gives, for each candidate instrument, the value of the slope and its standard error; the third column (Slope/error) gives the ratio of these two values, where a ratio larger than one indicates a significant dependence of the PM2.5 mass concentration measurement of the respective candidate instrument on RH.
Figure 4. Effect of PM mass concentrations on candidate instruments performances for the hourly chamber data.
Figure 2. Hourly accuracy of candidate instruments using regression analysis for the chamber study.
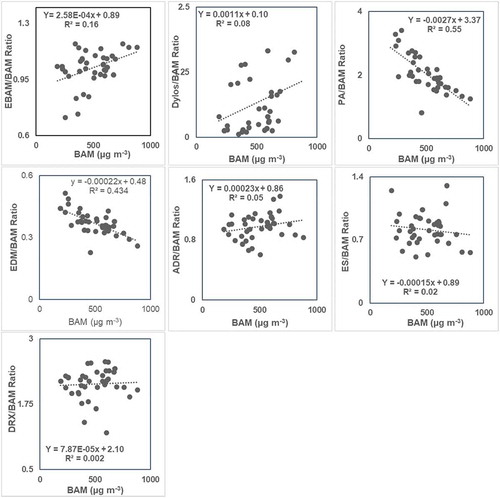
RH significantly affected measurements of PM2.5 mass concentrations as shown by higher (>1.0) absolute ratios of slope to standard error for all candidates except for PA-II. The effect of RH on PA-II is not as strong. The maximum RH in the chamber was 68% and fresh emissions from the combustion of pine needles are relatively non-hygroscopic (Petters et al. Citation2009), thereby reducing the effect of RH on instrument performances compared to more hygroscopic smokes.
Correlation of candidate instrument results during the chamber test
Minute-average and hourly average replicate correlation results are given in . All candidates, except for the EBAM, provide minute average data. Regression coefficient of determination (R2) of duplicate minute-average were 0.9 or higher, except for the Dylos, indicating strong correlation between pairs. The slope of the regression equation ranged from 0.9 to 1.1. The minute-average PN concentration data were used for comparing replicate Dylos. Regression analysis for the Dylos provided R2 of 0.55 and slope of 0.78.
Table 3. Minute and hourly average replicate instrument PM2.5 mass measurements regression analysis for the chamber data.
Hourly-average regression analysis of replicate instruments yielded R2 greater or equal to 0.9 with slopes ranging from 0.8 to 1.1. The reference BAM R2 was 0.997 with slope ranging between 0.99 and 1.02. The EBAM and the ADR had the lowest slope (0.87) compared to the other candidates. Both EBAMs had frequent tape advances (set for one advance every 24 hr or based on PM loading) with EBAM1 advancing three times and EBAM2 two times within each hour. These frequent unsynchronized tape advances may have contributed to the lower slope for the collocated EBAMs.
The effect of PM mass concentrations on instrument performance is shown in Figure 4 and Table S3 where regression plots of candidates/BAM ratios vs BAM are provided. There appears to be an effect of PM mass concentrations on all candidates (slope/std error ratio >1). However, based on the slope/standard error ratio vs RH, this may include the effect of RH ( and Table S3). PA-II, EDM, and ES642 showed strong negative relationships with PM concentrations (slope/ratios = −6.75, −5.50, or −8.82, respectively), resulting in both measuring progressively lower as PM mass concentrations increased. As shown in Table S2, ES642 showed negative slope/error ratio (−3.00) while PA-II (−0.60) and EDM (−1.20) slope/error ratios vs RH. This could be due to the highest RH in the chamber was 68%, which may not be high enough to cause considerable effect. The effect of PM mass concentration appears to be more important in affecting accurate measurement of PM mass concentrations by these instruments in the chamber. The PA-II, EDM, and ES642 appeared to be showing saturation points at higher concentrations. DRX appeared to not be affected by PM concentrations and the ADR data showed only a slight effect.
Effect of EC/OC on instrument performance
The summary of regression plots of elemental carbon/organic carbon (EC/OC) ratio to candidate/BAM PM2.5 ratio is provided in Table S4 and . Except for the EBAM and Dylos ratios, the slopes are negative and the absolute values of slopes to standard errors ratios are greater than one indicating significant influence of EC/OC ratio on candidates’ performance. The negative slopes indicate that as ratios of EC/OC increased, ratios of candidates to BAM decreased, except for EBAM and Dylos. EC is responsible for most of the light absorption and OC for most of the light scattering (Moosmüller, Chakrabarty, and Arnott Citation2009). With an increase in EC/OC ratio, the amount of EC increased more compared to OC. With increase in EC, there is decreased scattering per mass, which decreased PM mass concentration measurements with the optical instruments that use light scattering to determine PM mass concentrations while the PM measured by EBAM increased because it is based on beta attenuation.
Figure 5. Regression analysis of candidate/BAM ratio vs EC/OC using hourly average chamber data.
Organic carbon particles freshly emitted from smoldering combustion of wildland fuels are generally near-spherical in shape and larger in size than EC particles freshly emitted from flaming combustion. In addition, freshly emitted EC particles are non-spherical with a fractal-like morphology (Chakrabarty et al. Citation2006). Wang et al. (Citation2015) reported the effect of particle size on sensors performance depending on the wavelength of the incident radiation. So the candidate monitors’ response is affected by not only particle chemical composition (EC/OC) but also by particle size distribution.
Field data analysis
The average PM2.5 mass concentrations and RH conditions during the field test are given in . Based on the reference FEM BAM, the daily PM2.5 mass concentrations ranged from 6 to 33 µg m-3 with a mean of 17 µg m−3 and a median of 17 µg m−3. The external RH, as measured by the EBAMs, ranged from 27% to 92% with a mean of 82% and a median of 83%.
Table 4. Descriptive statistic of field data for the period of 24 October to 19 December 2017 based on daily average values.
The average PM2.5 mass concentrations measured by most candidate instruments were within ~25% of those measured by the FEM BAM (17 µg/m3) except for the PA-II and DRX, which reported concentrations 76% and 141% larger, respectively. Minimum concentrations reported by all instruments were close to each other with values ranging from 2 to 6 µg m−3 except for the Dylos of 12 µg m−3. Much higher variability was observed at high concentrations. The highest average PM2.5 mass concentrations reported by DRX, PA-II, EDM, and ADR were 2.5, 1.8, 1.2, and 1.2 times higher than those reported by the FEM BAM, respectively. The Dylos data appear to be close to the BAM. This is likely due to the quadratic fit to the BAM data that was used to convert Dylos particle number to particle mass concentration.
Figures S4 and S5 show scatter plots and box and whisker plots of the PM2.5 mass concentration for field data. The scatter plots show that instrument measurements track each other with closer values at lower daily concentrations and increased variability at higher concentrations with EBAM closer to the BAM on both ends. Based on the box plot, the median PM2.5 mass concentrations of the EBAM, Dylos, EDM, ADR, and ES642 were within 25% of the median of the FEM BAM. The median concentrations reported by the Purple Air and the DRX were ~1.5 and two times of those reported by the FEM BAM. The variability of measurements at lower concentration was less, as shown by shorter whiskers while longer whiskers indicate larger variability at higher concentrations. Purple Air and DRX show more variability in their concentration measurements than the other candidate instruments. More than 50% of measurements by DRX were larger than any measurements by the BAM, EBAM, and Dylos.
Figure S6, which is time series plots, shows that all instruments tracked each other very well. All instruments measured closer to each other at lower concentrations and the variability increased at higher concentrations.
Results characterizing the correlation of replicate candidate instrument during the field campaign are summarized in Table S5. Minute-average regression results show correlation coefficients R2 of 0.9 or higher for all instruments with the exception of the EDM (R2 = 0.81) and the ADR (R2 = 0.67). The lower R2 for the ADR may be attributed to problems with the loaner instrument that arrived directly from another field deployment. After brief testing, problems were detected and it was shipped to the manufacturer for service. Upon return, it had problem with data retrieval and another loaner arrived directly from another field deployment and also had some problems.
The hourly-average regression results show R2 of 0.8 or higher and slopes of ranging from 0.8 to 1.3 for all candidate instruments except for the DRX where the slope was 0.28. The loaner DRX had a laser problem, which was identified after the fact. The daily average regression results show R2 greater than 0.97 and slopes ranging from 0.9 to 1.3 except for the DRX.
Results of regression analysis of candidate PM2.5 mass concentration against those measured with the FEM BAM to determine candidate accuracy are given in , Figure S7, and Table S6. The highest average correlation coefficient with the hourly BAM data was achieved by the hourly ADR data (R2 = 0.83), followed by the EBAM data (R2 = 0.64). The R2 for the other candidate instruments ranged from 0.3 to 0.4. The finding of EBAM vs BAM R2 of 0.64 was similar to the finding by Schweizer, Cisneros, and Shaw (Citation2016) of R2 = 0.70.
Figure 6. Regression analysis of candidate instruments vs BAM for daily average field data.
The daily average PM2.5 mass concentrations measured by the candidate instruments correlated well with those measured by the FEM BAM with correlation coefficients R2 of 0.8 or higher for all candidate instruments. The slope of DRX vs BAM was about three and vs Purple Air was about two. For the rest of the candidate instruments, slopes ranged from 0.7 to 1.6.
Effect of PM mass concentrations on candidates’ performance is given in Table S7. All candidates measurements are affected by increase in concentrations as shown with higher than slope/error ratio for all.
Effect of RH and temperature on candidate instruments
Effects of external RH and temperature were investigated by plotting candidate/BAM PM2.5 mass concentrations as function of RH or temperature using daily average data (, Figure S8, and Table S8). Except for the Dylos, increase in RH increased candidates’ concentration measurements relative to the BAM as shown by the positive slope of the regression equations. The ratio of the slope and its respective standard error is always greater than 1, indicating the effect is significant. The EBAM/BAM concentration ratio as function of EBAM internal RH regression yielded a slope/standard error ratio of 0.7, indicating no significant effect of RH. EBAMs use internal heaters to reduce RH when it is above a certain limit, in this case set to 40%, per recommendation by Schweizer, Cisneros, and Shaw (Citation2016). Doing this reduces the effect of RH on EBAM performance. The BAM, EBAM, DRX, EDM, and ADR all use internal heaters to drive away moisture when RH is above certain limit thus minimizing the influence of RH. BAM internal RH was below 37% and EBAM RH was 45% or less for the 875 hr of testing.
Figure 7. Regression analysis of candidate/BAM ratios of daily average PM2.5 mass concentrations as function of RH for the field data.
The effect of temperature on candidate instrument performance was evaluated the same way – by plotting the ratio of candidate to BAM concentrations as function of temperature (Figure S8 and Table S8). Plots of RH and T against candidate instrument concentrations are also given in Figures S9 (a) and (b). The regression lines of these plots had negative slopes, except for the Dylos. The T vs ratio plots and the ratio of slope to its standard error show that temperature may affect PM2.5 mass concentrations measured by the candidate instruments. The daily average temperature varied between 12°C and 25°C (hourly average 7°C to 40°C), cooler in the morning and warmer in the afternoon. Based on the data, RH and T were inversely related (T(C) = −0.22(%RH) + 34, R2 = 0.5). Hence, the negative slopes are the inverse of the positive slopes for the RH plots and the effect of temperature may be indirect, through its effect on RH.
shows selected partial residual plots of hourly average difference of the reference BAM and candidate instruments on the y-axis against meteorological conditions (relative humidity, temperature, and wind speed measured by the EBAM) on the x-axis. A linear model for each of the meteorological conditions with the least squares line (dashed black line) and the locally weighted scatterplot smoothing (LOWESS) curves (red line) indicate some non-linearity in regression of these independent variables that is more significant for some of the sensors. The selected partial residual plots used in show the most linear fit (EBAM).
Figure 8. Partial residual (component plus residual) plots with locally weighted scatterplot smoothing (LOWESS) line for meteorological variables (RH, T, and WS) representing the most linear (EBAM top row), nonlinearity typical of many of the monitors (ES264 middle row), and most nonlinear (PA-II bottom row). Least squares line (dashed black line) and the locally weighted scatterplot smoothing (LOWESS) curves (red line).
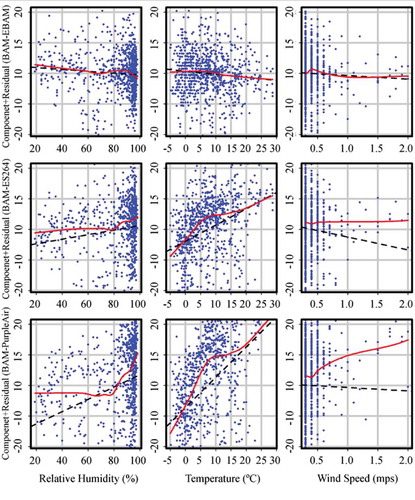
The EBAM had relatively flat fitted curves with a dip at the highest RH, but otherwise are explained by a near zero slope linear model. The effect of RH on EBAM performance has been discussed above and our findings of increased error at external RH greater than about 85% agree with Schweizer et al. Citation2016. The Dylos curves are similar to those of the EBAM. This result is likely due to the quadratic fit of Dylos data to BAM data, used to convert particle number to particle mass. Other candidate instruments largely had non-linear correlation with RH, temperature, and wind speed. Corrections for meteorological conditions will thus be difficult and require more thorough study including replicate samplers subjected to higher ambient concentrations, changing meteorological conditions, and variable sample compositions. The DRX and Purple Air, which consistently measured the two highest PM2.5 mass concentrations, have non-zero slopes over a wide range of RH. ADR and EDM have close to zero slopes with slight deviation at higher RH conditions.
Ambient temperature was relatively poor at describing the difference between the reference and test methods for the EBAM and Dylos. The other candidate instruments all appear to have some challenge with temperature particularly around 5°C. DRX and Purple Air PM2.5 mass concentration measurements, in particular, are poorly explained by linear regression but are the most impacted by temperature (see examples in ). The Dylos data, as stated above, were quadratically fitted to the BAM to convert particle number to particle mass, which likely explain the reduction in divergence at 5°C.
Statistical results of difference in hourly concentrations (BAM-candidate) as a function of RH, temperature, and wind speed are given in . The effect of RH on EBAM yielded very low slope (7 × 10⁻⁴) and R2 (3.5 × 10⁻⁶). The Dylos and EDM exhibited a similar bias with high RH with the Dylos bias particularly pronounced after what appears to be a slight underestimate compared to the reference (). The ES642 and DRX showed the opposite with a positive (candidate read higher than the BAM) bias above about 80% RH. As shown above, linear regression is not the best predictor for EDM, DRX, ES642, and PA-II but has been included to illustrate the difficulties in adjusting for meteorological conditions. The large variation in magnitude of the difference between the BAM and candidates also reduces the value of comparing R2 between candidates through the error from dependence on the covered range of the data (e.g., BAM-EBAM approximately −30 to 30 while the DRX was −200 to 30). External RH appears to be helpful (R2 = .08; p < .0001) in explaining some of the difference in the DRX below ~90% RH. While DRX (R2 = .01; p = .0009) was the next highest, the LOWESS curves and the hourly data points suggest there is a non-linear relationship.
Table 5. Difference in hourly concentrations (BAM-candidate) as a function of RH, temperature, and wind speed for the field data.
The EBAM data were the least impacted by wind speed. Linear regression suggests the ADR data (R2 = .06; p < .0001) were positively impacted (BAM-ADR difference increases with wind speed) while the Dylos data (R2 = .03; p = .02) were negatively impacted (BAM-Dylos difference decreases wind speed). The smooth curves make the linear model appear less appropriate for the candidates. To understand the effect of wind speed on candidates’ performance, further study is needed as wind speed was typically below 1.5 m/s during this study and largely at or near the 0.3 m/s, lower limit of detection of the EBAM sensor.
Air quality index and hourly and daily measurement agreement
Air quality index (AQI) comparability was assessed using 24-hr average PM2.5 data from the reference BAM and the seven candidates without applying correction factors to the original data (). Daily average PM2.5 AQI was calculated using established breakpoints from the U.S. EPA and the California Office of Environmental Health and Hazard Assessment (Lipsett et al. Citation2013). This was to compare the effectiveness and applicability of data being used in smoke advisories and rigor of association between sensors when being used during field operations to determine local health advisories. The AQI reporting system has six categories (good, moderate, unhealthy for sensitive groups, unhealthy, very unhealthy, and hazardous) with thresholds depending on a given pollutant.
Table 6. AQI determined using the reference and candidates field data based on the field data.
The relatively low daily PM2.5 mass concentrations (max = 33.3 µg m−3; min = 5.8 µg m−3 based on the reference BAM) for the study period did not allow for the wide AQI range that may be expected during wildland fire smoky days. However, the high AQIs associated with extremely high levels of smoke exposure are typically very obvious for the public, the lower levels of AQI (e.g., good, moderate, and unhealthy for sensitive), which are at the lower concentrations and are more difficult to accurately measure, are important for the public so an individual can manage their personal exposure during these times of lower smoke exposure. Moderate was the highest AQI measured at the reference BAM. The highest AQI estimated by any candidate unit was unhealthy (UH). The EBAM estimated 24-hr average AQI agreed well with the reference BAM except that there were five less days of moderate compared to the reference BAM, which is likely due to the EBAM precision/accuracy not being as good at lower PM2.5 concentrations (Zheng et al. Citation2018). Dylos over-reported the moderate level (<15 µg m−3) by 9 days and largely measured moderate for all days and did not capture the good days well; this is likely explained in part by the quadratic fit of the Dylos data to the BAM data to convert particle number to particle mass. There was an overall increase to higher AQI categories when using data from the other candidates. While the reference BAM had no days of UH or UHS, many of the candidates’ estimated higher AQI categories. The ES642 reported 2 days of UH for sensitive groups (UHS) while reporting 3 days less of moderate compared to the reference BAM. ADR and EDM have a similar response as ES642 except there are two more (i.e., four) UHS days by ADR compared to the ES642. The PA-II and the DRX measured the highest PM2.5 mass concentrations compared to the rest of the candidates ( and ), resulting in three and 12 days of UH AQI, respectively. Therefore, data generated by all the candidate instruments, except for the EBAM, should not be used to determine AQI unless proper correction factors provided below are used with the understanding that these correction factors are based on the PM sources that are dominated by biomass combustion.
Analysis of lower and upper limits of the mean differences (candidates – BAM) is given in . The two candidates that agreed well with the BAM, based on daily average data, were the EBAM (−2.9 ± 2.9 µg m−3) and the Dylos (7 ± 6.7 µg m−3). The EBAM agreement improved as the averaging time increased, which is why using the rolling or 24-h average data is recommended when determining AQI (Schweizer, Cisneros, and Shaw Citation2016). Although limited to two EBAMs, our finding is similar to the multiyear study using multiple EBAM by Schweizer, Cisneros, and Shaw (Citation2016). The other candidates’ variability was large compared to the reference BAM. The DRX performance was 24.6 ± 28.8 µg m−3 against a reference BAM, effectively encompassing the entire range of the BAM readings. The EBAM error was 17% of the median daily average found for the BAM (17.05 µg m−3), Dylos 39%, EDM 52%, ES 61%, ADR 76%, PA-II 107%, and DRX 228%. Since the cutoff for a Good AQI is 12.1 µg m−3, this certainly would pose a concern for accurate health advisories particularly for the DRX error, which includes the entire Moderate category.
Table 7. Daily and hourly upper and lower limits and mean differences for the candidate instruments for the field data.
Correction factors
The findings from this study lead to the development of post-data PM2.5 mass correction factors for the candidate instruments to maximize comparability to the reference instrument (BAM 1020) and minimize bias. The BAM used here as a reference was not tested for equivalency for particulate matters emitted during biomass combustion. Comparison of the two BAMs with gravimetric method during the chamber test (when all PM was due to biomass combustion) resulted in slopes of 0.833 and 0.832, R2 of 0.978 for both BAMs with intercept of zero for both (Figure S10).
Some of the candidate instruments (PA-II and DRX) provide simultaneous measurement of various PM fractions (PM2.5, PM10, etc.). The provided correction factors are for correction of PM2.5 mass concentration only. These correction factors are only applicable under the environmental conditions in which these instruments were tested. If an optical instrument is used for a long time under high smoky conditions, these factors may not apply as optical-based instrument performance could deteriorate under such condition. No correction factor is provided for Dylos because Dylos produces PN and conversion of PN to mass can result in different data set.
To create correction factors, generalized linear models with multiple dependent variables were used along with R2 to compare the candidates to the reference. Adding RH and T to the linear regression analysis reduced the correlations between the candidates and reference (Table S9). This could be attributed to the lower hygroscopicity of the biomass combustion products that constitute the PM2.5 fraction. Below are the correction factors to convert candidates’ data to BAM-like measurements without including RH and T.
General discussions
All candidate instruments correlated well with the reference BAM and with each other on a daily average basis but showed significant bias compared to the reference (Table S6). This could be attributed to the different working principles of these instruments and the different materials (Arizona Road dust, dolomite, mono-disperse polystyrene latex, etc.) used to calibrate them compared to the aerosols encountered during wildfire incidences.
Based on chamber and field tests, PA-II and DRX consistently measured much higher PM2.5 mass concentrations than all other instruments with their concentrations being 76% and 141% higher, respectively than those of the FEM BAM. The EDM measured lower PM2.5 mass concentrations than the FEM BAM during chamber test but its measured concentrations were within 23% of those of the FEM BAM during the field test. Cheng (Citation2008) also reported lower concentration measured with an EDM 1.108 Grimm instrument. Overestimation of PM2.5 mass concentrations by the TSI DustTrak 8533 (an earlier version) was reported by Trent (Citation2006) and Cheng (Citation2008). Wang et al. (Citation2016) also reported that the TSI DRX overestimated PM2.5 mass concentrations by about two times compared to a filter-based Personal Modular Impactor. The time series plots trends were similar during both chamber and field tests, with all instruments tracking one another. During both tests, instrument concentration measurements were closer to each other for low PM2.5 mass concentrations but their variability increased for high concentrations. The hourly average EBAM data were better correlated with the FEM BAM data during the chamber test (R2 = 0.95) compared to the hourly field test (R2 = 0.64). This was attributed to very high PM concentrations (mean = 4930 µg m−3, min = 188 µg m−3, max = 883 µg m−3, based on hourly average) during the chamber test and low PM concentrations (mean = 17 µg m−3, min 6 µg/m µg m−3, max = 33 µg m−3, based on daily average) during the field test. Lower correlations at lower PM2.5 mass concentrations were previously reported for these instruments by Schweizer, Cisneros, and Shaw (Citation2016) and Zheng et al. (Citation2018). Zheng et al. (Citation2018) concluded that the EBAM is not an ideal instrument for measuring low PM2.5 mass concentrations. Overall, among the tested monitors, the EBAM is the one that best correlated with the BAM on daily average level and whose AQI predictions were closer to those of the BAM. As a result, many agencies use EBAMs during wildfires and other emergency situations that require PM monitoring.
Effect of PM mass concentrations can be seen in Table S2 for chamber test and Table S7 for the field test. In both cases, the effect of concentration is significant as shown by slope/std error ratios. This may show the saturation points at higher PM mass concentrations. To understand this issue, the effect of very high PM concentrations on light scattering instruments (possibly extinction and multiple scattering artifacts) was checked.
At very high PM concentrations, light scattering instruments may be influenced by extinction and multiple scattering artifacts. This will be the case if the optical depth (OD; i.e., the product of extinction (mostly scattering) coefficient and optical path length in the instrument sample volume) becomes comparable to one (1). For the compact candidate instruments, the optical path is limited to less than 0.1 m and therefore the extinction coefficient would have to be 1 m−1 to achieve an OD of 0.1 where extinction and multiple scattering artifacts become significant. For a PM mass extinction efficiency of 1 m2/g, this would correspond to a PM mass concentration of 1 g/m3 = 106 μg m-3, about three orders of magnitude larger than any PM mass concentration encountered during our lab and field studies. This analysis failed to explain the concentration effect. However, there could be concentrations in which these systems would underestimate the mass.
Effects of RH on measured PM2.5 mass concentrations were observed during both chamber and field tests. During the field tests, where the mean ambient RH was 82%, the effects of high RH condition were obvious for both the light scattering and beta attenuation methods. EBAM data, at internal RH ≤ 40%, showed no effect of RH on EBAM performance (Table S8). Schweizer, Cisneros, and Shaw (Citation2016) and Kiss et al. (Citation2017) previously reported the effects of RH on EBAM performance. Schweizer, Cisneros, and Shaw (Citation2016) suggested to invalidate EBAM data for RH greater than 40%. According to Huang (Citation2007), higher PM2.5 mass concentration readings by the DustTrak, an optical, light scattering instrument, compared to a collocated EBAM were attributed to the effect of RH on the optical method. When comparing the DustTrak and EBAM data to those of a manual filter-based sampler, the DustTrak measured higher PM2.5 mass concentrations than the other two regardless of an inlet heater on the EBAM being turned on or off. The difference increased when RH was raised. The EBAM measured concentrations closer to those of the manual sampler when its inlet heater was turned on. Effect of RH on pDR (Chang-Fu et al. Citation2005) and on EDM (Grimm and Eatough Citation2009) data have also been reported. Using laboratory and field tests, Jayaratne et al. (Citation2018) reported that for measurements of particle number and particle mass concentrations using a low-cost sensor (PMS1003) at RH above 70%, the number and mass concentration (for PM larger than PM2.5) increased by 28% and more than 50%, respectively. In a similar study, Li et al. (Citation2018) reported an increase in particle number concentrations with an increase in RH and with an increase in particle number in the upper size range. According to Gu et al. (Citation2016), when RH was increased between 60% and 95%, the diameter of spherical particles increased exponentially and the refractive index decreased linearly. Effects of RH on the Dylos, a low-cost sensor, were also previously reported (EPA/600/R-14/464). Low-cost PM sensors, which use light scattering methods for PM mass concentration measurement, do not have specific PM2.5 inlet systems (use fan for air flow) and do not heat incoming air samples to reduce RH at the inlet.
Candidate instruments showed effects of EC and OC concentrations on the performance of both beta attenuation and optical light scattering methods, except the effects were opposite. When EC increased (higher EC/OC ratio), the EBAM measured higher while the optical systems measured lower. This was attributed to EC being mainly responsible for optical absorption and OC mainly for optical scattering (Moosmüller, Chakrabarty, and Arnott Citation2009). Therefore, an increase in EC fraction decreased the amount of scattered light, thereby causing decreased PM concentration measurements for light-scattering-based instruments.
The R2 of replicate candidate instruments for hourly averages during the chamber and field tests were ≥0.8. Based on daily average field data of replicate candidate instruments, the R2 were >0.970, indicating that replicate candidate instruments all correlated very well. A comparison of candidate instruments data to those of the FEM BAM daily average data, yielded R2 ≥ 0.8, indicating good correlation.
Analysis of partial residual plots of the differences between the BAM and candidates data at various RH, temperature, and wind speed conditions provided further insight into the instruments performance. The EBAM and the Dylos data had shown almost flat slope indicating less effect of RH on the instrument performance, except for a little bump of the EBAM data at RH of about 85%, which is in agreement with the findings of a multi-year EBAM evaluation by Schweizer, Cisneros, and Shaw (Citation2016). The partial residual plots for the other candidate instrument showed non-linear plots for RH, temperature, and wind speed, indicating the influence of these parameters on the candidates’ performance. The EBAM and the Dylos plots were both relatively flat. When using AQI as means to compare performance, the EBAM was the only one that agreed well with the reference BAM.
The upper and lower limits of the mean differences (candidates – BAM) of the 24-hr average data indicated that the EBAM and the Dylos were the only two instruments whose data were close to the reference BAM. The other candidate instruments showed higher variability with the Purple Air and the DRX showing the highest. The errors were (BAM daily median average = 17.05 µg/m3) EBAM, 17%, Dylos 39%, EDM 52%, ES642 61%, ADR 76%, Purple Air 107%, and DRX 228%, based on standard deviation of the mean difference.
Summary
The goal of this study was to identify instruments that can be used to measure ambient mass concentrations of PM2.5 during wildfire incidences and to distribute the data immediately to desired locations, so actions can be taken to protect public health. The overall data indicate that the EBAM compared best to the reference BAM when AQI, concentrations, RH, temperature, and wind speed were considered. The other candidates (not including Dylos) measured higher PM2.5 mass concentrations both in the chamber and field tests. On daily average base, candidates vs BAM PM2.5 mass correlated well (R2 > 0.8) but with lower correlations for hourly averages. Based on the daily average data, conversion equations are provided to convert candidates PM2.5 mass concentration to BAM-like measurements. The EBAM data have been in use during fire seasons to monitor PM2.5 mass concentrations used to provide AQI index. The EBAM, because of its long history in air quality monitoring has well-defined quality control/quality assurance requirements for its operations. The other candidates (EDM, ADR, DRX, and PA-II), because of their correlation with the reference BAM, are likely effective in providing supplemental monitoring for early warning of increased smoke in areas where wildfires are historically known to occur. This can be done by installing them and monitoring before, during, and after fire incidences to gain broader information on the effects of wildfire on air quality. PA-II, because of its low cost (<$300), can be used to provide high-resolution spatial and temporal data in areas prone to wildfire before, during, and after wildfire events. Based on the findings from this study, currently over 300 PA-II (and the number is growing) are deployed in historically wildfire-prone areas in California.
Disclaimer
The statements and conclusions in this paper are solely those of the contributors not necessarily of the California Air Resources Board, Desert Research Institute, U.S. Department of Forest Service, or Washoe County Health District.
Supplemental Material
Download PDF (959.8 KB)Acknowledgments
The authors would like to thank the following persons for their assistance: Joseph McCormack, Mark Copple, and Jamie Vandermast of CARB and Randy Deckau of North Coast Air Quality Management District. The authors would also like to thank the manufacturers – Met One Inc., Thermo Fisher Scientific, Grimm Technologies, and TSI, Inc. - for their assistance during the study. H. Moosmüller and D. E. Campbell acknowledge support from CARB (Agreement Number 16MLD061), NASA ROSES (Grant Number NNX15AI48G), and NSF (Award Number AGS-1544425).
Supplementary material
Supplemental data for this paper can be accessed on the publisher’s website.
Additional information
Funding
Notes on contributors
Ahmed Mehadi
Ahmed Mehadi is an Air Pollution Specialist at the California Air Resources Board Monitoring and Laboratory Division, Sacramento, CA.
Hans Moosmüller
Hans Moosmüller is a Research Professor, NSHE Regents’ Researcher, and the Senior Director of the Wildland Fire Science Center at the Desert Research Institute (DRI) of the Nevada System of Higher Education (NSHE).
David E. Campbell
David E. Campbell is an Associate Research Scientist at the Desert Research Institute (DRI) of the Nevada System of Higher Education (NSHE).
Walter Ham
Walter Ham is the Manager of Advanced Air Monitoring Techniques Section at the California Air Resources Board Monitoring and Laboratory Division, Sacramento, CA.
Donald Schweizer
Donald Schweizer is an Air Resource Specialist with the U.S. Forest Service, Pacific Southwest Region and an affiliate researcher with the Health Science Research Institute at the University of California, Merced.
Leland Tarnay
Leland Tarnay is an ecologist with the USDA Forest Service Pacific Southwest Region Remote Sensing Lab, focused on air pollution, fire, and forest health.
Julie Hunter
Julie Hunter is the Senior Air Quality Specialist/Smoke Management Coordinator for the Washoe County Health District, Air Quality Management Division, Reno, NV.
References
- Bhattarai, C., V. Samburova, D. Sengupta, M. Iaukea-Lum, A. C. Watts, H. Moosmüller, and A. Y. Khlystov. 2018. Physical and chemical characterization of aerosol in fresh and aged emissions from open combustion of biomass fuels. Aerosol Sci. Tech. 52 (11):1266–82. doi:10.1080/02786826.2018.1498585.
- Carvlin, G. N., H. Lugo, L. Olmedo, E. Bejarano, A. Wilkie, D. Meltzer, M. Wong, G. King, A. Northcross, M. Jerrett, P.B. English, and D. Hammond 2017. Development and field evaluation of a community-engaged particulate matter air quality monitoring network in Imperial, California, USA. J. Air Waste Manage. Assoc. 67 (12):1342–52. doi:10.1080/10962247.2017.1369471.
- Chakrabarty, R. K., H. Moosmüller, M. A. Garro, W. P. Arnott, J. W. Walker, R. A. Susott, R. E. Babbitt, C. E. Wold, E. N. Lincoln, and W. M. Hao. 2006. Emissions from the laboratory combustion of wildland fuels: Particle morphology and size. J. Geophys. Res. 111:D07204. doi:10.1029/2005JD006659.
- Chang-Fu, W., R. J. Delfino, J. N. Floro, B. S. Samimi, P. J. E. Quintana, M. T. Kleinman, and L.-J. S. Liu. 2005. Evaluation and quality control of personal nephelometers in indoor, outdoor and personal environments. J. Exposure Anal Environ. Epidemiol 15:99–110. doi:10.1038/sj.jea.7500351.
- Cheng, Y.-H. 2008. Comparison of the TSI model 8520 and Grimm series 1.108 portable aerosol instruments used to monitor particulate matter in iron foundry. J. Occupa. Environ. Hygiene 5 (3):157–68. doi:10.1080/15459620701860867.
- Chow, J. C., J. G. Watson, L.-W. A. Chen, W. P. Arnott, H. Moosmüller, and K. Fung. 2004. Equivalence of elemental carbon by thermal/optical reflectance and transmittance with different temperature protocols. Environ. Sci. Technol. 38 (16):4414–22. doi:10.1021/es034936u.
- Costa, M. A. M., J. A. Carvalho, T. G. S. Neto, E. Anselmo, B. A. Lima, L. T. U. Kura, and J. C. Santos. 2012. Real-time sampling of particulate matter smaller than 2.5 μm from Amazon forest biomass combustion. Atmos. Environ. 54:480–89. doi:10.1016/j.atmosenv.2012.02.023.
- Giechaskiel, B., M. Maricq, L. Ntziachristos, C. Dardiotis, X. Wang, H. Axmann, A. Bergmann, and W. Schindler. 2014. Review of motor vehicle particulate emissions sampling and measurement: From smoke and filter mass to particle number. J. Aerosol Sci. 67:48–86. doi:10.1016/j.jaerosci.2013.09.003.
- Grimm, H., and D. J. Eatough. 2009. Aerosol measurement: The use of optical light scattering for the determination of particulate size distribution and particulate mass including the semi-volatile fraction. J. Air Waste Mange. Assoc. 59:101–07. doi:10.3155/1047-3289.59.1.101.
- Gu, F., J. Zhang, Y. Chen, F. Cui, Y. Liu, Y. Wei, and L. Shen. 2016. The influence of relative humidity on the scattered light signal of aerosol concentration measurement system. Proc. SPIE 9684, 8th International Symposium on Advanced Optical Manufacturing and Testing Technologies: Optical Test, Measurement Technology, and Equipment, 968404, September 27. doi:10.1117/12.2243535.
- Gupta, P., P. Doraiswamy, R. Levy, O. Pikelnaya, J. Maibach, B. Feenstra, A. Polidori, F. Kiros, and K. C. Mills. 2018. Impact of California fires on local and regional air quality: The role of a low-cost sensor network and satellite observations. GeoHealth 2:172–81. doi:10.1029/2018GH000136.
- Hinds, W. C. 1999. Aerosol technology: Properties, behavior, and measurement of airborne particles. 2nd ed. Hoboken, NJ: John Wiley & Sons.
- Huang, C.-H. 2007. Field comparison of real-time PM2.5 readings from a beta gauge monitor and a light scattering method. Aerosol Air Qual. Res. 7 (2):239–50. doi:10.4209/aaqr.2007.01.0002.
- Jaklevic, J. M., R. C. Gatti, F. S. Goulding, and B. W. Loo. 1981. A beta gauge method applied to aerosol samples. Environ. Sci. Technol. 15:680–84. doi:10.1021/es00088a006.
- Jayaratne, R., X. Liu, P. Thai, M. Dunbabin, and L. Morawska. 2018. The influence of humidity on the performance of low-cost air particle mass sensors and the effect of atmospheric fog. Atmos. Meas. Tech., 11, 4883–4890, 2018. https://doi.org/10.5194/amt-11-4883-2018
- Kelly, K. E., J. Whitaker, A. Petty, C. Widmer, A. Dybwad, D. Sleeth, R. Martin, and A. Butterfield. 2017. Ambient and laboratory evaluation of a low-cost particulate matter senor. Environ. Pollut. 221:491–500. doi:10.1016/j.envpol.2016.12.039.
- Kiss, G., K. Imre, Á. Molnár, and A. Gelencsér. 2017. Bias caused by water adsorption in hourly PM measurements. Atmos. Meas. Tech. 10:2477–88. doi:10.5194/amt-10-2477-2017.
- Kumar, P., L. Morawska, C. Martani, G. Biskos, M. Neophytou, S. Di Sabatino, M. Bell, L. Norford, and R. Britter. 2015. The rise of low-cost sensing for managing air pollution in cities. Environ. Intern. 75:199–205. doi:10.1016/j.envint.2014.11.019.
- Lane Regional Air Protection Agency (LRAPA). 2018. Particulate matter sampling. Do low cost sensors fit into the picture? Lane Regional Air Protection Agency, 1010 Main Street, Springfield, OR 97477.
- Li, C.-R., H. Chih-Ning, Y.-C. Lin, M.-W. Hung, -C.-C. Yang, H.-Y. Tsai, Y.-J. Chang, K.-C. Huang, and W.-T. Hsiao. 2018. Integrating temperature, humidity, and optical aerosol sensors for a wireless module for three-dimensional space monitoring. Published in: 2018 IEEE Sensors Applications Symposium (SAS), Seoul, South Korea. doi:10.1109/SAS.2018.8336731.
- Lipsett, M., B. Materna, S. Lyon Stone, S. Therriault, R. Blaisdell, and J. Cook. 2013. Wildfire smoke: a guide for public health officials. Revised July 2008 (With 2012 AQI Values). Accessed October, 2018. http://www.arb.ca.gov/carpa/toolkit/data-to-mes/wildfiresmoke-guide.pdf.
- Manikonda, A., N. Zíková, P. K. Hopke, and A. R. Ferro. 2016. Laboratory assessment of low-cost PM monitors. J. Aerosol Sci. 102:29–40. doi:10.1016/j.jaerosci.2016.08.010.
- McMurry, P. H. 2000. A review of atmospheric aerosol measurements. Atmos. Environ. 34 (12–14):1959–99. doi:10.1016/S1352-2310(99)00455-0.
- MIE ADR-1500 Instruction Manual. 2010. Particulate monitor. Par number 108836-00. Franklin, MA: Thermo Fisher Scientific, Air Quality Instruments.
- Moosmüller, H., R. K. Chakrabarty, and W. P. Arnott. 2009. Aerosol light absorption and its measurement: A review. J. Quant. Spectrosc. Radiat. Transfer 110 (11):844–78. doi:10.1016/j.jqsrt.2009.02.035.
- Moosmüller, H., and C. M. Sorensen. 2018a. Small and large particle limits of single scattering Albedo for homogeneous, spherical particles. J. Quant. Spectrosc. Radiat. Transfer 204 (Supplement C):250–55. doi:10.1016/j.jqsrt.2017.09.029.
- Moosmüller, H., and C. M. Sorensen. 2018b. Single scattering Albedo of homogeneous, spherical particles in the transition region. J. Quant. Spectrosc. Radiat. Transfer 219:333–38. doi:10.1016/j.jqsrt.2018.08.015.
- Petters, M. D., C. M. Carrico, S. M. Kreidenweis, A. J. Prenni, P. J. DeMott, J. L. Collett, and H. Moosmüller. 2009. Cloud condensation nucleation activity of biomass burning Aerosol. J. Geophys. Res. 114 (D22205). doi: 10.1029/2009JD012353.
- Rai, A. C., P. Kumar, F. Pilla, A. N. Skouloudis, S. D. Sabatino, C. Ratti, A. Yasar, and D. Rickerby. 2017. End-user perspective of low-cost sensors for outdoor air pollution monitoring. Sci. Total Environ. 607-608:691–705. doi:10.1016/j.scitotenv.2017.06.266.
- Reid, C. E., M. Jerrett, E. B. Tager, M. L. Petersen, J. K. Mann, and J. R. Balmes. 2016. Differential respiratory health effect from the 2008 northern California wildfires: A spatiotemporal approach. Environ. Res. 150:227–35. doi:10.1016/j.envres.2016.06.012.
- Schweizer, D., R. Cisneros, and G. Shaw. 2016. A comparative analysis of temporal and permanent beta attenuation monitors: the importance of understanding data and equipment limitations when creating PM2.5 air quality health advisories. Atmos. Pollut. Res. 7:865–75. doi:10.1016/j.apr.2016.02.003.
- Sengupta, D., V. Samburova, C. Bhattarai, E. Kirillova, L. Mazzoleni, M. Iaukea-Lum, A. Watts, H. Moosmüller, and A. Khlystov. 2018. Light absorption by polar and non-polar Aerosol compounds from laboratory biomass combustion. Atmos. Chem. Phys. 18 (15):10849–67. doi:10.5194/acp-18-10849-2018.
- Snyder, E. G., T. H. Watkins, P. A. Solomon, E. D. Thoma, R. W. Williams, G. S. W. Hagler, D. Shelow, D. A. Hindin, V. J. Kilaru, and P. W. Preuss. 2013. The changing paradigm of air pollution monitoring. Environ. Sci. Technol. 47:11369–77. doi:10.1021/es4022602.
- Solomon, P. A., and C. Sioutas. 2008. Continuous and semicontinuous monitoring techniques for particulate matter mass and chemical components: A synthesis of findings from EPA’s particulate matter supersites program and related studies. J. Air Waste Manage. Assoc. 58 (2):164–95. doi:10.3155/1047-3289.58.2.164.
- Sousana, S., K. Koehlerb, G. Thomasc, J. H. Parka, M. Hillmanc, A. Haltermand, and T. M. Peters. 2016. Inter-comparison of low-cost sensors for measuring the mass concentration of occupational aerosols. Aerosol Sci. Tech. 50 (5):462–73. doi:10.1080/02786826.2016.1162901.
- South Coast Air Quality Management District. Evaluation Summary. 2017. Accessed June 11, 2018. http://www.aqmd.gov/aq-spec/evaluations/summary.
- Tian, J., J. C. Chow, J. Cao, Y. Han, H. Ni, L.-W. A. Chen, X. Wang, R. Huang, H. Moosmüller, and J. G. Watson. 2015. A biomass combustion chamber: design, evaluation, and a case study of wheat straw combustion emission tests. Aerosol Air Qual. Res. 15:2104–14. doi:10.4209/aaqr.2015.03.0167.
- Trent, A. 2003. Laboratory evaluation of real-time smoke particulate monitors. USDA Forest Service, Technology and Development Program, Missoula, MT, USA, 2500 Watershed. December 2003. 0325-2834-MTDC.
- Trent, A. 2006. Smoke particulate monitors: 2006 updates. USDA Forest Service, Technology and Development Program, Missoula, MT, USA, 2500 Watershed, Soil, and Air. December 2006, 0625-2842-MTDC.
- U.S. EPA. 2013. 40 CFR parts 50, 51, 52, 53, 58. national ambient air quality standards for particulate matter; final rule, Vol. 78, 3086–287. Washington, DC: Environmental Protection Agency.
- U.S. EPA. 2014. Air sensors guide book. Accessed August 27, 2018. https://cfpub.epa.gov/si/si_public_record_report.cfm?dirEntryId=277996.
- U.S. EPA/ORD. 2017. List of designated reference and equivalent methods. 2017. U.S. EPA Ambient Monitoring Technology Information Center (AMTIC). Accessed August 27, 2018. https://www.epa.gov/amtic/air-monitoring-methods-criteria-pollutants.
- Upton, J., and K. Wheeling. 2017. How smoke from California’s fires is harming the most vulnerable. Climate Central. Accessed June 11, 2018. http://www.climatecentral.org/news/smoke-california-wildfires-harming-most-vulnerable-21777.
- Wallace, L. A., A. J. Wheeler, J. Kearney, K. Van Ryswyk, H. You, R. H. Kulka, P. E. Rasmussen, J. R. Brook, and X. Xu. 2011. Validation of continuous particle monitors for personal, indoor, and outdoor exposures. J. Expo. Sci. Environ. Epidemiol. 21 (1):49–64. doi:10.1038/jes.2010.15.
- Wang, Y., J. Li, H. Jing, Q. Zhang, J. Jiang, and P. Biswas. 2015. Laboratory evaluation and calibration of three low-cost particle sensors for particulate matter measurement. Aerosol. Sci. Technol. 49 (11):1063–77. doi:10.1080/02786826.2015.1100710.
- Wang, Z., L. Calderón, A. P. Patton, M. S. Allacci, J. Senick, R. Wener, C. J. Andrews, and G. Mainelis. 2016. Comparison of real-time instruments and gravimetric method when measuring particulate matter in a residential building. J. Air Waste Manage. Assoc. 66 (11):1109–20. doi:10.1080/10962247.2016.1201022.
- Westerling, A. L., H. G. Hidalgo, D. R. Cayan, and T. W. Swetnam. 2006. Warming and earlier spring increase western U.S. forest wildfire activity. Science 313:940–43. doi:10.1126/science.1128834.
- Yanosky, J. D., P. L. Williams, and D. L. MacIntosh. 2002. A comparison of two direct-reading aerosol monitors with the federal reference method for PM2.5 in indoor air. Atmos. Environ. 36 (1):107–13. doi:10.1016/S1352-2310(01)00422-8.
- Zheng, T., M. H. Bergin, K. K. Johnson, S. N. Tripathi, S. Shirodkar, M. S. Landis, R. Sutaria, and D. E. Carlson. 2018. Field evaluation of low-cost particulate matter sensors in high and low concentration environments. Atmos. Meas. Tech. 11 (8):4823–46. doi:10.5194/amt-11-4823-2018.