
 ?Mathematical formulae have been encoded as MathML and are displayed in this HTML version using MathJax in order to improve their display. Uncheck the box to turn MathJax off. This feature requires Javascript. Click on a formula to zoom.
ABSTRACT
Major/crustal elements (Al, Ca, Mg, K, and Fe) and trace metals (Mn, Cr, Cu, Pb, Zn, and Ni) in atmospheric particulate matter at three sites in Goa (a coastal city in the Eastern Arabian Sea) were assessed during winter (December) and summer (March–May) months of 2015. A significant spatial and temporal variability was observed in PM10 mass concentration, crustal element, and trace metal composition at the sampling area (pristine, urban, and industrial locations). Using a diagnostic crustal element ratio (Fe/Al, Ca/Al, and Mg/Al), mineral dust components were characterized and found to show large spatial and temporal variability. The concentration levels of trace metals were further assessed for enrichment factor (EF) analysis, wherein reported elements were classified into two major groups. The first group consists of Cr, Cu, and Pb with 10< EF < 100 compared to continental crustal values (w.r.t. Al), suggesting a dominant contribution from anthropogenic sources with minor contribution from natural sources; the second group consists of Zn and Ni showing very high EF (>100)—these are solely derived from anthropogenic sources. Source identification for trace metals was further assessed based on principle component analysis (PCA). PCA highlights that the major contribution of trace metals is from anthropogenic emissions at all three locations. However, contributions from mineral dust were observed at pristine and urban locations during winter months. The reported data of trace metal concentrations in aerosols give baseline information on the atmospheric supply of micronutrients to the Arabian Sea, which has implications for the various surface ocean biogeochemical processes.
Implications: This paper reports on crustal and trace metal composition and concentration level in atmospheric aerosols over a coastal city located on the Eastern Arabian Sea. This study highlights the role of various factors (meteorology and emission sources) controlling the abundance of metals over a coastal site. The contribution from various sources (anthropogenic vis-à-vis natural) has also been identified using enrichment factor analysis as well as principle component analysis. This study has implications for the supply of micronutrients to the coastal Arabian Sea, which can significantly impact various surface ocean biogeochemical processes.
Introduction
Since the nineteenth century, ambient metal concentrations have increased in the atmosphere, which can be attributed to the increased emission from anthropogenic and natural sources (Kowalczyk, Gordon, and Rheingrover Citation1982; Gertler, Gillies, and Pierson Citation2000; Wrobel, Rokita, and Maenhaut Citation2000; Pakkanen et al. Citation2001). Trace metals from natural sources are mainly from dust emissions, volcanic eruptions, and biomass burning (Nriagu Citation1989). However, major anthropogenic sources are pyro-metallurgical processes, combustion processes including emissions from vehicles, burning of fossil fuels for power generation, and large industrial process such as ore and metal smelting (Blagojevic et al. Citation2009; Pacyna Citation1984). Additionally, incineration of urban waste water treatment sludge, urban waste, and metal smelting are also identified as important sources of trace metals to the atmosphere (Sullivan and Woods Citation2000; Sweet and Vermette Citation1993). Al, K, Ca, Fe, Mn, Cr, and Mg are the metal species usually associated with mineral dust and crustal species (Elefthereriadis and Colbeck Citation2001; Kulkarni et al. Citation2007; Kumar and Sarin Citation2009; Rastogi and Sarin Citation2009), and those atmospheric metal species usually associated with anthropogenic activities include Cd, Cu, Ni, Zn, and Pb (Kumar and Sarin Citation2009, Citation2010; Pacyna and Pacyna, Citation2001). On a global scale, wind-blown mineral dusts are major emitters of metals (accounting for 60–80%) with moderate to minor contribution from volcanic eruptions (15–25%), forest fires and sea spray (< 10%), all constituting the natural sources (Nriagu Citation1979). However, in recent decades, anthropogenic emissions of metals have significantly exceeded natural emissions (Pacyna and Pacyna Citation2001). In general, emission and concentration of metals into the atmosphere have large spatial variability, depending on climate, wind velocity, and surface topology.
In recent years, owing to rapid urbanization and industrialization, air quality has deteriorated from the emission of toxic metals into the atmosphere, which has emerged as a serious environmental issue (Borbely-Kiss et al. Citation1999; Wahid Citation2006). After emission, these metals undergo long-range transport via the eolian pathway and get deposited on ocean and land surfaces (Arimoto et al. Citation2004). This can lead to contamination of agricultural lands and terrestrial and aquatic ecosystems. The metals may, nevertheless, in some cases serve as a source of nutrients for these systems (Jickells et al. Citation2005). They may also produce adverse effects on human health due to their inevitable accumulation in the food chain (Fang et al. Citation2000; Van Malderen, Hoornaert, and VanGrieken Citation1996). Metal accumulation in human tissues, through the food chain and inhalation, can cause injuries in the human nervous system and internal organs. Considering their impact on mankind (Golomb et al. Citation1997), the study of these metals (and their role in air pollution) is of extreme importance. Apart from the health impact at the local to regional scale, trace metals also act as limiting/co-limiting nutrients for surface ocean primary productivity (Moore et al. Citation2013). In contrast, some of the trace metals—for example, Cu—can act as toxicants and reduce primary productivity (Paytan et al. Citation2009). The atmospheric outflow (movement of air parcel from continent to ocean), which is enriched in trace metal composition (Srinivas and Sarin Citation2013), can significantly modulate surface ocean biogeochemical processes. It is thus essential to quantify their concentration levels in different ecosystems and assess their sources and distribution on the spatial and temporal scales.
Here, we report on trace metal and crustal element composition in aerosols collected from three different representative sites (pristine, urban, and industrial) in a coastal city (Goa) located on the Eastern Arabian Sea. The site witnesses reversal of wind patterns (Agnihotri et al. Citation2015) and thus allows us to assess seasonal variability of aerosol trace metal composition over the North East Arabian Sea. The main goals are to assess the trace metal levels, identify their sources, and quantify the contribution of these sources to the observed trace metal concentrations. Thus far, there are no studies of trace metal concentration in aerosols from this region. The reported data will be complementing the efforts underway from the International GEOTRACES program (Anderson Citation2019).
Material and methods
Observation sites and prevailing meteorology
Goa is a small state along the west coast of India surrounded by the Arabian Sea to the west and Western Ghats to the east. Because of its scenic beauty, it attracts many tourists and, hence, tourism is considered as the major industry in Goa. Apart from this, the export of iron ore extracted from the midland of Goa is a major economic activity. Mining contributes about 20.4% of the gross domestic product to the state’s economy. Mining in Goa is now highly mechanized, employing open caste mining, which adds to the deterioration of air quality in this region. Major sources of atmospheric emission from open caste mining include clearing of land, transportation, and loading and unloading of ores. Along with this, the dust emanating from the haul roads contributes considerably to the particulate matter content in the atmosphere. In general, the air quality of Goa was found to be most depreciated along the ore transportation routes, also evidenced by a considerable load of particulate matter observed by Singh and Perwez (Citation2015).
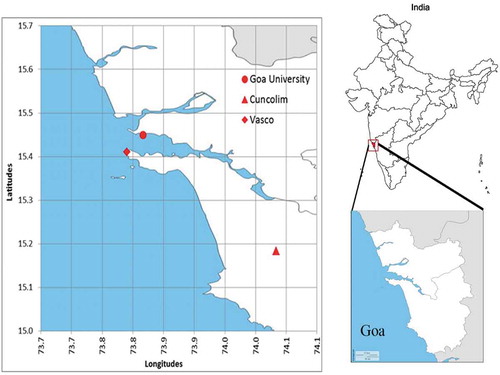
For this study, aerosol samples were collected at three sampling sites representing different segments of the region and activities, which include Goa University close to the coast, the Port station at Vasco, and the Industrial station at Cuncolim (). Goa University is close to the coast and Panaji City, and there are no industries located in the proximity; the region has moderate population and vehicular movement with few commercial activities. Mining is a routine activity at Goa’s Marmugoa Port, which is a premier hub for maritime trade in India. Our second sampling site (Vasco) is in close proximity to Mormugoa Port. The third sampling site is located near industrial areas undergoing rapid industrialization in the last two decades. Metallurgical, cobalt, and metal industries, alloy and steel melting, and rolling industries are all located near this sampling site.
Figure 1. Aerosol sampling done at a coastal location in Eastern Arabian Sea. Locations of three different sampling sites (in red dots) are shown in this map.
In general, annual average mean temperature stands at 21°C, but the mean annual maximum and minimum temperatures are 32°C and 22°C, respectively. Goa does not experience a normal winter due to the Western Ghats, which prevent the entering of cold dry winds. Hence, the maximum temperature does not dip lower than 12°C. Goa gets 90% of its rain from the southwest monsoon as it lies along the coast and windward side of the Sahyadri hills. The strong westerly winds which sweep across Goa during the wet season decrease in their intensity in October and remain moderate in strength throughout the dry season. However, these winds blow in an easterly to northeasterly direction in the morning and westerly in the afternoon. We collected samples during March, April, and May 2015 (henceforth referred to as summer month (SM) samples) and in December 2015 (referred to as winter month (WM) samples) at all three locations. Due to logistic reasons, we could not continue sampling for January and February 2016, which could have constituted WM samples. Nevertheless, seasonal variability in the crustal and trace metal composition has been discussed based on these samples.
Meteorological parameters such as atmospheric temperature, relative humidity, wind speed, and wind directions at the three sampling sites were obtained from AWS datasets of the Space Applications Center, Ahmedabad. Average atmospheric temperature is 28°C, 29°C, and 30°C during summer months and 28°C, 27.4°C, and 27°C in winter months; average relative humidity is 75%, 51%, and 80% in summer months and 69%, 66%, and 69% in winter months at Goa University, Vasco, and Cuncolim, respectively (see supplementary material). Maximum atmospheric temperature is higher in summer months than the winter months at all three sampling sites. Similarly, maximum relative humidity is in the summer months except at the Vasco site, where maximum relative humidity occurs in the winter months. The Cuncolim site has experienced higher atmospheric temperature and relative humidity compared to the Goa University and Vasco sites (see supplementary material). The prevailing wind directions are southwest at Goa University and northeast at Vasco and Cuncolim during the summer months (see supplementary material). During the winter months, the winds are predominantly northeast at Goa University, southwest at Vasco, and northeast at Cuncolim.
Aerosol collection
Ambient atmospheric aerosols (PM10: particulate matter less than 10 micron aerodynamic diameter) were collected from all locations in campaign mode during different phases in the summer and winter months of 2015 (date of sampling for each sample is detailed in the supplementary material). Samples were collected on Whatman glass microfiber filter papers (GF/A; size 8 × 10 inches) by using respirable dust sampler 460 NL (Envirotech, India; with flow rate 1.1 m3/min). The dust sampler was installed on an identified building terrace (at all three sites), typically at significant height (~10–12 m a.g.l) to avoid contamination from local soil. Twenty-four-hour average sampling was done for eight days (March 23 to April 12) at Goa University, 10 days (April 13 to May 6) at Vasco, and 12 days (May 19 to June 2) at Cuncolim during the summer months (SM; March–May). A total of seven samples were collected at Goa University (December 1–8), four samples (December 17–24) at Vasco, and four samples (December 9–14) at the Cuncolim site during the winter months (WM; December). The total number of samples collected along with their collection dates are detailed in the supplementary material. Subsequent to sampling, all samples were preserved in a ziplock container, brought to our laboratory, and stored at −19°C until the analysis.
Mass concentration
Mass concentration of all PM10 samples was measured using a Mettler Toledo microbalance (model no. ML204). The filter papers were weighed under controlled conditions of temperature and humidity before and after collection of particulate matter. Prior to weighing, all filters were conditioned at a relative humidity of 40 ± 5% and temperature of 22 ± 1°C for 5–6 hrs. The difference between initial and final weight of filters was normalized by volume of air pumped to calculate mass concentration in μg m−3.
Sample analysis
A piece of filter (area ~120 cm2) containing particulate matter was cut and digested with a mixture of supra-pure concentrated hydrofluoric acid, nitric acid, per-chloric acid, and deionized water (2:1:1:3). The protocol for digestion of samples has been adapted from Kessarkar et al. (Citation2013), wherein they digested suspended sediment samples from estuaries and rivers. The substrate used for sample collection was made of silica and easily digested with the use of HF. Post-digestion, samples were evaporated almost to dryness on a hot plate. The residue after cooling was dissolved and diluted to 50 ml with 2% HNO3. The samples were stored in high-density PVC bottles and subsequently analyzed for crustal elements (Al, Fe, Ca, K, and Mg) and trace metals (Cu, Mn, Zn, Pb, Cr, and Ni) on ICP-OES (Model: Agilent 710 series) at the CSIR-National Institute of Oceanography, Goa.
The instrument sensitivity was frequently monitored with respect to mixed standard solutions (Merck, Germany; 23 elements). In addition, multi-element calibration standards were run after every 10 samples to check on the short-term fluctuations in the ionization efficiency of the plasma source on ICP-OES. For all instrumental analyses, filter blanks were analyzed together with sample filters, and suitable corrections were made for crustal elements and trace metals. The coefficient of variation (%) for repeat extracts for different elements was Al (10), Ca (8), Mg (7), K (9), Fe (7), Mn (5), Cr (7), Cu (6), Pb (5), Zn (5), and Ni (5). The concentration of individual elements in the samples was determined from the calibration curve generated based on standards run in different concentrations.
Data analysis techniques
The important sources of trace metals to aerosols are: (a) crustal source; (b) anthropogenic source; and (c) sea salt generation (oceanic source). The degree to which a trace metal in an aerosol is enriched or depleted, relative to a specific source, can be assessed to a first approximation using an enrichment factor (EF). EF relative to earth crust composition gives an idea about the increase in concentration of metals due to human activities. Enrichment factor for each metal is calculated by dividing its ratio to the normalizing element (here we are using Al, which is considered a conservative trace element for crustal matter) by the same ratio found in the upper continental crust (Mclennan Citation2001; Saad et al. Citation2018). Al is one of the most abundant elements on the earth;it usually has no contamination concern and has been widely use to study the sources and contamination of trace metals in riverine, estuarine, and coastal environments (Feng Han, Zhang, and Yu Citation2004; Zhang and Li Citation2002). The enrichment factors is defined as:
where (M/Al) Sample is the ratio of metal and Al concentrations in the sample and (M/Al) UCC is the ratio of metal and Al concentrations in the upper continental crust. This calculation assumes that the contribution of anthropogenic Al is insignificant at the sampling region. An EF close to one indicates that an element has few sources other than windblown crustal material. Values much higher than unity imply sources other than crustal dust. These sources may include anthropogenic activities and natural processes; e.g., biogenic processes, forest wildfires, volcanic eruptions, sea salts, etc.
Another important statistical tool, principal component analysis (PCA), was performed on elemental data to identify possible sources of the metals. In the present study, PCA Varimax Kaiser normalized rotation was performed (computational detail of PCA is discussed in the supplementary material) on the data set of metals from three sampling sites—Goa University, Vasco, and Cuncolim—in two different seasons using Statisitca 7.0 (StatSoft).
Results and discussion
Spatio-temporal variations of crustal and trace elements have been studied over three sampling sites during SM and WM. The average PM10 (particulate matter less than 10 mm aerodynamic diameter) mass and crustal as well as trace metal composition for all three stations in two different seasons is detailed in .
Table 1. Average mass concentration (in ng m−3) with standard deviation of PM10, crustal and trace elements measured during this study at three locations in Goa during summer and winter months. Average elemental ratios (diagnostic tracers) are also given in the last three rows for all locations during summer and winter.
Variability in PM10 mass concentration
PM10 mass concentration is an important contributor to the ambient air quality, and was found to be significantly high in several Indian cities (Guttikunda, Goela, and Pant Citation2014). Daily variation of PM10 mass observed over three distinct sites at Goa in two seasons is shown in . The average mass load for Goa University (GU) is the lowest (48.8 ± 21.1 μg m−3) among the three sites, with almost similar load found for Vasco and Cuncolim locations during the summer months (). A similar trend is observed for winter months for the three sites with the lowest loading at GU (98.7 ± 35.8 μg m−3). The lowest mass load at GU can be attributed to its geographical location, which is a relatively pristine site, with negligible vehicular/industrial emissions. However, the other two sites are near port and industrial areas. The mass load observed at GU in winter is comparable with the value reported by Agnihotri et al. (Citation2015) from a nearby location at the National Institute of Oceanography (NIO) during winter months. Agnihotri et al. (Citation2015) had reported total suspended mass load of 80.78 ± 29.46 mg m–3, slightly less than our value. This may be mainly due to the sampling collection site and the height at which aerosol collection was done. At NIO, samples were collected at ~30 m above ground level, whereas at GU it was collected at 10 m a.g.l. In addition, the NIO site is 500 m away from the Arabian Sea and is more pristine compared to GU. An overall increase in mass load is observed at all three locations during winter as compared to summer. The variation in mass loading largely depends on meteorological parameter; for example, wind speed. High wind speed can disperse particulate matter more effectively and can dilute mass concentration. In our present study, we observed high wind speed during summer compared to winter (s supplementary material). High winds can help in dispersal of particulate matter and thus, we observe overall lower values during summer. Furthermore, the weak winds were observed at Cuncolim stations during both seasons, and we find highest mass load at this site in both seasons. This clearly highlights the role of meteorological factors as well as emission sources in deciding the abundance of particulate matter.
Figure 2. Spatio-temporal variation of PM10 mass concentration collected at three sampling sites during (a) summer months and (b) winter month.
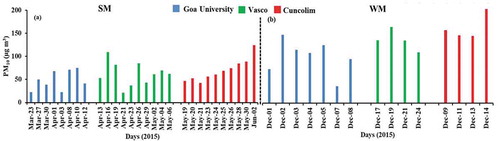
An average mass load for Goa can be considered ~60 and 131 μg m−3 (by taking the average of mass load at the three sites) during winter and summer. This average value is compared with other coastal locations—specifically, Vishakhapatnam, Trivandrum, and Chennai (Guttikunda, Goela, and Pant Citation2014) in India. The summer load is comparable with Trivandrum (62.9 ± 17.8 μg m−3) and lower than Vishakhapatnam (91.2 ± 34.8 μg m−3) and Chennai (121.5 ± 45.5 μg m−3). However, the winter value at Goa exceeds the annual average of these cities. The high values of mass loading also depend on urban population and the expansion of cities. The increase in population increases the demand for motorized vehicles (both personal and public transport), which further leads to deterioration of the ambient air quality. Chennai, being highly populated among all coastal cities, has very high annual average mass load. Thus, the mass load shows large variability at the local scale and depends on the various factors stated earlier.
Composition and characterization of PM10 using crustal elements
The concentration of crustal elements (Al, Ca, Mg, K, and Fe) in PM10 samples collected from three different stations during March–April (SM) and in December (WM) 2015 is shown in . Significant differences were observed in the concentration of crustal elements at the three different locations. At Goa University, Al and Ca showed an increase in concentration from March to April, while no clear increasing or decreasing trend was observed for Mg, K, and Fe. These metals (Mg, K, and Fe) displayed an increase in concentration during the first few days and thereafter a decreasing trend was observed. Calcium at Vasco showed a decreasing trend from April 13 to May 6, whereas Al and Mg showed almost a constant variation except on April 29, when the highest peak was reported. Similarly, at Cuncolim, Fe showed an increase in concentration from May 19 to June 2, while Al and Mg showed a similar pattern of distribution with a maximum peak on May 23. These observations suggest no significant pattern or trend in the variability of crustal elements at all three stations in Goa. However, we find large spatial variability, with Cuncolim showing the highest value of crustal element (except Ca and Mg), followed by Vasco and GU. Although Cuncolim shows the highest for Ca and Mg, they were high at GU compared to Vasco. This might be due to the increased influence of sea salt at GU rather than Vasco. On the other hand, during WM at Goa University, most of the crustal elements did not show any clear pattern except for K, which showed a decreasing trend from December 1 to December 8 (). Though the distribution is not clear, Ca and K showed a similar distribution pattern with maximum concentration on December 19–21, and Al and Mg with a maximum peak on December 24, respectively, at Vasco. The spatial variability of crustal elements during winter is different than summer, wherein GU showed the highest value for Al, Ca, and Mg while Vasco had the highest Fe. This suggests the impact of mineral dust derived from local emission sources during winter, and this impact is observed prominently over the pristine site. The contribution from mining activity is also observed at Vasco, showing high Fe values. This further indicates the dominant role of emission sources rather than meteorological parameters.
Figure 3. Spatio-temporal variation of crustal elements (Al, Ca, Mg, K, and Fe) in aerosols collected at three sampling sites during summer and winter months.
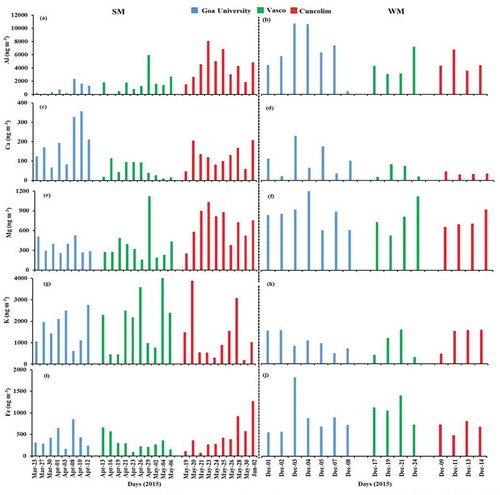
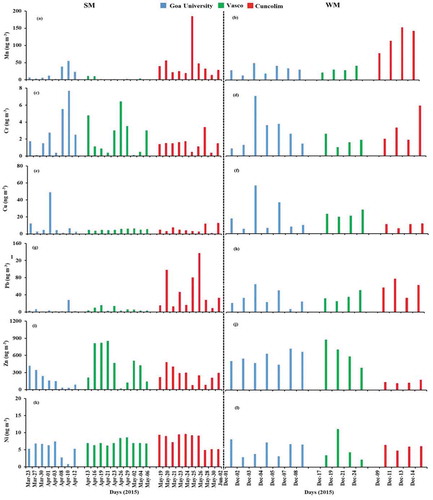
Figure 4. Spatio-temporal variation of trace elements (Mn, Cr, Cu, Pb, Zn, and Ni) in aerosols collected at three sampling sites during summer and winter months.
The major source of these elements (Al, Fe, Ca, Mg, K) is mineral dust, which is derived from the crust (Usher et al., Citation2003); however, recent studies have indicated the contribution of some of these metals from sources other than mineral dust. For example, Andreae (Citation1983) reported a significant contribution of K from biomass burning aerosols. Ca and Mg can also be derived from sea-salt aerosols (Kumar and Sarin Citation2009), especially over coastal locations. Fe can be emitted from various combustion sources, including biomass and fossil fuel burning sources (Kumar and Sarin Citation2010; Schroth et al. Citation2009). In this study, we are limited by the water-soluble composition of PM10 samples; thus, it is difficult to decouple contributions from various sources. Here, presuming all crustal elements are derived from mineral dust, we attempt to characterize dust using diagnostic elemental ratios: Fe/Al, Ca/Al, and Mg/Al. These ratios have been used as proxies to identify the source of mineral dust in Africa (Chiapello et al. Citation1997), Asia (Zhang et al. Citation1996), and over western India (Kumar and Sarin Citation2009). Average Fe/Al, Ca/Al, and Mg/Al ratios for all three sites in SM and WM are detailed in . A very high Fe/Al ratio (0.94 ± 0.74 and 1.12 ± 1.01) is found in aerosols collected from Goa University and the Cuncolim site, respectively. In contrast, relatively low Fe/Al ratio (0.42 ± 0.43) is observed for the Vasco site, which is comparable to a UCC ratio of 0.44 (Mclennan Citation2001). A significant decrease in Fe/Al ratio is observed for the winter month for all three sites. This indicates the influence of distinct sources to the dust collected in Goa during two distinct seasons. A large spatial variation is observed for this ratio at our study site and can be attributed to different emission sources associated with the three locations. Previous work by Kumar, Sudheer, and Sarin (Citation2008) reported 0.51 ± 0.05 and 0.72 ± 0.37 over the Arabian Sea and Bay of Bengal, respectively. The influence of combustion sources has been attributed to the high Fe/Al ratio for the Bay of Bengal as compared to the Arabian Sea, which received mostly pristine dust during the sampling period. In our study, we observe a higher ratio in summer compared to winter, which is an anomalous observation. This is because enrichment in Fe indicates a contribution from anthropogenic sources; however, we did not observe a high Fe/Al ratio for the Cuncolim site, which is near industrial emission sources and more prone to receive anthropogenic Fe. In order to conclusively interpret the Fe/Al ratio, comprehensive long-term measurement is required.
Similar to the Fe/Al ratio, we also analyzed Ca/Al and Mg/Al ratios for both summer and winter months at three sites in Goa (). A high Ca/Al ratio (w.r.t UCC value of 0.37) is observed for Goa University (0.76 ± 1.74) and the Cuncolim site (0.53 ± 0.83), and a comparable value of 0.15 ± 0.35 is found for the Vasco site. This is similar to what has been observed for the Fe/Al ratio during the summer season. However, a very low value was found for all three sites during winter (). In contrast to Fe/Al and Ca/Al ratios, we observed higher Mg/Al ratios for winter compared to summer (). These ratios indicate the influence of local sources rather than remote sources or dust from long-range transport. This is mainly due to the difference we found in ratio compared to those reported over the Arabian Sea (Kumar, Sudheer, and Sarin Citation2008), located in the western side of Goa. The Arabian Sea receives dust from nearby arid/sem-arid regions (e.g., Arabian Peninsula, Southwest Asia, and Thar Desert), and ratios reported here are significantly different and highly variable as compared to our sampling site. The relative contribution of the crustal element from the local vis-à-vis remote source is beyond the scope of this study. However, a long-term study at this site may reveal characteristics and sources of dust and their contribution to ambient particulate matter more comprehensively.
Trace metal composition and variability
The average concentrations of trace metals during two different seasons (SM and WM) at Goa University, Vasco, and Cuncolim are shown in . Their daily concentration on collection dates during the summer and winter seasons is displayed in . Zn is found to be most abundant among all trace metals analyzed (), followed by Mn and Cu at the Goa University site and Pb and Mn at the Cuncolim site during summer months. Other than Zn, all trace metals are on the lower side at the Vasco site as compared to the other two locations. This indicates that Vasco is possibly cleanest among the three locations in terms of trace metals other than Zn. This observation suggests that no significant pollution source is impacting ambient air during the collection period at Vasco, although Zn levels are highest for this site during summer. The highest concentration of trace metals (which are anthropogenically derived) was observed at the Cuncolim site, mainly because it is an industrial location. Several industries—metallurgical, steel melting, rolling, tire retreading and thread rubber, crown caps, construction additives and allied products, etc.—influence the concentration of anthropogenic elements in the Cuncolim region. An overall significant increase is observed in all trace metal average concentrations during winter months. An increase of more than five times is observed for Zn, most abundant among all observed during the summer at the Cuncolim site. An approximately 1.5 times increase is found for Goa University and the Vasco location. Pb, as the second most abundant metal, shows a contrasting increasing trend with that shown by Zn. More than five times an increase in Pb is found for Goa University and Vasco, but no significant increase is observed at the Cuncolim site. In addition, a more than 10 times increase is observed in Ni concentration for all sites. These marked differences in seasonal to daily distribution patterns arise possibly due to the strength of emission sources of aerosols and ambient meteorological parameters. Meteorological factors such as wind speed, wind direction, mixing height, temperature, and relative humidity play important roles in determining the pollutant levels in ambient atmosphere (Singal and Prasad Citation2005; Tayanc Citation2000). Temperature and relative humidity in the present study did not show much variation during SM and WM; however, marked distinctions were observed in wind pattern during the two seasons at the three sampling sites (see the supplementary material). During SM, wind direction is mainly from the SW to NW direction at Goa University, whereas at Vasco and Cuncolim wind flows mainly in W to N directions (Figure S1). Hence, the aerosol prevailing during this period is a mixture of both continental air mass and maritime. This is also supported by the marine contribution of K and Ca, as these elements are abundant in seawater. Further, dryness of the soil during summer causes the soil particles to be easily transported in the air by wind and dilutes the pollutant (Pekey et al. Citation2010). High K at a sampling site thus may be from oceanic sources, which are associated with the formation of sea salt. Similarly, during WM, winds are prevailing mostly from a NE to SE direction at Goa University, ESE to SW at Vasco, and N to SSW at Cuncolim (Figure S1). In general, during winter months, wind blows from northeast to southwest and carries anthropogenically derived trace-metal-rich continental air mass. In addition, we did not observe any significant correlation between strength of wind speed and daily trace metal concentration in a particular season. However, we observe a high trace metal content in ambient air during winter months compared to summer months. These seasonal variations can be explained based on a calm wind condition during winter compared to summer. Due to this calm wind condition, the dispersal is not as efficient as during a strong wind condition. Moreover, the tourism is at its peak in December, and the number of motor vehicle rises exponentially on roads, adding significant amounts of fossil fuel burning emissions. These are possibly a major cause for an increase in trace metal concentration during the winter month. Thus, these observations suggest the role of emission sources as being more prominent than meteorological parameters to explain daily as well as seasonal trace metal variations over Goa.
Enrichment factor analysis
The enrichment factor (EF) of metals that are mainly sourced from anthropogenic activities (Cr, Cu, Pb, Zn, and Ni) in aerosol samples is shown in . Based on varying EF, the trace metals can be divided into two sub-groups. The first group includes elements such as Cr, Cu, and Pb having enrichment factors around 10 and above but less than 100, and thus are moderately enriched in metals. These trace metals are mainly contributed by anthropogenic sources such as vehicle emissions/oil combustion and re-suspended road dust with high traffic densities (Samara and Voutsa Citation2005; Shah et al. Citation2006; Tripathee et al. Citation2014; Viana et al. Citation2008), with possibly partial contribution from crustal sources. The second group of metals includes Zn and Ni with enrichment factors > 100, indicating that they are severely contaminated from anthropogenic activities (Al-momani Citation2003; Tripathee et al. Citation2014) with no contribution from geogenic sources. All three sites show significant enrichment of Cr (EF > 100) for a few days during the summer months. In comparison, surprisingly, no significant enrichment of Cr is found during winter at all three sites. This indicates that sources contributing Cr (steel industry) are not active during the sampling period. Like Cr, Cu and Pb also show a similar trend of high enrichment for a few days during the summer months compared to winter months. However, on average, Cu and Pb display high enrichment during winter months at the Vasco and Cuncolim sites. No significant differences in EF of Cu and Pb were observed for the Goa University site, suggesting no seasonal impact on trace metal concentrations at the pristine location that is least affected by industrial or anthropogenic emission sources. Cu and Pb are mainly derived from fossil fuel combustion, traffic, and industrial activities (Cong et al. Citation2011). Thus, relatively high enrichment of Cu and Pb is observed at Vasco (port site) and Cuncolim (industrial site) during the winter month.
Figure 5. Box-plot representation of the enrichment factors (EF) of trace metals (Cr, Cu, Pb, Zn, and Ni) at three sampling sites during summer and winter months.
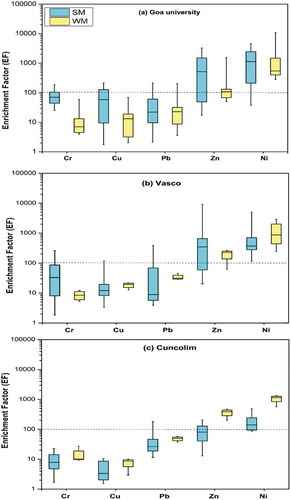
Zn and Ni are primarily derived from fuel burning and traffic sources (Cong et al. Citation2011).We observed very high enrichment for these two metals at all three sites. However, a large variability is observed for samples collected during summer months. This is similar to what is found in other metals, as discussed earlier. This clearly hints that the trace metal concentrations have day-to-day variability and are largely attributed to activation of source emissions. The seasonal high of EF for Zn and Ni during winter months is similar to those observed for other metals. This suggests that seasonal variability in metal concentration may be attributed to meteorological changes; however, daily variation in metal concentration depends on the activity of the emission source region.
Source apportionment
Principal component analysis (PCA) is a statistical tool that is used to explain most of the variance in the data set. The aim of this tool is to find the direction of multivariate space with maximum variability (Reimann et al. Citation2008; Tripathee et al. Citation2016). Subsequently, principle components (PC) will be identified that are orthogonal to each other. The number of principal components will depend on the variability of the data available and on the number of examined elements (Tripathee et al. Citation2016). shows 3D plots that describe the PC loadings for metal data of the study period during both seasons. For interpreting the metal data, the Kaiser Criterion method (Kaiser Citation1960) is followed, which will retain only those factors having eigenvalue >1. Factor loadings >0.71 are typically regarded as strong loadings and <0.32 as very weak loadings (Nowak Citation1998).
Figure 6. Three-dimensional plot of the factor loadings for 11 components at three sampling sites.
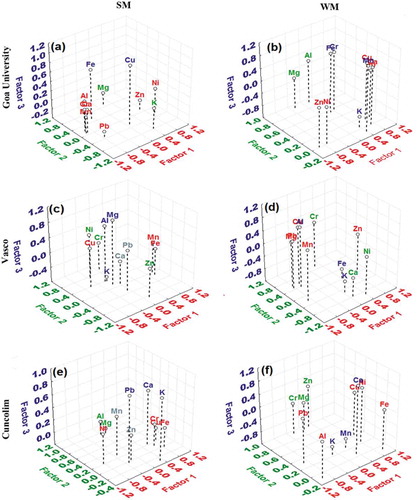
During SM, PCA results of metal in PM10 at Goa University showed three PCs (). PC1 accounted for 56.55% of total variance; it is associated with strong positive loadings on Ni and Zn and strong negative loadings on Mn, Cr, Ca, Al, and Pb. This may be associated with vehicular emissions. Zn and Ni are mainly emitted from lubricating oil, break lining, and tires (Cong et al. Citation2011). PC2 accounted for 17.94% of total variance and it is associated with strong positive loadings on Mg and strong negative loadings on K. This can be attributed to sea salt (Tripathee et al. Citation2017). Similar studies conducted on source identification at various places of the Mumbai region also indicated crustal matter and sea salt as main sources contributing to particulate pollution, along with other anthropogenic sources (Kumar, Patil, and Nambi Citation2001; Sadasivan, Negi, and Mishra Citation1984; Tripathi et al. Citation2004). PC3, which accounted for 12.4% of the total variance, has high loadings on Fe. This factor may be associated with road dust sources. Similar to SM, three PCs were obtained at this site for WM, which accounted for 90.01% of total variance (). PC1, which accounted for 53.50% of the total variance, showed a strong positive loading on Pb and Cu and a strong negative loading on Ni and Zn, almost the reverse of what was found in SM. PC2, which accounted for 20.91% of the total variance, showed strong positive loadings on Al and Mg, which may be attributed to crustal sources. PC3, which accounted for 16.59% of the total variance, showed a strong positive loading on Mn and Fe and a good loading on Ca, K, and Cr. This may be associated with a mixed source; i.e., crustal and anthropogenic sources. PC2 and PC3 hint at enrichment in crustal sources during winter months at the Goa University site. This is in line with the observation found for EF analysis, wherein a decrease in EFs was found for all metals at the Goa University site. In addition, an increase in average Al concentration () at GU attests to the fact of increased dust contribution during winter.
At Vasco, PCs obtained from PCA accounted for 87.06% of the total variance (). PC1 accounted for 39.44% of the total variance and showed strong positive loadings on Mn and Fe and strong negative loadings on Cu. This factor probably represents a mixture of re-suspended dust (Chakraborty and Gupta Citation2009; Quiterio et al. Citation2004; Shah et al. Citation2006) and iron ore mining activities, which are considered to be the most important sources of these elements. Iron ore mining is the major economic activity in Goa, where Marmagoa Port occupies a prominent position in India’s premier iron ore exporting ports. Apart from this, Mn is mainly originated from airborne soil dust, which exists in the form of MnO2. PC2, which accounted for 19.60% of the total variance, showed strong positive loadings on Cr and Ni and a strong negative loading on Zn, and is attributed to anthropogenic sources. This is conspicuous, as no significant enrichment is found for Cr (EF <10) at the Vasco site during SM and WM. However, significant enrichment is observed for Ni, especially in WM, at this site. PC3, which accounted for 15.59% of the total variance, showed strong positive loadings on Mg and Al and strong negative loadings on K. This factor indicates the contribution from crustal sources (i.e., mineral dust), which possibly comes from mining activity and/or transportation of Fe ores. PC4, which accounted for 12.43% of the total variance, showed strong positive loadings on Ca and Pb. This factor may be attributed to road dust sources. Ca is widely used as CaCl2 in construction of roads, and Pb has become part of the road dust due to the use of leaded fuel over the years. It is evident from this that mining activity contributes significantly to metal concentrations at the Vasco site. During WM, three PCs were obtained that accounted for 99.98% of the total variance (). PC1, which accounted for 65.25% of the total variance, showed a strong positive loading on Zn and strong negative loadings on Pb, Cu, Mg, and Mn. This indicates a significant contribution from anthropogenic sources; however, it is difficult to decouple contribution from long-range transported aerosols or local sources. PC2 and PC3 accounted for 23.84% and 10.89%, respectively, of the total variance. They mostly showed a strong positive loading on Cr and Al and strong negative loadings on K, Ni, and Fe. This is interesting, as a contribution from mineral dust is also observed during winter months. Cr can be contributed by dust derived from the Oman region (Chinnam et al. Citation2006). We also observed dust contributing to Goa University samples during winter. The increased dust contribution during winter is evidenced from an increase in Al concentration during WM at Vasco similar to that found at GU.
At Cuncolim, four PCs were obtained that accounted for 84.4% of the total variance (). PC1 accounted for 31.03% of the total variance and showed strong positive loadings on Cu, Fe, and Cr and strong negative loadings on Ni. This factor can be attributed to industrial emission of these elements during the study period (Ahumada, Whitehead, and Blanco Citation2007; Cetin et al. Citation2007; Dubey, Pal, and Singh Citation2012). PC2, which accounted for 20.53% of the total variance, showed a strong positive loading on Al and Mg. This is possibly due to a contribution from local dust, as Al and Mg were not found to be significantly loaded in the other two locations during SM. PC3 and PC4 accounted for 18.68% and 14.16% of the total variance with a strong positive loading on Pb, Ca, Zn, and K, indicating a strong anthropogenic contribution, which is expected from an industrial site. During WM, all three PCs accounted for 99% of total variance with strong contributions from anthropogenic sources.
Overall, we observe a strong anthropogenic influence at the Cuncolim site in both seasons. However, we observe a contribution from mineral dust at Goa University and the Vasco location during winter. In order to get a more representative variation in trace metal distribution, it is imperative to increase sampling frequency in different seasons.
Conclusion
The atmosphere is generally recognized as a major route for the transport of trace metals to the marine environment. In this study, we have assessed the metal concentration levels at a coastal location in the Eastern Arabian Sea. Major crustal (Al, Fe, Ca, Mg, K, and Mn) and trace (Cr, Cu, Pb, Zn, and Ni) metals were analyzed in the ambient aerosol (PM10) samples collected from three different locations in Goa during summer and winter months of 2015. This is corroborated by statistical analysis wherein major element and trace metal source identification was done. This is a first maiden report on monitoring of concentrations of crustal and trace metals in atmospheric aerosols over a coastal station in the Eastern Arabian Sea (Goa), India. This study highlights high PM10 concentration during winter compared to summer at all three locations. This is attributed to low wind speed and neutral stability during winter, when it is harder to disperse particulate matter effectively. In addition, the contribution of mineral dust (Al) during winter at two sites (GU and Vasco) further adds to the high particulate mass concentration. A significant spatio-temporal variation is observed for both crustal and trace metal concentrations during our study period at Goa. Higher abundances were observed at industrial (Cuncolim) and port (Vasco) sites compared to a pristine (Goa University) location. Also, winter samples have higher concentrations for all crustal and trace metals compared to summer month samples. Based on diagnostic elemental ratios—i.e., Fe/Al, Ca/Al, and Mg/Al—mineral dust at Goa is characterized. A significant difference was observed in dust characteristics, indicating distinct dust sources impacting our study site. In order to assess crustal versus anthropogenic sources, enrichment factor analysis have been done. Cr, Cu, and Pb were found to be moderately enriched (10 < EF < 100); however, Zn and Ni displayed very high enrichment (EF > 100) w.r.t crustal sources. An enhanced enrichment is observed for Cr, Pb, and Ni in winter samples at the Vasco and Cuncolim sites. However, no such trend is found in samples collected from GU. Higher enrichment is observed for Zn and Ni during winter for all three station as compared to the summer season. PCA was also attempted to identify sources of metals at all three stations in both seasons. Most of the trace metals are found to derive from anthropogenic sources with partial contribution from mineral dust during the winter month at GU and Vasco station. These findings are partially in agreement with EF analyses and concentration data. A more comprehensive sampling with high sampling frequencies is required to understand seasonal differences of crustal and trace metal distribution at this site. However, the present data provide a very important source of information on crustal and trace metal distribution on a spatio-temporal scale over the Eastern Arabian Sea.
Supplemental Material
Download MS Word (607.5 KB)Acknowledgment
The authors thank the China Section of the Air & Waste Management Association for the generous scholarship they received to cover the cost of page charges and make the publication of this paper possible. The authors also gratefully acknowledge Dr. B. Nagender Nath and Dr. B. Madhavan for extending their help during the study. The authors thank three anonymous referees for their valuable comments/suggestions, which helped in improving this paper. NIO contribution No. 6459
Supplementary material
Supplemental data for this paper can be accessed on the publisher’s website.
Additional information
Funding
Notes on contributors
Cynthia V. Gaonkar
Cynthia V. Gaonkar is a research student at The School of Earth, Ocean and Atmospheric Sciences, Goa University, India.
Ashwini Kumar
Ashwini Kumar is a Senior Scientist working in the field of Atmospheric Science at CSIR-National Institute of Oceanography, Goa, India.
Vishnu Murty Matta
Vishnu Murty Matta is Professor at The School of Earth, Ocean and Atmospheric Sciences, Goa University, India.
Siby Kurian
Siby Kurian is a Principle Scientist at CSIR-National Institute of Oceanography, Goa, India.
Related Research Data
References
- Agnihotri, R., S. G. Karapurkar, V. Sarma, K. Yadav, M. D. Kumar, C. Sharma, and M. V. S. N. Prasad. 2015. Stable isotopic and chemical characteristics of bulk aerosols during winter and summer season at a station in Western Coast of India (Goa). Aerosol Air Qual. Rese. 15:888–900. doi:10.4209/aaqr.2014.07.0127.
- Ahumada, H. T., L. Whitehead, and S. Blanco. 2007. Personal exposure to PM2.5 and element composition a comparison between outdoor and indoor workers from two Mexican cities. Atmos. Environ. 41:7401–13. doi:10.1016/j.atmosenv.2007.05.059.
- Al-momani, I. F. 2003. Trace elements in atmospheric precipitation at Northern Jordan measured by ICP-MS: Acidity and possible sources. J. Atmos. Environ. 37 (32):4507–15. doi:10.1016/S1352-2310(03)00562-4.
- Anderson, R. F. 2019. GEOTRACES: Accelerating research on the marine biogeochemical cycles of trace elements and their isotopes. Annu. Rev. Mar. Sci. 12. doi:10.1146/annurev-marine-010318-095123.
- Andreae, M. O. 1983. Soot carbon and excess fine potassium: Long-range transport of combustion-derived aerosols. J. Sci. 220:1148–51. doi:10.1126/science.220.4602.1148.
- Arimoto, R., X. Y. Zhang, B. J. Huebert, C. H. Kang, D. L. Savoie, J. M. Prospero, S. K. Sage, C. A. Schloesslin, H. M. Khaing, and S. N. Oh. 2004. Chemical composition of atmospheric aerosols from Zhenbeitai, China, and Gosan, South Korea, during ACE‐Asia. J. Geophy. Res 109:D19. doi:10.1029/2003JD004323.
- Blagojevic, N., B. Damjanovic-Vratnica, V. Vukasinovic-Pesic, and D. Durovic. 2009. Heavy metals content in leaves and extracts of wild-growing salvia officinalis from montenegro. Polish J. Environ.Stud. 18 (2):167–73.
- Borbely-Kiss, I., E. Koltay, G. Y. Szabo, and T. K. Bozol. 1999. Composition and sources of urban and rural atmospheric aerosol in eastern Hungary. J. Aerosol Sci. 30:369–91. doi:10.1016/S0021-8502(98)00051-2.
- Cetin, B., S. Yatkin, A. Bayram, and M. Odabasi. 2007. Ambient concentrations and source apportionment of PCBs and trace elements around an industrial area in Izmir, Turkey. Chemos 69:1267–77. doi:10.1016/j.chemosphere.2007.05.064.
- Chakraborty, A., and T. Gupta. 2009. Chemical characterization of submicron aerosol in Kanpur region: Asource apportionment study. Int. J. Civil Environ. Eng. 1 (2):87–90. doi:10.4209/aaqr.2009.11.0071.
- Chiapello, I., G. Bergametti, P. Chatenet, F. Bousquet, E. Dulac, and S. Soares. 1997. Origins of African dust transported over the northeastern tropical Atlantic. J. Geophys. Res. 102:13,701–13,709. doi:10.1029/97JD00259.
- Chinnam, N., S. Dey, S. N. Tripathi, and M. Sharma. 2006. Dust events in Kanpur, northern India: Chemical evidence for source and implications to radiative forcing. J. Geophy. Res. 33 (8). doi: 10.1029/2005GL025278,2006.
- Cong, Z., S. Kang, C. Luo, Q. Li, J. Huang, S. Gao, and X. Li. 2011. Trace elements and lead isotopic composition of PM10in Lhasa, Tibet. J. Atmos. Environ. 45 (34):6210–15. doi:10.1016/j.atmosenv.2011.07.060.
- Dubey, B., A. K. Pal, and G. Singh. 2012. Trace metal composition of airborne particulate matter in the coal mining and non–Mining areas of Dhanbad region, Jharkhand. Atmos.Pollut. Res. 3:238–46. doi:10.5094/APR.2012.026.
- Elefthereriadis, K., and I. Colbeck. 2001. Coarse atmospheric aerosol: Size distributions of trace elements. Atmos. Environ. 35:5321–30. doi:10.1016/S1352-2310(01)00304-1.
- Fang, G. C., C. N. Chang, Y. S. Wu, N. P. Wang, V. Wang, P. C. Fu, D. G. Yang, and S. C. Chen. 2000. Comparison of particulate mass, chemical species for urban, suburb and rural areas in central Taiwan,Taichung. Chemosphere 41:1349–59. doi:10.1016/S0045-6535(00)00003-5.
- Feng Han, X., W. Zhang, and L. Yu. 2004. A preliminary study of heavymetal contamination in Yangtze River intertidal zone due to urbanization. Mar. Pollut. Bullet 49:910–15. doi:10.1016/j.marpolbul.2004.06.014.
- Gertler, A. W., J. A. Gillies, and W. R. Pierson. 2000. An assessment of the mobile source contributiontoPM10 and PM 2.5 in the United States. Water Air Soil Pollut. 123:203–14. doi:10.1023/A:1005263220659.
- Golomb, D., D. Ryan, N. Eby, J. Underhill, and S. Zemba. 1997. Atmospheric deposition of toxic onto Massachusetts Bay-I metals. Atmos. Environ. 31 (9):1349–59. doi:10.1016/S1352-2310(96)00276-2.
- Guttikunda, S. K., R. Goela, and P. Pant. 2014. Nature of air pollution, emission sources, and management in the Indian cities. J. Atmos. Environ. 95:501–10. doi:10.1016/j.atmosenv.2014.07.006.
- Jickells, T. D., Z. S. An, K. K. K. Andersen, A. R. Baker, G. Bergametti, N. Brooks, J. J. Cao, P. W. Boyd, R. A. Duce, R. K. A. Hunter, et al. 2005. Global iron connections between desert dust, ocean biogeochemistry, and climate. Science 308 (5718):67–71. doi:10.1126/science.1105959.
- Kaiser, H. F. 1960. The application of electronic computers to factor analysis. Edu. Psycholo. Meas. 20:141–51. doi:10.1177/001316446002000116.
- Kessarkar, P. M., R. Shynu, V. P. Rao, F. Chong, T. Narvekar, and J. Zhang. 2013. Geochemistry of the suspended sediment in the estuaries of the Mandovi and Zuari rivers, central west coast of India. Environ. Monit. Assess. 185:4461–80.
- Kowalczyk, G. S., G. E. Gordon, and S. W. Rheingrover. 1982. Identification of atmospheric particulate sources in Washington, D.C., Using chemical element balances. Environ. Sci. Technol. 16:79–90. doi:10.1021/es00096a005.
- Kulkarni, P., S. Chellam, J. B. Flanagan, and R. K. M. Jayanty. 2007. Microwave digestion—ICP-MS for elemental analysis in ambient airborne fine particulate matter: Rare earth elements and validation. Anal. Chim. Acta. 599:170–76. doi:10.1016/j.aca.2007.08.014.
- Kumar, A., A. K. Sudheer, and M. M. Sarin. 2008. Chemical characteristics of aerosols in MABL of Bay of Bengal and Arabian Sea during spring inter-monsoon: A comparative study. J. Earth Syst. Sci. 117:325–32. doi:10.1007/s12040-008-0035-9.
- Kumar, A., and M. M. Sarin. 2009. Mineral aerosols from western India: Temporal variability of coarse and fine atmospheric dust and elemental characteristics. Atmos. Environ. 43 (26):4005–13. doi:10.1016/j.atmosenv.2009.05.014.
- Kumar, A., and M. M. Sarin. 2010. Atmospheric water-soluble constituents in fine and coarse mode aerosols from high-altitude site in western India: Long-range transport and seasonal variability. Atmos. Environ. 44 (10):1245–54. doi:10.1016/j.atmosenv.2009.12.035.
- Kumar, A. V., R. S. Patil, and D. S. V. Nambi. 2001. Source apportionment of suspended particulate matter at two traffic junctions in Mumbai, India. Atoms. Environ. 35:4245–51. doi:10.1016/S1352-2310(01)00258-8.
- Mclennan, S. M. 2001. Relationships between the trace element composition of sedimentary rocks and upper continental crust. J. Geochem. Geophy. Geosyst. 2 (4). doi: 10.1029/2000GC000109.
- Moore, C. M., M. M. Mills, K. R. Arrigo, I. Berman-Frank, L. Bopp, P. W. Boyd, E. D. Galbraith, R. J. Geider, C. Guieu, S. L. Jaccard, et al. 2013. Processes and patterns of oceanic nutrient limitation. Nat. Geosci. 6:701–10. doi:10.1038/ngeo1765.
- Nowak, B. 1998. Contents and relationship of elements in human hair for a non-industrialised population in Poland. Sci. Total Environ. 209 (1):59–68. doi:10.1016/S0048-9697(97)00298-2.
- Nriagu, J. O. 1979. Global inventory of natural and anthropogenic emissions of trace metals to the atmosphere. Nature 279:409–11. doi:10.1038/279409a0.
- Nriagu, J. O. 1989. A global assessment of natural sources of atmospheric trace metals. Nature 338 (6210):47–49. doi:10.1038/338047a0.
- Pacyna, J. M. 1984. Estimation of the atmospheric emissions of trace elements from anthropogenic sources in Europe. Atmos. Environ. 18:41–50. doi:10.1016/0004-6981(84)90227-0.
- Pacyna, J. M., and E. G. Pacyna. 2001. An assessment of global and regional emissions of trace metals to the atmosphere from anthropogenic sources worldwide. Environ. Rev. 9:269–98. doi:10.1139/a01-012.
- Pakkanen, T. A., K. Loukkola, H. Korhonen, M. Aurela, T. Makela, R. E. Hillamo, P. Aarnio, T. Koskentalo, A. Kousa, and W. Maenhut. 2001. Sources and chemical composition of atmospheric fine and coarse particles in the Helsinki area. Atmos. Environ. 35:5381–91. doi:10.1016/S1352-2310(01)00307-7.
- Paytan, A., K. R. M. Mackey, Y. Chen, I. D. Lima, S. C. Doney, N. Mahowald, R. Labiosa, and A. f. Post. 2009. Toxicity of atmospheric aerosols on marine phytoplankton. Proc. Natl. Acad. Sci. 106 (12):4601–05. doi:10.1073/pnas.0811486106.
- Pekey, B., Z. Bozkurt, H. Pekey, G. Dogan, A. Zararsız, N. Efe, and G. Tuncel. 2010. Indoor/outdoor concentrations and elemental composition of PM10/PM2.5 in urban/industrial areas of Kocaeli City, Turkey. Indoor Air 20 (2):112–25. doi:10.1111/j.1600-0668.2009.00628.
- Quiterio, S. L., C. R. S. daSilva, G. Arbilla, and V. Escaleria. 2004. Metals in airbone particulate matter in the industrial district of Santa Cruz, Rio de Janeri, in an annual period. Atmos. Environ. 38:321–31. doi:10.1016/j.atmosenv.2003.09.017.
- Rastogi, N., and M. M. Sarin. 2009. Quantitative chemical composition and characteristics of aerosols over western India: One‐year record of temporal variability. Atmos. Environ. 43 (22–23):3481–88.
- Reimann, C., P. Filzmoser, R. Garrett, and R. Dutter. 2008. Statistical data analysis explained: Applied environmental statistics with R. New York: Wiley.
- Saad, M., M. Bibi, M. Masmoudi, S. Chevaillier, and S. Alfaro. 2018. Compositional variability of the aerosols collected in Sfax (Central Tunisia). J. Atmos. Sol. Terr. Phys. 172:53–62. doi:10.1016/j.jastp.2018.03.011.
- Sadasivan, S., B. S. Negi, and U. C. Mishra. 1984. Composition and sources of aerosols at Trombay, Bombay. Sci. Total. Environ. 40:279–86. doi:10.1016/0048-9697(84)90357-7.
- Samara, C., and D. Voutsa. 2005. Size distribution of airborne particulate matter and associated heavy metals in the roadside environment. Chemosphere 59:1197–206. doi:10.1016/j.chemosphere.2004.11.061.
- Schroth, A. W., J. Crusius, E. R. Sholkovitz, and B. C. Bostick. 2009. Iron solubility driven by speciation in dust sources to the ocean. Nat. Geosci 2:337–40. doi:10.1038/ngeo501.
- Shah, M. H., N. Shaheen, M. Jaffar, A. Khalique, S. R. Tariq, and S. Manzoor. 2006. Spatial variations in selected metal contents and particle size distribution in an urban and rural atmosphere of Islamabad, Pakistan. J. Environ. Manag. 78:128–37. doi:10.1016/j.jenvman.2005.04.011.
- Singal, S. P., and R. Prasad. 2005. Analytical study of some observed micrometeorological data. J. Air. Pollut. Cont. 1:44–49.
- Singh, G., and A. Perwez. 2015. Depreciation in ambient air quality in iron ore mining region of Goa. Curr. World Environ. 10 (1):149–16. doi:10.12944/CWE.10.1.17.
- Srinivas, B., and M. M. Sarin. 2013. Atmospheric dry-deposition of mineral dust and anthropogenic trace metals to the Bay of Bengal. J. Mar. Syst. 126:56–68. doi:10.1016/j.jmarsys.2012.11.004.
- Sullivan, R., and I. Woods. 2000. Using emission factors to characterise heavy metal emissions from sewage sludge incinerators in Australia. Atmos. Environ. 34:4571–77. doi:10.1016/S1352-2310(00)00121-7.
- Sweet, C. W., and S. J. Vermette. 1993. Sources of toxic element in urban air in Illinois. Environ. Sci.Technol. 27:2502–10. doi:10.1021/es00048a030.
- Tayanc, M. 2000. An assessment of spatial and temporal variation of Sulfur Dioxide levels over Istanbul, Turkey. Environ. Pollut. 107:61–69. doi:10.1016/S0269-7491(99)00131-1.
- Tripathee, L., S. Kang, D. Rupakheti, Q. Zhang, R. M. Bajracharya, C. M. Sharma, J. Huang, A. Gyawali, R. Paudyal, and M. Sillanpää. 2016. Spatial distribution, sources and risk assessment of potentially toxic trace elements and rare earth elements in soils of the Langtang Himalaya, Nepal. J. Environ. Earth Sci. 75:1332. doi:10.1007/s12665-016-6140-1.
- Tripathee, L., S. Kang, D. Rupakheti, Z. Cong, Q. Zhang, and J. Huang. 2017. Chemical characteristics of soluble aerosols over the central Himalayas: Insights into spatiotemporal variations and sources. Environ. Sci. Pollut. Res. Int. 31:24454–72. doi:10.1007/s11356-017-0077-0.
- Tripathee, L., S. Kang, J. Huang, C. M. Sharma, M. Sillanpa¨a¨, J. Guo, and R. Paudyal. 2014. Concentrations of trace elements in wet deposition over the central Himalayas, Nepal. Atmos. Environ. 95:231–38. doi:10.1016/j.atmosenv.2014.06.043.
- Tripathi, R. M., A. V. Kumar, S. T. Manikandan, S. Bhalke, T. N. Mahadevan, and V. D. Puranik. 2004. Vertical distribution of atmospheric trace metals and their sources at Mumbai, India. Atmos. Environ. 38:135–46. doi:10.1016/j.atmosenv.2003.09.006.
- Usher, C. R., A. E. Michel, and V. H. Grassian. 2003. Reactions on Mineral Dust. Chem. Rev. 103:4883–940. doi:10.1021/cr020657y.
- Van Malderen, H., S. Hoornaert, and R. VanGrieken. 1996. Identification of individual aerosol particles containing Cr, Pb and Zn above the North Sea. Environ. Sci. Technol. 30:489–98. doi:10.1021/es950205l.
- Viana, M., T. A. J. Kuhlbusch, X. Querol, A. Alastuey, R. M. Harrison, P. K. Hopke, W. Winiwarter, S. ValliusSzidat, A. S. H. Prevot, C. Hueglin, et al. 2008. Sources apportionment of PM in Europe: Ametal analysis of methods and results. J. Aerosol Sci. 39:827–49. doi:10.1016/j.jaerosci.2008.05.007.
- Wahid, A. 2006. Productivity losses in barley attributable to ambient atmospheric pollutants in Pakistan. Atmos. Environ. 40 (28):5342–54. doi:10.1016/j.atmosenv.2006.04.050.
- Wrobel, A., E. Rokita, and W. Maenhaut. 2000. Transport of traffic related aerosols in urban areas. Sci. Total Environ. 257:199–211. doi:10.1016/S0048-9697(00)00519-2.
- Zhang, J., and C. L. Li. 2002. Riverine composition and estuarine geochemistry of particulate metals in China-Weathering features,anthropogenic impact and chemical fluxes. Estu. Coast. Shelf Sci. 54 (6):1051–70. doi:10.1006/ecss.2001.0879.
- Zhang, X., G. Zhang, G. Zhu, D. Zhang, Z. An, T. Chen, and X. Huang. 1996. Elemental tracers for Chinese source dust. Sci. China Ser. D: Earth Sci. 39:512–21.