
 ?Mathematical formulae have been encoded as MathML and are displayed in this HTML version using MathJax in order to improve their display. Uncheck the box to turn MathJax off. This feature requires Javascript. Click on a formula to zoom.
ABSTRACT
Manure-drying system using exhausted air from laying hen houses or ambient air has been extensively used in China to dewater the manure for easy transportation and to reduce pathogen levels prior to land application. Due to the climate influence or inappropriate setting of technological parameters, there are some issues in this manure-drying system, such as low dehydration rate, high energy consumption, and high ammonia emission. A purpose-designed experimental drying apparatus was set up to simulate the commercial manure drying system. Drying experiments were carried out to assess the impacts of hot air temperature (15–35°C), air velocity (0.6–1.8 m/s) and manure layer thickness (60–140 mm) on fan’s energy consumption, dehydration rate, and nitrogen loss rate. The response surface analysis method and sub-stepping method was used to analyze the relationships between the response variables and the influence factors. The drying curves were drawn, and the quadratic regression mathematical models that described the relations between the experimental indices and the influence factors were established. The optimal combination of technological parameters for drying laying-hen manure was obtained through conducting a multi-objective function optimization by function-expected optimization. The optimal parameters are as follows: hot air temperature of 35°C, air velocity of 1.60 m/s, and manure layer thickness of 85 mm. The results also indicate that raising the hot air temperature increased the value of synthesis objective function when the hot air temperature was in 26–35°C. The results can provide a theoretical basis for low-temperature drying of laying-hen manure in actual production.
Implications: A large amount of poultry manure is produced yearly in China, which has become a tremendous pressure on the environment when it cannot be utilized as resources. A more sustainable solution using the residual heat from the poultry house ventilation or ambient hot air has been widely used in China. This drying method can significantly reduce energy consumption compared to the traditional way. However, due to the influence of climate or inappropriate setting of technological parameters, issues such as high energy consumption and high ammonia emission still exist in this method. It is necessary to optimize the low-temperature drying process of laying-hen manure, to reduce energy consumption and nitrogen loss rate.
Introduction
A large amount of laying-hen manure is produced yearly in China, which has become a tremendous environmental challenge when it cannot be utilized as resources. An improper or untimely handling method of manure can result in massive discharge of ammonia, which is a major source of air pollution (Williams Citation1995). It is necessary to subject laying-hen manure to suitable treatments including storage and handling in order to minimize the risk of disease transmission and environmental pollution. One of the major issues of laying-hen manure treatments is the high ammonia emission, which has an impact on the environment. Since it has a relatively short mean residence life (5 days) in the atmosphere, ammonia gas for the most part is quickly returned to the earth via rainfall and dry fall by combining with water and acid forming gases such as sulfur dioxide (Schlesinger Citation1997). Moreover, NH3 is a precursor of fine particulate matter (Gay et al. Citation2003), which also attributes to water eutrophication (Capareda, Parnell, and McGee Citation2017; Ndegwa et al. Citation2008). Available ammonia in the air plays a vital role on the formation of particulate sulfate and nitrate during the haze episode (Ye et al. Citation2011).
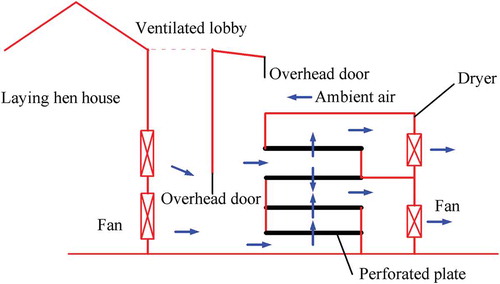
Thermal convective drying is an effective method to remove moisture and reduce ammonia emission from laying-hen manure. Traditional drying of laying-hen manure has high energy consumption. A more sustainable solution using the residual heat from the poultry house ventilation or ambient hot air has been widely used in China (Li et al. Citation2019). This manure drying system is usually installed at the end of a laying hen house, in which manure is dried using the exhaust air from the laying hen house (in winter) or ambient hot air (in summer) through multiple layers of manure droppings spread onto perforated conveyor metal plates. The schematics of manure drying system are illustrated in . The hot air temperature in this manure drying system is 10–35°C for the whole year. The drying process can significantly reduce energy consumption compared to the traditional way, such as hot-air drying using burning coal and electrical-heating drying. However, due to the influence of climate or inappropriate setting of technological parameters, issues such as low dehydration rate, high energy consumption, and high ammonia emission still exist in this manure-drying system. It is necessary to optimize the low-temperature drying process of laying-hen manure, to reduce energy consumption and nitrogen loss rate, and to improve the dehydration rate.
Figure 1. Schematic of manure drying system.
Winkel, Mosquera, and Aarnink (Citation2017) obtained the associations between ammonia concentration and manure dry matter content in field experiment, but the measurement at a certain spot in the manure drying system and at a certain moment during the drying process does not take into account what happened to the manure prior to the measurement and the presented relationships might be confounded with other factors during the drying process. It was advisable to study the influence of various factors on manure drying in lab conditions. In fact, many lab experiments have been conducted on laying-hen manure drying. Aboltins and Kic (Citation2015) informed that the air velocity and drying temperature had a strong influence on the drying time and water removal. Liska and Kic (Citation2011) studied the drying process of laying hen manure at various temperatures. Ghaly and Macdonald (Citation2012a) reported that the moisture decay constant was affected by the drying temperature and the depth of the manure layer.
According to the findings of the above-mentioned published literature, which only considered the influence of single factor on drying process and did not consider the interaction of various factors. Concerning the proper combinations of control factors for optimum responses in manure drying, limited investigations have been conducted up to now. It can also be seen from the above literature that there were few studies on energy consumption and nitrogen loss in manure drying process. As energy consumption and nitrogen loss were also concerned issues of farmers during the laying-hen manure drying, it was necessary to take the nitrogen loss and energy consumption as response target for optimization of manure drying. Consequently, the overall purpose of this research was to optimize the drying conditions of laying-hen manure in low-temperature drying and response surface methodology (RSM) was applied as the approach for the optimization.
RSM has been widely used in recent years to predict the response to the untested sets of variables and study the interactions among those factors. Many studies on optimization of hot air-drying process have been accomplished with RSM (Al-attab and Zainal Citation2014; Gokhale and Lele Citation2014; Somayeh et al. Citation2014; Zafer and Filiz Citation2009). Commonly, RSM is utilized for selecting operating conditions to obtain purpose requirement. Implementing RSM can achieve the optimum parameters for minimum drying time and energy consumption and can decrease the number of experiments (Majdi and Esfahani Citation2018). Majdi, Esfahan, and Mohebbi (Citation2019) dried apple slices by convective drying using RSM. They optimized drying time, energy consumption and shrinkage. Air temperature (70–90°C), air velocity (4–5 m/s), and apple slice geometry (circle, square, and triangle) were investigated as independent variables in their work. They found the optimal conditions of combined optimized responses were 90°C inlet temperature, 5 m/s inlet velocity, and square geometry which designated by maximum desirability function (D = 0.781). Zhang et al. (Citation2012) studied the effect of drying temperature, material load and airflow rate on dehydration rate, energy consumption and protein retention rate in hot-air convective drying of ginkgo fruit; they analyzed influences of various variables and their interactions on response variables using a response surface method and obtained optimal parameters.
In this study, RSM was adopted to optimize the parameters during the low-temperature drying process of laying-hen manure. Hot air temperature (15–35°C), air velocity (0.6–1.8 m/s), and manure layer thickness (60–140 mm) were used as influence factors, and nitrogen loss rate, dehydration rate, and energy consumption were used as response target to study the drying process of laying-hen manure. Besides, the comprehensive objective function was adopted to solving multi-target optimization problems and make the obtained parameters better.
The aims of this research were (1) to observe the effects of hot air temperature, air velocity and manure layer thickness on fan’s energy consumption, dehydration rate and nitrogen loss rate during the low-temperature drying of laying-hen manure; (2) to determine the optimal parameters for the low-temperature air drying of laying-hen manure.
Materials and methods
Laying-hen manure samples
Manure was collected from the caged laying-hen in an experimental barn at Shangzhuang experimental station of China Agricultural university in Beijing. The manure cleaning interval was 48 h.
The manure drying experiment was carried out continuously at 55–58 weeks of bird age. For each batch of experiment, raw manure sample was collected from cages randomly while cleaning the manure in the morning; most of the samples were quickly used for drying experiment at the experimental station, and some of the raw manure samples were stored in a plastic bottle and transported on ice to the laboratory for the analysis of manure properties. showed the manure properties analyzed at 55–58 weeks of bird age. The manure properties did not significantly change with the age of the birds (p > .05), and the manure collection time did not affect the results in this study.
Table 1. Properties of raw manure samples.
Experimental drying apparatus
The drying experiments were carried out in an experimental cross-flow drying apparatus (), which was designed to simulate the commercial manure drying system (MDS). It basically consisted of two centrifugal fans an electric heater, a humidifier, humidity and temperature sensor, and proportional controller. Ambient air was heated up to the required temperature by an electrical heating device and can be also humidified by the humidifier. Hot air temperature and relative humidity were controlled by the proportional controller. Heated air went through the bed of laying-hen manure which lies on the three perforated trays (Ф = 120mm), and the manure samples were placed in perforated trays with the layer thickness of 60–140 mm.
Figure 2. Experimental dryer unit. 1. fan for force convection; 2. humidifier; 3. electric heater; 4. Humidity & Temperature Sensor and proportional controller; 5. manure sample on perforated trays.
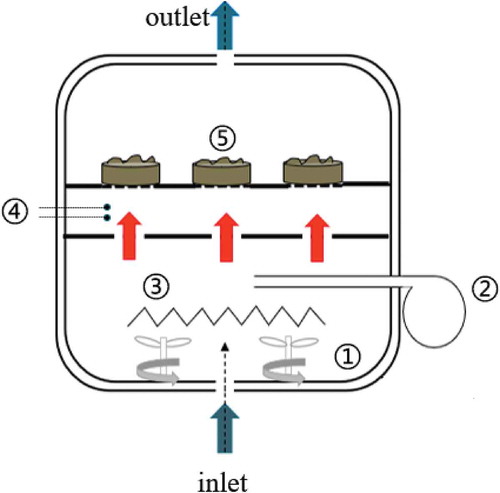
The drying operations were carried out under the conditions of maintained hot air temperature at 15–35°C, relative humidity at 30%–35%, and the air velocity just beneath the perforated tray constantly at 0.6–1.8 m/s, which were usually adapted in the commercial system. The air velocity was measured with a hot wire anemometer (Model: KA33, Nippon Kanomax Inc, Japan, ±0.1 m/s accuracy). The drying air with set temperature, relative humidity, and air velocity went through perforations at the bottom of three trays containing the manure samples. During drying, the three trays were quickly taken out every 1 h, and an analytical balance with an accuracy of ± 0.1 g (Model BSA124S, Sartorius, Germany) was used to measure the timely weight. This operation was carried out rapidly, and it was presumed that such brief interruptions did not interfere with the drying process. Some manure samples were then placed in a drying oven at a temperature of 105°C to measure the initial moisture ratio of manure samples. The timely moisture ratio (wet basis) was calculated as follows:
where is the timely weight (g),
is the initial weight (g), and
is the initial moisture ratio of manure samples.
The moisture ratio (dry basis) can be calculated using Equation (2)
When the moisture ratio reached about 20%, the drying runs were terminated.
Experiment design
The central composite rotatable design (CCRD) was used to design the drying experiments. Three independent variables (hot air temperature, °C),
(air velocity, m/s), and
(manure layer thickness, mm) at five levels, for three dependent or response variables Y1 (fan’s energy consumption, kW·h/kg), Y2 (dehydration rate, g/h), and Y3 (nitrogen loss rate, %) were generated. displays the coded values for the levels of experimental factors. The full model used to describe the dependent or response variable (Yn) involves the linear or main interaction and curvature effects as shown in Equation (3):
Table 2. Levels of experimental factors and coded values.
where ,
,
,
,
,
,
,
,
, and
are the regression coefficients;
,
, and
are the coded values of the independent variables (hot air temperature, air velocity, and manure layer thickness).
Data measurement and parameter calculation
Fan’s energy consumption (Y1) refers electricity energy consumption of per unit mass of laying-hen manure during the whole drying process (kW·h/kg). At the beginning and end of each trial, the readings of electric meter (±0.05 kW·h accuracy) were recorded.
Dehydration rate (Y2) refers the rate of moisture removal from the laying-hen manure during the whole drying process (g/h):
where is the initial weight of manure sample at the start of drying process (g),
is the weight of manure sample when the moisture ratio reached about 20% (g), and T is the drying time (h).
Nitrogen loss rate (Y3) refers the nitrogen loss rate during the whole drying process (%):
where and
are the total nitrogen concentration (g/kg dry weight) before and after drying, respectively. Before the beginning of each trial, approximately 15 g of manure was retrieved using a clean hand trowel from each tray. Similarly, at the end of each trial, about 15 g of dried manure was retrieved from each tray. The samples were placed in a container and thoroughly mixed to form a composite sample, which was then stored in a plastic bottle and transported on ice to the laboratory to analyze the nitrogen concentration. Total nitrogen concentrations of manure samples were determined by Kjeldahl digestion with an accuracy of ± 0.5% (KDY 9810, Kaihong Weiye Science, Beijing).
Experimental uncertainty
Errors and uncertainties are inherent in both the instrument and the process of making the measurement, which mainly arise from instrument selection, instrument condition, instrument calibration, environmental conditions, observation and reading, and test planning (Akpinar, Bicer, and Midilli Citation2003). Uncertainty analysis is needed to prove the accuracy of the experiments. In the present study, the temperatures, air velocity, manure weight, total nitrogen concentrations, and electrical powers were measured with appropriate instruments as explained in the above section. The results of dehydration rate and nitrogen loss rate were calculated from these measured parameters. The uncertainty of dehydration rate and nitrogen loss rate was calculated as follows using the method described by Holman (Citation1994):
where is the uncertainty and
,
,
,
are the uncertainties of the independent variables, Y is the function of the independent variables, and
,
,
,
are the independent variables.
The uncertainties occurring are presented in .
Table 3. Uncertainties of the parameters during drying of manure.
Results and discussion
Experimental design according to CCRD (Liu Citation2005), a random combination of the test sequence, the different runs of test results are shown in .
Table 4. Central composite rotatable design for three factors and results of responses values.
Drying behavior
According to the test groups of and the weight of manure samples tested per hour. Drying curves at different parameters () were drawn to observe the effect of drying temperature, air velocity, and manure layer thickness on the low-temperature drying process of laying-hen manure.
Figure 3. (a) Drying curves at different hot air temperature with the manure layer thickness of 100 mm and the air velocity of 1.2 m/s. (b) Drying curves at different air velocity with the manure layer thickness of 100 mm and the hot air temperature of 25°C. (c) Drying curves at different manure layer thickness with the hot air temperature of 25°C and the air velocity of 1.2 m/s.
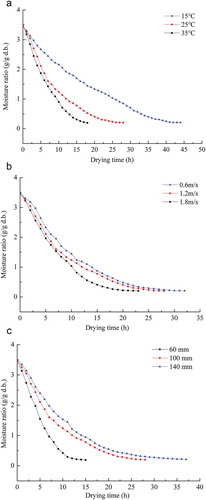
illustrates the drying curves at different temperature of 15, 25, and 35°C with the manure layer thickness of 100 mm and the air velocity of 1.2 m/s. The moisture content of the samples decreased with time. (It was assumed that the total amount of dried chicken manure remained constant over time.) Drying kinetics were clearly affected by drying temperature: the higher drying temperature, the faster the loss of mass. The drying time required to reduce the moisture ratio of manure from the initial to the final for different temperatures was 44, 28, and 18 h, respectively.
presents the drying curves of manure at different air velocity of 0.6, 1.2, and 1.8m/s with a manure layer thickness of 100 mm and drying temperature of 25°C. As it can be observed from , it took 32, 28, and 23 h to reduce moisture ratio of manure from the initial to final, respectively. The difference on drying time that was caused by the air velocity was much smaller than the hot air temperature. On the other hand, drying air velocity had smaller specific effects on drying time than the hot air temperature had.
Likewise, shows the drying curves of manure at different manure layer thickness of 60, 100, and 140 mm with air velocity of 1.2 m/s and drying temperature of 25°C. The thinner the manure layer, the shorter the heat transfer distance, resulting in the shorter drying time required to drive off the moisture. The time required to dry the 140 mm manure layer was more than that of 100 mm and 60mm by about 32.1% and 146.6%, respectively. Similar drying curves were reported by Ghaly and MacDonald (Citation2012b) and Aboltins and Kic (Citation2015) for poultry manure drying.
Analysis of variance (ANOVA)
For the test results (), the stepwise regression method was used to seek the optimization equation of the predicted model, and the significant level was set as 0.10. The analysis of variance (ANOVA) is observed from . The F value >4.77 implied that the three models were significant. The “Lack of Fit” was small (Flf < 5.05), which implied that the “Lack of Fit” of the three models were not significant relative to the pure error. R2 values of Y1, Y2, and Y3 were 0.899, 0.865, and 0.826, respectively, showing a good correlation between experimental data and models. The ANOVA result shows that the models predict well on the fan’s energy consumption, dehydration rate, and nitrogen loss rate of low-temperature drying process of laying hen manure.
Table 5. ANOVA for the regression response surface model.
Analytical of the interaction terms of each response
A response surface graph is a 3D surface graph composed of response values and interaction terms. In the 3D curved graph, the steeper the curve, the more significant the influence of this factor on sensory quality. The respond surface was given based on the regression equation in .
Since the purpose of this test was to simulate drying laying hen manure by using the residual heat from the house ventilation, the energy consumption in the drying process was mainly from the fans. In this experiment, only the fan’s energy consumption was considered, while the energy consumption of the electric heating tubes was not taken into account. With regard to the hot air temperature, the air velocity and the manure layer thickness. If one of these three factors was taken as zero level, the interactive impact on the fan’s energy consumption caused by the other two factors were shown in –c. It can be found that the fan’s energy consumption increased with the increase of the manure layer thickness and decreased with the increase of the hot air temperature, within the test range. The reasons may possibly lie in the following aspects: the larger the manure layer thickness, the longer the drying time, and the larger the fan’s energy consumption; the higher the hot air temperature, the shorter the drying time, and the smaller the fan’s energy consumption. However, the general hot air drying did not accord with the above rules. Different drying materials and methods affect the experimental results. Zhang, Wang, and Zhang (Citation2014) found that the energy consumption per unit mass increased as hot air temperature increased. Motevali, Minaei, and Khoshtagaza (Citation2011) concluded that, in the process of drying pomegranates with hot air, drying time was reduced and the energy consumption was decreased by increasing the temperature. Majdi and Esfahani (Citation2019) observed that lower energy consumption obtained at lower temperature and velocity while these conditions had the opposite effect on the drying time in the drying process of apple slice.
Figure 4. The effects of (a) hot air temperature and air velocity, (b) hot air temperature and manure layer thickness, (c) manure layer thickness and air velocity on response surface plots of fan’s energy consumption.
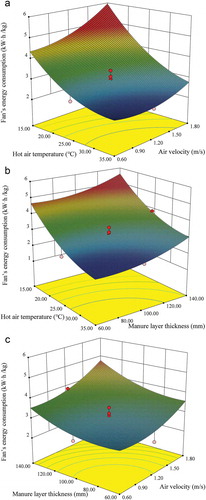
The fan used in the test was a variable frequency fan, and the power of the fan was related to the air velocity. The greater the power was, the higher its energy consumption would be. When the air velocity was at a higher level, the fan’s energy consumption increased with the increase of the air velocity. When the air velocity was at a lower level, the influence of the air velocity on the fan’s energy consumption was not significant.
As shown in , the interactions among various factors were significant. F value of a factor (not listed in the article) in the quadratic regression model indicated the degree of influence of that factor on the fan’s energy consumption. The larger F value of a factor, the more significant the influence of that factor. According to the size of F value of each factor in the model, the order of the influence intensity of the factors on the energy consumption of the fans from high to low obtained as follows: the hot air temperature, the air velocity, and the manure layer thickness.
With regard to the hot air temperature, the air velocity, and the manure layer thickness, if one of these three factors was taken as zero level, the interactive impact on the dehydration rate caused by the other two factors are those shown in –c. It was found that the dehydration rate increased with the increase of the hot air temperature and air velocity within the test range. The main reasons reside in the following aspects: it was able to provide more heat with the increased temperature of the hot air, which would cause the water to evaporate. The effects of temperature on the dehydration rate of chicken manure agreed with the similar research by Ghaly and Alhattab (Citation2013). The reason why the increase in the air velocity accelerated the evaporation rate of water mainly was that, as the air velocity increased, the gradient value of the velocity in the boundary layer became larger, and the gradient value of the water content also became larger. Therefore, the evaporation rate of water on the surface of the laying-hen manure increased. When the air velocity continued to increase, the resistance to the water evaporation on the surface of the laying-hen manure decreased continuously. When the resistance to the water evaporation on the surface of the laying-hen manure was less than the resistance to the internal water migration, the dehydration rate was mainly affected by the diffusion rate of water inside the laying-hen manure, and the influence of the air velocity on the drying process became very small. Similar results have been reported by several researchers (Aboltins and Kic Citation2015; Wu et al. Citation2015). The combined effect of temperature and air velocity agreed with the study by Erbay and Icier (Citation2009) for drying olive leaves in a temperature and air velocity range of 50–70°C and 0.5–1.5 m/s. They observed that the highest dehydration rate was with highest temperature and not with the highest air velocity.
Figure 5. The effects of (a) hot air temperature and air velocity, (b) hot air temperature and manure layer thickness, (c) manure layer thickness and air velocity on response surface plots on dehydration rate.
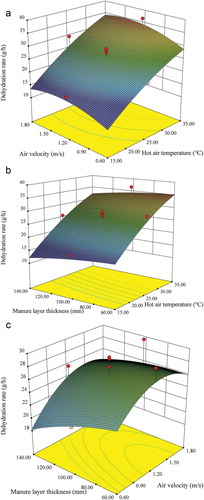
The thickness of the manure layer mainly affected the migration and diffusion of the water molecules from inside the laying-hen manure to the surface. The thicker the manure layer, the longer the migration time of the water molecules from the inside to the surface, and the lower the migration rate. As shown in , when the thickness of the manure layer was at a lower level, the decrease of dehydration rate was not obvious when the manure layer thickness increased. This was probably due to the fact that the migration rate of the water molecules inside the laying-hen manure was basically the same as the diffusion rate of water on the surface. Similar influence rule has been reported by Abdel-Galil (Citation2007).
As shown in , the interactions between the manure layer thickness and the hot air temperature were not significant. However, the interactions between the other interactions were significant. According to the size of F value of each factor in the model, the order of the influence intensity of the factors on the dehydration rate from high to low was obtained as follows: the hot air temperature, the manure layer thickness, and the air velocity.
Likewise, one of the three influence factors was taken as zero. The interactive impact on the nitrogen loss rate caused by the other two factors is shown . It was found that the nitrogen loss rate increased with the increase of the thickness of the manure layer and decrease of the air velocity within the test range. However, the temperature of the hot air was not positively correlated with the nitrogen loss rate. The main reasons lie in the following aspects: as the thickness of the manure layer increased or the air velocity decreased, the drying time increased, leading to the decomposition of more organic nitrogen through the aerobic fermentation. When the temperature of the hot air was at a lower level, as the temperature of the hot air increased, the ammonium nitrogen in the laying-hen manure became more volatile, and the activities of the microorganisms were enhanced, leading to the decomposition and volatilization of more organic nitrogen into ammonium nitrogen (Koerkamp Citation1994; Weast, Astle, and Beyer Citation1988). As the temperature continued to increase, a higher drying temperature (above 30°C) was able to rapidly reduce the water content in the laying-hen manure to lower than 30%, resulting in the quick decrease in the activities of the microorganism, thus preventing the laying-hen manure against further aerobic fermentation and leading to fixation of more organic nitrogen in the laying-hen manure (Nahm Citation2003). It was observed from that when the hot air temperature was in 26–35°C, raising the temperature accelerated the dehydration rate and reduced fan’s energy consumption, but also decreased the loss of nitrogen. The universal nitrogen loss rate found in this study was in the range of values previously reported (Koerkamp Citation1994). However, the effect of temperature and manure layer thickness did not agree with the study by Ghaly and Alhattab (Citation2013) for drying chicken manures in a temperature and manure layer thickness of 40–60°C and 1–3 cm. Highest nitrogen loss happened at the highest temperature and the thickest manure layer has been found in their study.
Figure 6. The effects of (a) hot air temperature and air velocity, (b) hot air temperature and manure layer thickness, (c) manure layer thickness and air velocity on response surface plots on nitrogen loss rate.
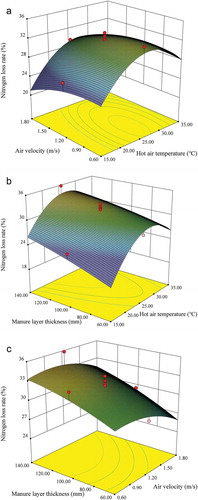
As shown in , the interactions among various factors were significant. According to the size of the F value of each factor in the model, the order of the influence intensity of the factors on the nitrogen loss rate from high to low was obtained as follows: the manure layer thickness, the hot air temperature, and the air velocity.
Optimization of the drying parameters
On the basis of the above analysis on the response surface of the three objective parameters, the following conclusion was obtained: if the manure layer was too thick, the dehydration rate would reduce and the fan’s energy consumption would increase. However, if the temperature of the hot air was too low, the fan’s energy consumption would increase, the dehydration rate would become lower, and the drying time would be longer, indirectly resulting in the decomposition of more organic nitrogen through the aerobic fermentation. Therefore, an optimization of multiple objectives of the above three objective functions were carried out in this study. The optimal combination of the drying process parameters which satisfied the three objective functions were obtained.
Taking the extremum of the three objective functions:
The constraint conditions were as follows:
This was a multi-objective nonlinear optimization problem. For the dehydration rate, a greater value was better, while for the fan’s energy consumption and nitrogen loss rate, a smaller value was better. Also, the three objective functions between each dimension were different.
In terms of the evaluation function deduced from efficiency coefficients, the original multi-objective optimization problem was converted into one with a single objective function. The simplified model was solved respectively under the best case and worst case of the interval constraints, and then the ranges of optimal solution and optimal values were easily obtained (Wang and Qiu Citation2013).
When are as small as possible, efficiency coefficients di (x) ware defined as Equation (9):
Therefore,
When are as large as possible, efficiency coefficients di (x) are defined as Equation (11):
Therefore,
where and
.
The minimum value of objective functions Y1 and Y3 and the maximum value of Y2 were converted into the maximum value of efficacy coefficients d1, d2, and d3.
The synthesis objective function Y was determined by linear weighting method. The synthesis objective function was calculated using Equation (13):
where, a, b, and c are the weighting coefficients of d1, d2, and d3.
Nitrogen loss rate was taken as the main index, dehydration rate and fan’s energy consumption as the secondary index, in this article a = 0.3, b = 0.3, c = 0.4. In specific applications, the corresponding weighting coefficient was obtained according to different requirements, but they must satisfy the equation a + b + c = 1. Therefore, Equation (13) was written as follows:
The synthesis objective model Y was further obtained:
It was obtained from ANOVA that the F value of 9.22 implied that models were significant. The “Lack of Fit” was small (Flf = 5.01), which implied that the “Lack of Fit” was not significant relative to the pure error. R2 value of Y was 0.863, showing a good correlation between experimental data and models.
The multi-objective extremum problem was transformed into a single-objective extremum problem:
The constraint conditions remained the same as original constraint conditions.
The maximum of was obtained by software Origin 8.5. The optimal parameters were as follows: hot air temperature of 35°C, air velocity of 1.60 m/s, and manure layer thickness of 85 mm. Under these conditions, the predicted values of response variables were calculated as follows: fan’s energy consumption was 2.31 kW·h/kg, the dehydration rate was 35.06 g/h, and the nitrogen loss rate was 26.6%. By analyzing the results of and the synthesis objective function, the results also indicated that raising the hot air temperature increased the value of synthesis objective function, when the hot air temperature was in 26–35°C. At the same time, the synthesis objective function can be used to calculate the optimal air flow rate and manure layer thickness at a fixed temperature, providing basis for the setting of drying parameters.
Model validation
In order to verify the reliability of the model, three tests were carried out with the above optimal process parameters, and the test results are shown in .
Table 6. Validation results of optimization scheme.
The test results show that the relative errors of fan’s energy consumption, dehydration rate, and nitrogen loss rate between predicted value and actual value were 3.03%, 4.73%, and 3.38%, respectively, which were all less than 5%. It showed that the regression model was feasible to analyze and to predict the process of laying-hen manure drying at low-temperature.
Overall, the effects of different hot air temperature, air velocity, and manure layer thickness on fan’s energy consumption, dehydration rate, and nitrogen loss rate were studied in this article. The conclusion of this article had a certain theoretical guiding role for the theoretical study of laying-hen manure drying in the future and the setting of drying parameters when the manure drying system was used in farm. However, this conclusion was based on the laboratory simulated drying equipment, and further optimization needed to be carried out in the pilot-scale drying system installed on farm, and this article only analyzed the fan’s energy consumption, but did not analyze the heat loss and so on. The evaluation standard cannot reflect the internal heat loss of the system and cannot evaluate the sustainability of the equipment. Exergy analysis provides a tool for a more realistic view between energy losses to the environment and internal irreversibility in the drying process (Aghbashlo et al. Citation2013), there have been many studies on the optimization of drying system by means of exergy analysis (Akpinar, Midilli, and Bicer Citation2005; Erbay and Icier Citation2009; Ma, Fang, and Li Citation2017; Sheikhshoaei et al. Citation2019). Zohrabi et al. (Citation2019) indicated that the exergy concept could be taken into account as a reliable tool for improving the performance of drying systems. Therefore, the energy utilization evaluation and parameter optimization of manure drying system can be carried out by means of energy analysis in the next pilot test. At the same time, the economic feasibility and environmental sustainability of manure drying system will also be studied.
Conclusions
In this article, the effect of process parameters such as hot air temperature, air velocity, and manure layer thickness on the low-temperature drying process of laying-hen manure was studied. Within the test range, the energy consumption of the fans increased with the increase of the manure layer thickness and decreased with the increase of the hot air temperature and air velocity. The interactions among various factors were significant, and the hot air temperature was the most important factor affecting fan’s energy consumption. The dehydration rate increased with the increase of the hot air temperature and air velocity. The hot air temperature was the most important factor affecting dehydration rate. The nitrogen loss rate increased with the increase of the thickness of the manure layer. The velocity and temperature of the hot air were not positively correlated with the nitrogen loss rate, the interactions among various factors were significant and the manure layer thickness was the most important factor affecting nitrogen loss rate. The quadratic regression mathematical models predicted well on the relations between the experimental indices and the influence factors.
The optimal parameters were as follows: hot air temperature of 35°C, air velocity of 1.60m/s, and manure layer thickness of 85 mm. The results also indicated that raising the hot air temperature increased the value of synthesis objective function, when the hot air temperature was in 26–35°C.
The synthesis objective function can also provide theoretical basis for the setting of drying parameters.
Nomenclature
| = | Moisture ratio (wet basis) of manure samples (%) | |
| = | Moisture ratio (dry basis) of manure samples (g/g) | |
| = | The timely weight of manure samples (g) | |
| T | = | Drying time (h) |
| = | The initial weight of manure samples (g) | |
| = | The end weight of manure sample (g) | |
| = | The initial moisture ratio of manure samples (%) | |
| Yn | = | Response variable |
| = | Independent variable | |
| = | Total nitrogen concentration before drying (g/kg dry weight) | |
| = | Total nitrogen concentration after drying (g/kg dry weight) | |
| Y | = | Synthesis objective function |
| = | Uncertainty | |
| di (x) | = | Efficiency coefficient |
| a, b, c | = | Weighting coefficient |
Acknowledgments
This study was funded by the China Agricultural Research System (CARS-40) and National Key Research and Development Program from the Ministry of Science and Technology of China (2018YFD0500700). The authors would also like to thank Dongli Zhan for the help of data recording and the suggestion from Dr. Xinfeng Wang (China Agricultural University).
Disclosure statement
No potential conflict of interest was reported by the authors.
Additional information
Funding
Notes on contributors
Xuanyang Li
Xuanyang Li is a Ph.D. candidate in the College of Water Resources and Civil Engineering, China Agricultural University, Beijing, China.
Weichao Zheng
Weichao Zheng and Qin Tong are associate professors in the College of Water Resources and Civil Engineering, China Agricultural University, Beijing, China.
Baoming Li
Baoming Li is a professor in the College of Water Resources and Civil Engineering, China Agricultural University, Beijing, China.
Qin Tong
Xuanyang Li is a Ph.D. candidate in the College of Water Resources and Civil Engineering, China Agricultural University, Beijing, China.
References
- Abdel-Galil, H. S. 2007. Solar system with energy storage for drying poultry manure. Misr. J. Agric. Eng. 24 (4):978–1003.
- Aboltins, A., and P. Kic. 2015. Forced convection in drying of poultry manure. Agron. Res. 13 (1):215–22.
- Aghbashlo, M., H. Mobli, S. Rafiee, and A. Madadlou. 2013. A review on exergy analysis of drying processes and systems. Renewable Sustainable Energy Rev. 22:1–22. doi:10.1016/j.rser.2013.01.015.
- Akpinar, E. K., A. Midilli, and Y. Bicer. 2005. Energy and exergy of potato drying process via cyclone type dryer. Energy Convers. Manage. 46 (15):2530–52. doi:10.1016/j.enconman.2004.12.008.
- Akpinar, E. K., Y. Bicer, and A. Midilli 2003. Modelling and experimental study on drying of apple slices in a convective cyclone dryer. J. Food Process Eng. 26:515–41. doi:10.1111/j.1745-4530.2003.tb00654.x.
- Al-attab, K. A., and Z. A. Zainal. 2014. Performance of a biomass fueled two-stage micro gas turbine (MGT) system with hot air production heat recovery unit. Appl. Therm. Eng. 70 (1):61–70. doi:10.1016/j.applthermaleng.2014.04.030.
- Capareda, S. C., C. B. Parnell, and R. O. McGee. 2017. Solid aerosol formation from the reaction of ammonia with greenhouse gases (GHG). Paper presented at 2017 ASABE Annual International Meeting, Spokane, Washington, July 16–19.
- Erbay, Z., and F. Icier. 2009. Optimization of hot air drying of olive leaves using response surface methodology. J. Food Eng. 91 (4):533–41. doi:10.1016/j.jfoodeng.2008.10.004.
- Gay, S. W., D. R. Schmidt, C. J. Clanton, K. A. Janni, L. D. Jacobson, and S. Weisberg. 2003. Odor, total reduced sulfur, and ammonia emissions from animal housing facilities and manure storage units in Minnesota. Appl. Eng. Agric. 19 (3):347–60. doi:10.13031/2013.13663.
- Ghaly, A. E., and K. N. Macdonald. 2012a. Kinetics of thin layer drying of laying-hen manure. Am. J. Biochem. Biotechnol. 8 (2):128–42. doi:10.3844/ajbbsp.2012.128.142.
- Ghaly, A. E., and K. N. Macdonald. 2012b. Drying of poultry manure for use as animal feed. Am. J. Agric. Biol. Sci. 7 (3):239–54. doi:10.3844/ajabssp.2012.239.254.
- Ghaly, A. E., and M. Alhattab. 2013. Drying laying hen manure for pollution potential reduction and production of organic fertilizer. Am. J. Environ. Sci. 9 (2):88–102. doi:10.3844/ajessp.2013.88.102.
- Gokhale, S. V., and S. S. Lele. 2014. Betalain content and antioxidant activity of beta vulgaris: Effect of hot air convective drying and storage. J. Food Process. Preserv. 38 (1):585–90. doi:10.1111/jfpp.12006.
- Holman, J. P. 1994. Experimental methods for engineers. Singapore: McGraw-Hill.
- Koerkamp, P. G. 1994. Review on emissions of ammonia from housing systems for laying hens in relation to sources, processes, building design and manure handling. J. Agr. Eng. Res. 59 (2):73–87. doi: 10.1006/jaer.1994.1065.
- Li, X., B. Li, W. Zheng, Q. Wang, and Q. Tong. 2019. Experimental study on drying performance of manure drying system in summer. Trans. Chin. Soc. Agric. Eng. 35 (7):188–94. (in Chinese with English abstract). doi:10.11975/j.issn.1002-6819.2019.07.023.
- Liska, R., and P. Kic. 2011. Characteristics of drying process of poultry manure at various temperatures. Sci. Agric. Bohemica 42 (2):79–86.
- Liu, Q. 2005. Experimental Design. Beijing: THU Press.
- Ma, X., Z. Fang, and C. Li. 2017. Energy efficiency evaluation and experiment on grain counter-flow drying system based on exergy analysis. Trans. Chin. Soc. Agric. Eng. 33 (22):285–91. doi:10.11975/j.issn.1002-6819.2017.22.037.
- Majdi, H., J. A. Esfahan, and M. Mohebbi. 2019. Optimization of convective drying by response surface methodology. Comput. Electron. Agric. 156:574–84. doi:10.1016/j.compag.2018.12.021.
- Majdi, H., and J. A. Esfahani. 2018. Energy consumption and drying time optimization of convective drying for performance improvement: Response surface methodology and Lattice Boltzmann method. J. Heat Transfer. 140 (10):102009(1–13). doi:10.1115/1.4040259.
- Majdi, H., and J. A. Esfahani. 2019. Energy and drying time optimization of convective drying: Taguchi and LBM methods. Drying Technol. 37 (6):722–34. doi:10.1080/07373937.2018.1458036.
- Motevali, A., S. Minaei, and M. H. Khoshtagaza. 2011. Evaluation of energy consumption in different drying methods. Energy Convers. Manage. 52 (2):1192–99. doi:10.1016/j.enconman.2010.09.014.
- Nahm, K. H. 2003. Evaluation of the nitrogen content in poultry manure. World’s Poult. Sci. J. 59:76–88. doi:10.1079/WPS20030004.
- Ndegwa, P. M., A. N. Hristov, J. Arogo, and R. E. Sheffield. 2008. A review of ammonia emission mitigation techniques for concentrated animal feeding operations. Biosyst. Eng. 100 (4):453–69. doi:10.1016/j.biosystemseng.2008.05.010.
- Schlesinger, W. H. 1997. Biogeochemistry: An analysis of global change. Q. Rev. Biol. 54 (4):353–423. doi:10.1093/obo/9780199830060-0111.
- Sheikhshoaei, H., M. Dowlati, M. Aghbashlo, and M. A. Rosen. 2019. Exergy analysis of a pistachio roasting system. Drying Technol., 1–19. Published online. doi:10.1080/07373937.2019.1649276.
- Somayeh, T. D., H. Nasser., S. Mohammad, and J. Keramat. 2014. Optimization of carboxymethyl cellulose and calcium chloride dip‐coating on mushroom slices prior to hot air drying using response surface methodology. J. Food Process. Preserv. 38 (3):1269–78. doi:10.1111/jfpp.12088.
- Wang, C., and Z. Qiu. 2013. Efficiency coefficient method to solve interval multi-objective linear optimization problems. J. Beijing Univ. Aeronaut. Astronautics 39 (7):907–16. doi:10.13700/j.bh.1001-5965.2013.07.001.
- Weast, R. C., M. J. Astle, and W. H. Beyer. 1988. CRC handbook of chemistry and physics. Boca Raton, FL: CRC press.
- Williams, P. E. V. 1995. Animal production and European pollution problems. Anim. Feed Sci. Technol. 53 (2):135–44. doi:10.1016/0377-8401(95)02017-T.
- Winkel, A., J. Mosquera, and A. J. A. Aarnink. 2017. Evaluation of manure drying tunnels to serve as dust filters in the exhaust of laying hen houses: Emissions of particulate matter, ammonia, and odour. Biosyst. Eng. 16 (2):81–98. doi:10.1016/j.biosystemseng.2017.07.006.
- Wu, Y., Y. Liu., J. Han., and W. Wang. 2015. Study on convective drying characteristics of dredged sludge from Dian Lake. Sep. Sci. Technol. 50 (11):1731–39. doi:10.1080/01496395.2014.990465.
- Ye, X., Z. Ma, J. Zhang, H. Du, J. Chen, H. Chen, Y. Xin, W. Gao, and F. Geng. 2011. Important role of ammonia on haze formation in Shanghai. Environ. Res. Lett. 6 (2):24019–23. doi:10.1088/1748-9326/6/2/024019.
- Zafer, E., and I. Filiz. 2009. Optimization of hot air drying of olive leaves using response surface methodology. J. Food Eng. 91 (4):533–41. doi:10.1016/j.jfoodeng.2008.10.004.
- Zhang, L., B. Wang, and L. Zhang. 2014. Optimization of hot air drying of purple sweet Potato using response surface methodology. 2014 International Conference on Mechatronics, Electronic, Industrial and Control Engineering (MEIC-14). Atlantis Press. doi:10.2991/meic-14.2014.161.
- Zhang, L., Z. Xu, L. Xia, and Z. Ma. 2012. Optimization of the hot-air drying technical parameters for ginkgo fruit based on response surface methodology. Trans. Chin. Soc. Agri. Mach. 43(3): 140–156. (in Chinese with English abstract). doi:10.6041/j.issn.1000-1298.2012.03.026.
- Zohrabi, S., S. S. Seiiedlou, M. Aghbashlo, H. Scaar, and J. Mellmann. 2019. “Enhancing the exergetic performance of a pilot-scale convective dryer by exhaust air recirculation.” Drying Technol., 1–16. Published online. doi:10.1080/07373937.2019.1587617.