
ABSTRACT
People in polluted communities are often exposed to both PM and ozone (O3), albeit not always simultaneously; an important question is whether exposure to particles with seasonal compositional differences can influence biological outcomes. We addressed this question using a mouse model of cardiovascular disease by contrasting the health outcomes of exposures to particles formed or aged during periods of relatively high photochemical activity (i.e. spring/summer), which has increased ambient O3 concentrations, with outcomes of exposures to fall/winter particles which are associated with lower O3 concentrations. Electrocardiographs (ECGs) and blood pressures (BPs) were acquired following exposures to concentrated ambient particles (CAPs). ECGs were analyzed to changes in specific waveform parameters and changes in heart rate variability (HRV). Exposures elicited several types of waveform abnormalities that were associated with seasonal differences in particle constituents. Alterations in R-R interval and P-R interval were seen following exposure to summer CAPs but not fall CAPs and differential responses were seen in the corrected Q-T interval following the two seasonal exposures. Measures of HRV increased after exposure to summer CAPs compared to air-exposed controls but not following the winter CAPs exposure. There were chemical differences with respect to the organic constituents in ambient particles between summer and fall aerosol. The oxygen to carbon ratios (O:C) were generally higher in the spring and summer than in the fall, consistent with seasonal differences in atmospheric photochemical activity. Seasonal differences in atmospheric photochemical activity can modify ambient aerosol composition and can alter biological responses in the cardiovascular system. The results from this study confirm that ambient photochemical activity can alter the toxicity of ambient PM. Regional and seasonal differences in PM2.5 composition should be important considerations when evaluating the effects of PM exposure on cardiovascular health.
Implications: Particles formed during periods of high photochemical activity (e.g. spring/summer) elicit more adverse cardiovascular health effects than particles formed during periods of low photochemical activity (e.g. fall/winter). Seasonal differences in atmospheric photochemical activity modified ambient aerosol composition and worsened cardiovascular responses. These results can inform regulatory agencies and may help design air quality regulations for PM2.5 that consider seasonal and regional variations.
Introduction
Exposure to elevated concentrations of PM and ozone (O3) in polluted ambient air is a major public health issue that is associated with over 4 million premature deaths worldwide (Pope et al. Citation2018, Burnett et al. Citation2018; Pope, Cohen, and Burnett Citation2018). Chronic exposure to particulate matter (PM) has been associated with increased risks for a number of cardiovascular (CV) risk factors including cardiac arrhythmias, myocardial infarctions, and chronic obstructive pulmonary disorder which can culminate in higher morbidity and mortality (Dockery et al. Citation1993; Jerrett et al. Citation2005; Koton et al. Citation2013; Krewski et al. Citation2009; Landrigan et al. Citation2017; Pope et al. Citation2004; Pope and Dockery Citation2006; Tonne et al. Citation2009; Zanobetti and Schwartz Citation2005). Despite vigorous regulatory efforts in the U.S. residents of many communities are exposed to elevated concentrations of PM. For example, several southern California counties have reported average ambient pollutant levels in excess of National Ambient Air Quality Standards (NAAQS) or CalEPA standards, exposing roughly 18 million residents to PM2.5 (PM with diameters ≤2.5 µm) and O3 at concentrations that might cause or exacerbate lung and heart diseases. Additionally, chronic exposure to PM leads to changes in disease biomarkers such as altering heart rate variability (HRV), changes in vascular tone, increased oxidative stress, induced vascular inflammation, and increased atherosclerotic plaque formation in animals (Araujo et al. Citation2008; Campen et al. Citation2010; Chen et al. Citation2013b; Floyd et al. Citation2009; Keebaugh et al. Citation2015; Mirowsky et al. Citation2015; Sun, Wang, and Jin et al. Citation2005; Xu et al. Citation2011) and humans (Allen et al. Citation2009; Hajat et al. Citation2015; Hoffmann et al. Citation2009, Citation2007; Kunzli et al. Citation2010, Citation2005; Pope et al. Citation2004).
PM has been reported to contain higher concentrations of more oxidized aerosols in summer months (when photochemical activity is higher) compared to PM in winter months (when photochemical activity is lower) in a number of locations (Arhami et al. Citation2018; Avery, Waring, and DeCarlo Citation2019; Freney et al. Citation2011; Kuhn, Biswas, and Sioutas Citation2005; Martin et al. Citation2011; Pardo et al. Citation2018; Rogge et al. Citation1993; Russell et al. Citation2004; Xu et al. Citation2015). Significantly, greater mortality rates are associated with cardiovascular diseases during periods of higher heat and O3 (Knowlton et al. Citation2008; Ren et al. Citation2008; Romero Lankao Citation2007). The measured annual average concentration of PM2.5 in the United States from 2010–2016 was about 9 µg/m3 with a 22% decrease compared to previous estimates (EPA Citation2018). Although the overall concentration of PM has been decreasing in recent years, PM concentration excursions associated with seasonal fluctuations and sporadic events such as wildfires (where ambient PM levels can exceed 100 µg/m3) have potential implications for public health (Michaels and Kleinman Citation2000).
This study investigated cardiovascular effects resulting from sub-chronic inhalation of PM2.5 during summer and winter seasons in a mouse model of coronary artery disease. We hypothesized that summer is a more photochemically active (PCA) season than winter and that PM2.5 formed during periods of high PCA would be more potent than PM2.5 formed during low PCA periods, with respect to adverse patterns of heart rhythm, electrocardiogram (ECG) waveforms (i.e. interval changes and ventricular abnormalities) and HRV.
Methods
Animals
Mice lacking the gene coding for the apolipoprotein E gene (apoE-/-; Jackson Laboratory, Bar Harbor, ME) were used in this study because they are susceptible to developing atherosclerosis-like plaques in their coronary and aortic arteries. These mice, which have high serum levels of very low-density lipoproteins (LDL), have been used successfully in studies of the effects of PM exposure on the heart (Chen et al. Citation2013a; Floyd et al. Citation2009; Keebaugh et al. Citation2015; Ramanathan et al. Citation2016; Sun et al. Citation2005).
Mice were randomized into four exposure groups with 16 mice per group. Radiotelemetry electrocardiographic monitors (ETA-F20, Data Sciences International, St Paul, MN, USA) were implanted, I.P., in 5 mice of the 16 mice in each exposure group. Their cardiac electrophysiology was monitored continuously before, during and after exposures. These devices allowed for the continual acquisition of movement, temperature, and ECG measurements in the awake, freely moving mice. ECG signals were recorded during both exposure and non-exposure periods using PhysioTel® receivers (RMC-1, Data Sciences International, St Paul, MN, USA) connected to easyMATRIX16® amplification boxes and processed through iox2® acquisition software (EMKA Technologies S.A.S., Falls Church, VA, USA). Non-implanted mice were housed 4 to a cage in an atmosphere-controlled room on a 12-hr light/dark cycle in an Association for the Assessment and Accreditation of Laboratory Animal Care (AAALAC) accredited animal housing facility at the University of California, Irvine vivarium. The implanted mice were housed singly to facilitate ECG monitoring. Animals were provided with a standard global diet (Teklad Envigo, Indianapolis, IN, USA) and water, ad libitum.
Exposure
A Versatile Aerosol Concentration Enrichment System (VACES) (Kim et al. Citation2001; Kleinman et al. Citation2005; Li et al. Citation2010), shown in , provided exposure atmospheres consisting of PM2.5 during a period of high photochemical activity (High PCA concentrated ambient particles) or to PM2.5 during a period of low photochemical activity (Low PCA CAPs). Control mice were exposed concurrently with both CAPs exposures to air purified over potassium permanganate-impregnated alumina beads, activated carbon, and high-efficiency particulate air (HEPA) filters. This system has been adapted for animal exposures in real-world environments and can enrich the concentration of ambient particles in the size range of 0.02 to 10 µm by a factor of 10 (Kim et al. Citation2001; Kleinman et al. Citation2005; Li et al. Citation2010). PM2.5 was fractionated pre-concentrator using a slit impactor. All mice were between 6 and 8 weeks of age at the start of all exposures and were conditioned to the exposure system in purified air 1 week before baseline measurements were acquired. Baseline ECG measurements were obtained 1 week before exposure initiation. Mice were exposed in previously validated whole-body exposure chambers which connect to the outlet of the VACES (Oldham et al. Citation2004). Exposures occurred 5 hr/day, 4 days/week, for 8 weeks. The whole-body chamber pressures and flow rates were monitored every 15 min during the exposures and chamber temperatures were maintained at 75 ± 5°F. Animals were observed every 15 min throughout the exposure period for signs of distress.
Physical and chemical characterization of PM for ambient and exposure atmospheres
Polytetrafluoroethylene (PTFE) filters were used to collect PM samples. Mass concentrations of PM were determined gravimetrically. Particle size distributions were measured using a TSI Scanning Mobility Particle Sizer (SMPS, model 3080 electrostatic classifier, model 3776 condensation particle counter, Shoreview, MN, USA) from 15 to ~700 nm. A TSI condensation particle counter (Model 3022) was run in parallel to measure total particle number concentrations and a TSI DustTrak optical mass monitor (Model 8520) provided integrated PM2.5 mass concentrations. Size-resolved aerosol organic and inorganic constituent compositions were measured using a high-resolution Aerosol Mass Spectrometer (AMS, Aerodyne Research, Billerica, MA, USA) which provided size and chemical composition as well as mass concentrations in real-time for non-refractory submicron aerosol particles (DeCarlo et al. Citation2006). The AMS was used to analyze exposure and ambient aerosol composition during the exposure studies to determine differences in PM characteristics. High resolution (V mode) data were analyzed with Igor Pro v. 6.37 (Wavemetrics, Inc.) using Squirrel (v. 1.57I) and PIKA (1.16I) with the improved ambient method (Canagaratna et al. Citation2015) to provide compositional analysis of particles. Control sampling, through a HEPA filter, was performed daily to allow adjustments to the default fragmentation table for the fragments CO2+ and 15N14N+. Oxygen to carbon ratio (O:C) measurements were carried out on several exposure and non-exposure days during August through October of 2014, February of 2015, May of 2016, and August through October of 2016. Sampling was carried out at 1–2-min time resolution and daily averages were calculated for time periods of approximately 9 am to 12 pm to overlap with the exposure timeframe. Ambient levels of regional criteria pollutants (i.e., CO and NO2) were not measured at our locations. However, they were monitored routinely by the Southern California Air Quality Management District (AQMD).
Noninvasive blood pressure
Measures of systolic, diastolic, and mean blood pressure were collected weekly from restrained animals using a noninvasive tail-cuff acquisition system (CODA, Kent Scientific, CT). This system is clinically validated and provides a 99% correlation between telemetry and direct blood pressure measurements (Feng et al. Citation2008). Mice were acclimated to the restraint tubes for 1 week prior to the start of each study. Blood pressure measurements were taken weekly and data was collected on all animals 1 day prior to each exposure week. A total of five successful blood pressure measurements during each recording session for each mouse in each cohort were acquired.
Electrocardiographic methods
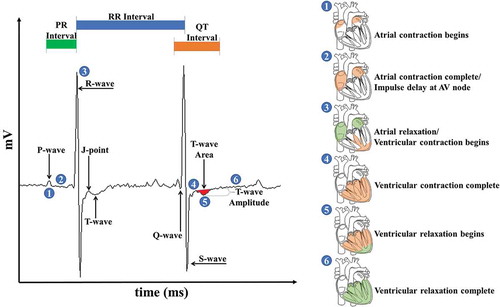
All ECG and HRV parameters were acquired from freely moving, conscious mice and assessed at the same time every evening beginning 6 hr following the exposure period (7:00 PM – 12:00 AM). All waveforms were defined using ecgAUTO® software (EMKA Technologies S.A.S., Falls Church, VA, USA). As shown in , the P-wave Duration (1) corresponds to atrial depolarization while the P-R interval (2) relates to the delay of the electrical impulse at the AV node and can be calculated as the time between of the first deflections of the P-wave and QRS-wave complex. The QRS-wave complex (3) primarily represents the start of the ventricular depolarization and the end of atrial repolarization; the time interval between consecutive QRS-waves is defined as the R-R interval. The completion of ventricular depolarization following the QRS-wave (4) and the ventricular repolarization phase, known as the T-wave (5), occur almost instantaneously. Due to the absence of the murine S-T segment, the T-wave was used to evaluate ventricular repolarization changes indicative of myocardial ischemia (Speerschneider and Thomsen Citation2013). The T-wave area was defined as the area over or under the ECG tracing from the peak of the J-wave to the end of the T-wave, or where the T-wave returns to the isoelectric point. The T-wave amplitude was defined as the distance from the isoelectric line to the point of lowest deflection within the T-wave. The Q-T interval encompasses the length of time from the onset of the Q-wave to the conclusion of the T-wave and corresponds to the ventricular repolarization phase and was measured and heart rate-corrected using Mitchell’s correction (Mitchell, Jeron, and Koren Citation1998). Ventricular repolarization is completed by the end of the T-wave and before the subsequent atrial depolarization (6). For this analysis, six ECG parameters were acquired: R-R interval, P-R interval, J-point amplitude, heart rate-corrected Q-T interval, T-wave area, and T-wave amplitude (Boukens et al. Citation2014; Farraj et al. Citation2011b; Goldbarg et al. Citation1968; Speerschneider and Thomsen Citation2013). Other endpoints and waveforms were discussed for the sake of thoroughness.
Figure 2. ECG waveform definitions. All waveform definitions were defined using ecgAUTO (see text for full definitions). Waveform libraries were assembled for each mouse using data acquired during a one-week baseline period immediately preceding the start of the exposure. Changes in ECG morphology in exposed mice were determined by comparing daily waveform measurements against baseline values. Circled numbers in the ECG trace correspond to defined contraction (orange shading) and relaxation (green shading) events in the heart highlighted on the right of the image.
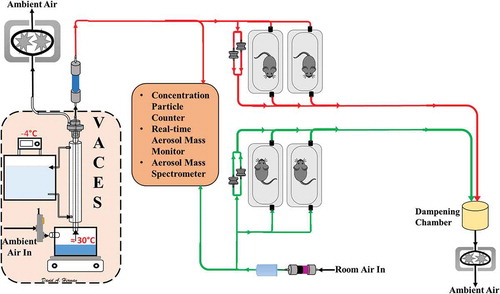
Figure 1. Schematic of VACES and exposure setup. Red lines indicate CAPs atmosphere. Green lines indicate filtered air exposure.
HRV is the magnitude of variance explained (time-domain) in the heart’s rhythm across different spectra (frequency-domain) of periodic oscillations in heart rate and was calculated using ecgAUTO® (EMKA Technologies S.A.S., Falls Church, VA, USA). ECG recordings were collected daily and analyzed in 30 sec increments. Segments with less than 200 total R-waves or with a standard deviation of the averaged N-N values (SDNN) greater than 8 ms were excluded from daily exposure averages. Individual R-R signal segments were averaged to obtain a single HRV value was calculated for each five-hour acquisition periods. The root mean square of successive differences in the R-R interval (RMSSD) was also calculated and is used here to represent the short-term deviations in heart rate and may indicate the integrity of the vagus nerve-mediated autonomic control of the heart (DeGiorgio et al. Citation2010). Portions of these spectra reflect different autonomic influences on heart rate. Interpolated R-R intervals underwent power spectral analysis via Fast Fourier Transform to obtain frequency domain HRV measures. Segments with stationary stable signals and void of ectopic beats were selected following the guidelines established by the Task Force of the European Society of Cardiology (Citation1996). The total power in both the high frequency (HF HRV) (1.5–5.0 Hz (Rowan et al. Citation2007)) and the low frequency (LF HRV, 0.1–1.5 Hz) HRV band was calculated for each recording by solving for the integral of the high and low frequency bands, respectively. HF HRV of the heart period power spectrum has been used to estimate cardiac vagal control (Liao et al. Citation1996) and decreased cardiac vagal activity in humans has been found to be associated with an increased risk of coronary atherosclerosis (Hayano et al. Citation1991). Heart period oscillations at lower frequencies (LF HRV, 0.1–1.5 Hz) are less well understood but may represent mixed sympathetic-parasympathetic and thermoregulatory influences (Fleisher et al. Citation1996; Lossius, Eriksen, and Walloe Citation1994).
Data analyses and statistics
Baseline data between groups in each exposure period were compared by Student’s two-tailed t-test with P ≤ 0.05 considered significant. Change from baseline measurements for ECG waveforms, HRV, and blood pressure between exposure group means was analyzed using Bonferroni-corrected two-way analysis of variance (ANOVA) for repeated measures. Fisher’s F-statistics, as well as the proportion of total variance in the dependent variables, or partial η,2 was identified for each endpoint. SPSS® (IBM, Armonk, NY, USA) was used for all statistical analyses. Normalcy of the data was checked using a Shapiro–Wilk test. Significance was assessed at P ≤ 0.05.
Results
Exposure parameters and atmosphere characteristics
A summary of the parameters and atmosphere characteristics to which genetically modified, hyperlipidemic (apoE-/-) mice were exposed is provided in . High photochemical activity (PCA) exposures to concentrated ambient particles (CAPs) were performed from July 23, 2015 through September 11, 2015 while the low PCA exposures were performed from August 23 through October 20, 2016. Ambient particle concentrations were slightly higher during the low PCA time-period compared to the high PCA period, but the average mass concentrations of the concentrated ambient PM during the two exposure periods were comparable. The PM content of the filtered control air was routinely monitored for PM mass and averaged less than 0.1 µg/m3. Ambient ozone and dewpoint levels were higher during the periods of high PCA activity; the mean ambient temperatures were comparable for both exposure periods. The mice were, however, exposed in temperature-regulated chambers and they were not affected by variations in ambient temperature.
Table 1. Exposure parameters and atmosphere characteristics for both high and low PCA Concentrated Ambient Particles (CAPs) PM2.5. Data presented as exposure averages ± standard deviation.
For comparison, shows the relevant ambient air quality standards for ozone, PM2.5, carbon monoxide (CO), and nitrogen dioxide (NO2). Animals in this exposure were exposed to particles at a level below that of 24-hr national standard but above both the national and California annual standards. The South Coast AQMD also measured summer (High PCA) and winter (Low PCA) concentrations for these criteria pollutants at a site with a comparable distance from a heavily trafficked freeway to our own. All of our CAPs exposures when calculated as time weighted 24-hr equivalent average concentrations were below the applicable state and national limits.
Table 2. Relevant ambient air quality standards for ozone, PM2.5, carbon monoxide (CO), and nitrogen dioxide (NO2). Los Angeles Basin measurements taken 80 m from nearest freeway.
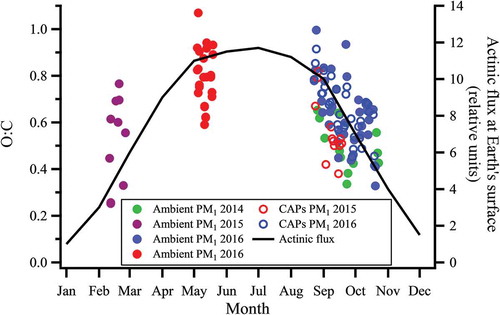
Oxygen to carbon (O:C) ratios were examined for ambient PM2.5 over multiple seasons and years, including the exposure periods for this study. shows that particle O:C tends to be higher in spring/summer and lower in fall/winter periods. This seasonal variation in O:C was observed for both ambient PM and CAPs in the fall, showing that the average oxygen content of CAPs is similar to that of ambient particles. also shows that the seasonal trends in O:C ratios of analyzed PM1 appear to track seasonal changes in UV radiation flux at the Earth’s surface, which would be the driving force for atmospheric photochemical activity that influences the formation and composition of PM. While there are clearly many variables that will contribute to the composition of the organic fraction of particles, the reactive chemical species that initiate oxidation of volatile organic compounds in air are photochemically derived and thus our observed the trend in PM O:C is consistent with previous observations in Southern California (Finlayson-Pitts and Pitts Citation2000).
Figure 3. Oxygen-to-carbon ratios of PM1 sampled during different seasons compared to UV radiation flux at Earth’s surface. Closed green markers indicate late fall/early winter of 2014, closed purple markers indicate late winter of 2015, closed red markers indicate late spring/early summer of 2016, and closed blue markers indicate late fall/early winter of 2016. Open red and blue markers indicate CAPs measurement for late fall/early winter 2015 and 2016, respectively. UV flux was taken at 30°N latitude (close to Irvine) at 12:00 pm PST accounting for the monthly change in solar zenith angle 39. Exposure periods for this study occurred during periods designated by red and blue dots.
Baseline values
Baseline data for all physiologic parameters is presented in . Exposed and air control animals during both high and low PCA time periods exhibited comparable baseline measurements in most responses.
Table 3. Average baseline values for all measured endpoints. Significant differences between cohorts during each experimental period assessed at P≤ 0.05 using Student’s T-test and indicated by italics.
Hemodynamics
Mice exposed to CAPs formed during high PCA periods exhibited increased systolic and diastolic blood pressure () with exposure cohort accounting for roughly 40% of the variance in both parameters ().
Figure 4. Blood pressure changes induced by particle exposure. Data represent weekly aggregates of change from baseline values for control and exposed animals during periods of high or low photochemical activity (± SEM, n = 3–5/group depending on acquisition scheduling). High PCA data set is complete and sporadic due to system availability. Low PCA CAPs data from week 2 is missing due to acquisition program errors. Significance assessed at p ≤ 0.05; *CAPs significantly different than air over the entire exposure period.
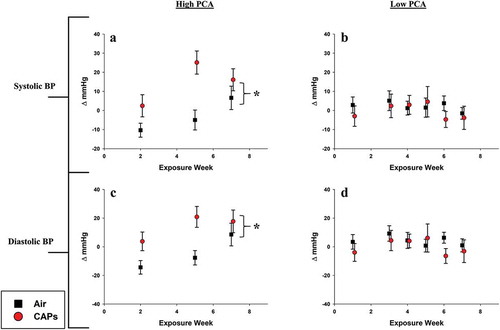
Table 4. Summary of ANOVA-derived significant values. Overall differences between control and CAP-exposed animals for both high and low PCA time periods. Partial Eta (η2) is provided and represents the proportion on variance accounted for by each dependent variable. *indicates P ≤ .05 while #indicates P ≤ 0.1 by Bonferroni-corrected two-way ANOVA for repeated measures. Italic font indicates significant differences.
Heart Rate Variability (HRV)
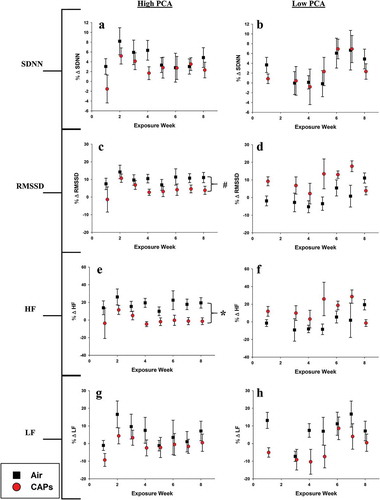
Sub-chronic exposure to high PCA CAPs resulted in decreased RMSSD and HF parameters relative to air exposed animals (,). This alteration in both time and frequency domain parameters may be indicative of augmented cardiac vagal control and activation of the parasympathetic nervous system. Mice exposed to low PCA CAPs experienced no change HRV parameters compared to control.
Figure 5. HRV averages for high and low PCA CAPs exposure. Data represent weekly aggregates of change from baseline values for control and exposed animals during periods of high or low photochemical activity (± SEM, n = 3–5/group depending on acquisition scheduling). Low PCA CAPs data from week 2 is missing due to acquisition program errors. *p ≤ 0.05; CAPs significantly different than air over the entire exposure period. # p ≤ 0.1; CAPs significantly different than air over the entire exposure period.
Electrocardiographic waveform parameters
Heart rate-related endpoints
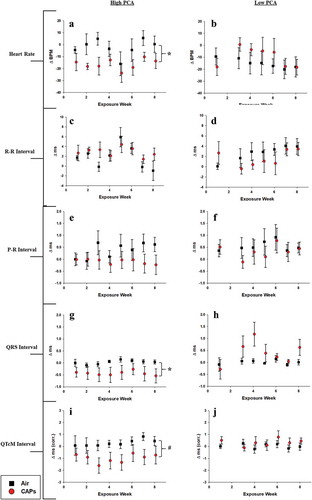
Exposure to CAPs during periods of high PCA elicited more pronounced alterations in heart rate-related ECG waveforms compared to exposures during periods of low photochemical activity. High PCA exposures decreased overall heart rate compared to air controls (,) while no effect on R-R interval was measured for either the high or low PCA exposures (,). No significant differences in P-R interval duration were measured in either exposure period indicating no significant atrial conduction dysfunction. However, the high PCA-exposed CAPs appear to trend toward a consistent decrease in P-R interval as the exposure period progresses (,). The QRS interval duration in mice exposed to high PCA particles was also significantly longer relative to air controls possibly indicating impaired cardiac depolarization (). This decreased trend, though not significant, was also present during the rate-corrected Q-T segment (QTcM) which may indicate that the impairments caused by high PCA CAPs exposure may preferentially impact ventricular repolarization processes (). Interestingly, exposure to low PCA CAPs resulted in periods of increased QRS intervals compared to air controls (). Although not significant, these alterations may represent responses to components inherent to the specific exposure period.
Figure 6. Heart rate-related ECG waveform changes. Data represent weekly aggregates of change from baseline values for control and exposed animals during periods of high or low photochemical activity (± SEM, n = 3-5/group depending on acquisition scheduling). Low PCA CAPs data from week 2 is missing due to acquisition program errors. Significance assessed at * p ≤ 0.05 or # p ≤ 0.1 for CAPs compared to controls over the entire exposure period.
Ventricular-related endpoints
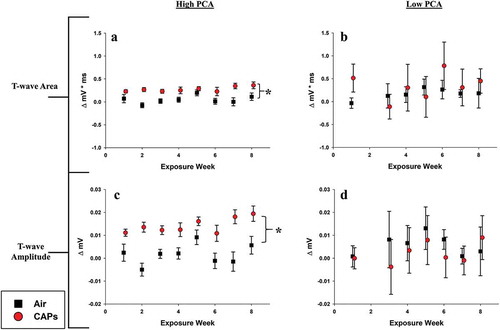
The effects of sub-chronic exposure to high and low PCA CAPs on the T-wave morphology are presented in . No appreciable changes were seen in either the T-wave area or T-wave amplitude for mice exposed during either exposure period. The absence of response in these endpoints is counter-intuitive given the alterations seen in the QTcM segment (). However, the decreased QTcM duration may be attributed to the significant QRS complex prolongation ().
Figure 7. T-wave-related ECG waveform changes. Data represent weekly aggregates of change from baseline values for control and exposed animals during periods of high or low photochemical activity (± SEM, n = 3-5/group depending on acquisition scheduling). Low PCA CAPs data from week 2 is missing due to acquisition program errors. Significance assessed at p ≤ 0.05; *CAPs significantly different than air over the entire exposure period.
Discussion
Cardiovascular effects
Compositional and seasonal variations in PM the cardiopulmonary health effects were examined in this study. Exposures to CAPs concentrated from particles that formed or aged in ambient air during periods of high photochemical activity (i.e. summer) induced more severe adverse responses than did exposure to CAPs generated in the lower photochemical period (i.e. fall). We analyzed ECG waveforms that relate to cardiac function and have shown that mice exposed to high PCA CAPs exhibit a decreased heart rate relative to controls which may result from decreased QRS or Q-T interval duration (, ) or altered autonomic nervous system input (RMSSD and HF HRV, and ). Other studies have found T-wave amplitude depressions in acute studies exposing spontaneously hypertensive rats to residual oil fly ash (Farraj et al. Citation2011a). We did not see any changes in T-wave specific waveform structures following exposure to high or low PCA particles. This may possibly be due to differences in particle concentrations as the particles given to the animals under this exposure were 4–10 times less concentrated than those produced in the Farraj et al. study.
Interestingly, exposure to PM from different seasons had contrasting effects on the corrected Q-T interval. Animals exposed to PM during periods of high PCA experienced significantly prolonged QTc intervals while sporadically shortened QTc intervals were observed in animals exposed during low PCA periods ( and ). Prolonged Q-T intervals are an established indicator for arrhythmia and sudden cardiac death and have been associated with PM air pollution in an elderly human cohort (Scott and Walls Citation1985; Straus et al. Citation2006) while repolarization changes associated with T-wave alterations, which were observed after high PCA exposures, can be indicative of myocardial ischemia (Mirvis Citation1988). Similar studies reporting concurrent outcomes have been conducted which report altered electrocardiographic responses in rats following ambient particulate matter inhalation. Similar to our study, the acute (3-day) study carried out by Farraj et al. in which rats were exposed to winter PM2.5 reported a decrease in overall heart rate but also determined that exposed cardiomyocytes exhibited less sensitization to alterations in cardiac calcium homeostasis compared summer PM2.5 exposure (Farraj et al. Citation2015).
Furthermore, our data corroborates findings by Carll et al. (Citation2017) who showed decreased P-R and QTc intervals in metabolically challenged rats on a high fructose diet in a short term (12 days) exposure to non-vehicular primary particles combined with photochemically derived secondary organic aerosols (Carll et al. Citation2017). The consistency in results given drastically different exposure parameters (animal model, exposure time, concentration, measurement duration) may inform on the importance of the interaction between primary source particles and photochemically derived secondary particles in environmental health effects. Additionally, opposing QRS and QTc interval responses were observed in an ultrafine CAPs/Ozone acute co-exposure (Kurhanewicz et al. Citation2014) which may again be due to differences in disease model, exposure duration, PM duration, and/or monitoring periods. Regarding this study, ambient particles had undergone an atmospheric co-exposure prior to capture and concentration in our exposure system. Animals exposed to these highly photochemically active particles experienced cardiac abnormalities consistent to that previously reported in human studies (Baja et al. Citation2010; Tong et al. Citation2012).
Our current findings are consistent with our previous findings of high PCA exposures that we have reported (Keebaugh et al. Citation2015) but differ seasonally from those reported by Farraj et al. (Farraj et al. Citation2015). As with the Carll study, many parameters differ between this current exposure and by Farraj et al. including animal model, duration of exposure, and the differences in source profiles in the two distinct locations (California and North Carolina); the North Carolina particle composition is likely to be very different from that in Southern California (Davis et al. Citation2011). This latter distinction may be one reason for the reversed response in the QTc interval seen by Farraj and colleagues. Other distinctions between the two studies are the animal model used and the duration of the study. Farraj and colleagues exposed rats to CAPs in three 4-hr exposure periods. Based on our prior studies, physiological responses in rodents during the acute phase of a study may be influenced by the animal’s stress responses to the novel exposure conditions in addition to the effects of exposure. The results from this chronic study, although different from those reported by Farraj, may be represent cumulative effects of repeated exposures and possibly aging of the mice over the chronic exposure program. The high and low PCA exposures were separated in time and the animals were from different groups, albeit of the same strain from the same supplier. Therefore, we did not statistically contrast the measurements from one set of exposures to the other but analyzed comparisons to their respective air control groups.
Heart rate variability
Our study found that certain markers of HRV (RMSSD and HF HRV) were decreased in mice after exposure to high PCA CAPs compared to air controls with no effect seen in mice during the low PCA period (,) indicating parasympathetic nervous system dysfunction. The degree to which these autonomic changes contribute to cardiovascular disease (CVD) is still under investigation. Reductions in both frequency domain components of HRV (LF and HF) were found in apoE-/- mice exposed to Seattle PM (Corey, Baker, and Luchtel Citation2006). Similar decreases in HF HRV have been identified in apoE-/- mice exposed to concentrated PM near heavily trafficked roadways (Keebaugh et al. Citation2015) reinforcing the role of primary particles in observed cardiac effects. CVD has been associated with HF HRV in humans indicating a potential predominance of the sympathetic nervous system (Simula et al. Citation2014). LF HRV, on the other hand, has been associated with a plethora of cardiovascular disorders in humans including heart failure, hypertension, and increased mortality rates after myocardial infarctions (Colhoun et al. Citation2001; Zanobetti et al. Citation2010).
The HRV changes measured in indicate that the inhalation of CAPs affects HRV, but the mode of action is quite different depending on the seasonal composition of the particles. Alterations in autonomic responses may be due to the presence of trace metals bound to the particulate matter. Lippmann et al. (Citation2006) reported that CAPs influenced by a 14-day incursion of nickel (Ni) during an exposure study in Ney York state caused a significant decrease in SDNN highlighting the importance of particle constituent on resulting health outcomes (Lippmann et al. Citation2006). The effect of Ni on HRV in this study is considered nominal as nickel concentrations in the South Coast air basin range from 8 to 14 ng/m3 which are about 10 times lower than concentrations present in the Lippman study. However, the exposures from Carll and Lippman both determined that the direction of HRV responses may be influenced by either the underlying disease state of the animal or possibly by the specific constituents of the inhaled particulate matter.
Other considerations
This study confirmed that PM during periods of high PCA has different characteristics than PM during periods of lower PCA. The high PCA exposure occurred during the middle-late summer months of 2015 when particle O:C is shown to be at its highest at the exposure site in Irvine (). The low PCA exposure occurred during the fall season when particle O:C was reduced, and ambient ozone levels were 10 ppb lower than during the high PCA period. This trend is shown to be similar in the fall for both ambient PM and CAPs. While seasonal changes in particles are dependent on the location and the sources of particles, the changes in PM O:C observed here are consistent with a number of studies that report higher fractions of more oxidized compounds in summer months compared to PM in winter months (Arhami et al. Citation2018; Avery, Waring, and DeCarlo Citation2019; Freney et al. Citation2011; Kuhn, Biswas, and Sioutas Citation2005; Martin et al. Citation2011; Pardo et al. Citation2018; Rogge et al. Citation1993; Russell et al. Citation2004; Xu et al. Citation2015). Farraj et al. also examined seasonal differences in cardiac effects of PM exposure in an acute scenario and showed important differences in the concentration and chemistry of the ambient PM as a function of season. Their study was performed in the northeastern region of the United States where combustion is a predominant heating method during the winter months and therefore significantly impacts the seasonal variation in ambient particulate matter. Under these conditions, Farraj and colleagues observed that exposure to PM collected during the winter months had 1.5 and 3.4 times larger concentrations of organic and elemental carbon, respectively, than did PM from summer months (Farraj et al. Citation2015). This is a stark contrast to our study and other ambient PM studies performed in southern California where combustion heating is minimal and variations in seasonal temperatures are less extreme than those observed in the eastern United States.
Limitations
This study has potential limitations. ApoE−/- mice were chosen for this study because they are prone to developing arterial disease similar to that seen in humans. However, these mice are also susceptible to higher levels of systemic oxidative stress and inflammation than are wild-type mice due to the apoE gene’s involvement with anti-oxidative activity (Getz and Reardon Citation2016). Additionally, existing datasets were pooled in order to determine potential seasonal effects of PM exposure. As such, the seasonal difference between the two exposure periods was not ideal. Lastly, the system used to acquire the ECG and HRV data presented in this had limited recording capabilities. Therefore, a subset of each exposure cohort was recorded on any given day over the course of the exposure period.
Conclusion
Urban airborne PM contains a rich mixture of solid constituents in addition to a variety of oxidizing gases, including ozone, which may be responsible for some of the observed exacerbation of PM-associated adverse cardiovascular health effects. The overarching goal of this study was to investigate the differences in cardiac effects resulting from sub-chronic inhalation to PM2.5 during periods of high or low photochemical activity. We conclude that there are seasonal differences in ambient particle composition which can alter biological responses, as shown by alterations in ECG waveform morphology, blood pressure, and HRV. In southern California, seasonal differences in the particle composition may be largely driven by seasonal differences in photochemical activity. The results from this study have potential implications for regional legislation and can be used to help influence the NAAQS for PM2.5 based on seasonal variations. Further investigation into these observed cardiovascular changes must be performed to explicate the specific mechanisms related to seasonal air pollution inhalation.
Correction Statement
This article has been republished with minor changes. These changes do not impact the academic content of the article.
Acknowledgment
The authors appreciate the effort of staff from the University of California, Irvine’s Division of Occupational and Environmental Medicine, Department of Medicine, and Department of Chemistry. This project was funded by the California Air Resources Board (Contract Number: 13-309). The authors are grateful for financial support through the Major Research Instrumentation program of the National Science Foundation (grant #0923323) for the acquisition of the aerosol mass spectrometer (AMS). The authors thank Michael Ezell, Véronique Perraud, Geovani Montoya, and Yue Zhao for help transporting equipment to the Air Pollution Health Effects Laboratory and to Cyril McCormick for facilitating repairs. The contents of this paper are solely the responsibility of the authors and do not necessarily represent the official views of the funding agencies and no official endorsement should be inferred. The authors declare that they have no competing financial interest.
The authors thank the China Section of the Air & Waste Management Association for the generous scholarship they received to cover the cost of page charges, and make the publication of this paper possible.
Disclosure statement
No potential conflict of interest was reported by the authors.
Additional information
Funding
Notes on contributors
David A. Herman
David A. Herman is a graduate student in the Air Pollution Health Effects Laboratory, part of the Department of Community and Environmental Medicine at the University of California, Irvine in Irvine, CA. He can be reached at [email protected].
Lisa M. Wingen
Lisa M. Wingen is an associate project scientist in the chemistry department at the University of California, Irvine in Irvine, CA.
Rebecca M. Johnson
Rebecca M. Johnson is a graduate student in the Air Pollution Health Effects Laboratory, part of the Department of Community and Environmental Medicine at the University of California, Irvine in Irvine, CA.
Andrew J. Keebaugh
Andrew J. Keebaugh is a graduate student in the Air Pollution Health Effects Laboratory, part of the Department of Community and Environmental Medicine at the University of California, Irvine in Irvine, CA.
Samantha R. Renusch
Samantha R. Renusch is a research associate in the Air Pollution Health Effects Lab, part of the Department of Community and Environmental Medicine at the University of California, Irvine in Irvine, CA.
Irene Hasen
Irene Hasen is the vivarium manager of the Air Pollution and Health Effects Lab, part of the Department of Community and Environmental Medicine at the University of California, Irvine in Irvine, CA.
Amanda Ting
Amanda Ting is the lead animal technician at the Air Pollution and Health Effects Lab, part of the Department of Community and Environmental Medicine at the University of California, Irvine in Irvine, CA.
Michael T. Kleinman
Michael T. Kleinman is an adjunct professor and co-director or the Air Pollution Health Effects Laboratory, part of the Department of Community and Environmental Medicine at the University of California, Irvine in Irvine, CA.
References
- Allen, R. W., M. H. Criqui, A. V. Diez Roux, M. Allison, S. Shea, R. Detrano, L. Sheppard, N. D. Wong, K. H. Stukovsky, and J. D. Kaufman. 2009. Fine particulate matter air pollution, proximity to traffic, and aortic atherosclerosis. Epidemiology 20 (2):254–64. doi:10.1097/EDE.0b013e31819644cc.
- Araujo, J. A., B. Barajas, M. Kleinman, X. Wang, B. J. Bennett, K. W. Gong, M. Navab, J. Harkema, C. Sioutas, A. J. Lusis, et al. 2008. Ambient particulate pollutants in the ultrafine range promote early atherosclerosis and systemic oxidative stress. Circ. Res. 102 (5):589. doi:10.1161/CIRCRESAHA.107.164970.
- Arhami, M., M. Z. Shahne, V. Hosseini, N. Roufigar Haghighat, A. M. Lai, and J. J. Schauer. 2018. Seasonal trends in the composition and sources of PM2.5 and carbonaceous aerosol in Tehran, Iran. Environ. Pollut. 239:69–81. doi:10.1016/j.envpol.2018.03.111.
- Avery, A. M., M. S. Waring, and P. F. DeCarlo. 2019. Seasonal variation in aerosol composition and concentration upon transport from the outdoor to indoor environment. Environ. Sci. Proc. Imp. 21 (3):528–47. doi:10.1039/C8EM00471D.
- Baja, E. S., J. D. Schwartz, G. A. Wellenius, B. A. Coull, A. Zanobetti, P. S. Vokonas, and H. H. Suh. 2010. Traffic-related air pollution and QT interval: Modification by diabetes, obesity, and oxidative stress gene polymorphisms in the normative aging study. Environ. Health Perspect. 118 (6):840–46. doi:10.1289/ehp.0901396.
- Boukens, B. J., M. R. Rivaud, S. Rentschler, and R. Coronel. 2014. Misinterpretation of the mouse ECG: ‘musing the waves of Mus musculus’. J. Physiol. (Lond.) 592 (Pt 21):4613–26. doi:10.1113/jphysiol.2014.279380.
- Burnett, R., H. Chen, M. Szyszkowicz, N. Fann, B. Hubbell, C. A. Pope, J. S. Apte, M. Brauer, A. Cohen, S. Weichenthal, et al. 2018. Global estimates of mortality associated with long-term exposure to outdoor fine particulate matter. Proc. Natl. Acad. Sci. U.S.A. 115 (38):9592–97. doi:10.1073/pnas.1803222115.
- Campen, M. J., A. K. Lund, T. L. Knuckles, D. J. Conklin, B. Bishop, D. Young, S. Seilkop, J. Seagrave, M. D. Reed, and J. D. McDonald. 2010. Inhaled diesel emissions alter atherosclerotic plaque composition in ApoE(-/-) mice. Toxicol. Appl. Pharmacol. 242 (3):310–17. doi:10.1016/j.taap.2009.10.021.
- Canagaratna, M. R., J. L. Jimenez, J. H. Kroll, Q. Chen, S. H. Kessler, P. Massoli, L. Hildebrandt Ruiz, E. Fortner, L. R. Williams, K. R. Wilson, et al. 2015. Elemental ratio measurements of organic compounds using aerosol mass spectrometry: Characterization, improved calibration, and implications. Atmos. Chem. Phys. 15 (1):253–72. doi:10.5194/acp-15-253-2015.
- Carll, A. P., S. M. Crespo, M. S. Filho, D. H. Zati, B. A. Coull, E. A. Diaz, R. D. Raimundo, T. N. G. Jaeger, A. L. Ricci-Vitor, V. Papapostolou, et al. 2017. Inhaled ambient-level traffic-derived particulates decrease cardiac vagal influence and baroreflexes and increase arrhythmia in a rat model of metabolic syndrome. Part Fibre Toxicol. 14 (1):16. doi:10.1186/s12989-017-0196-2.
- Chen, T., G. Jia, Y. Wei, and J. Li. 2013b. Beijing ambient particle exposure accelerates atherosclerosis in ApoE knockout mice. Toxicol. Lett. 223 (2):146–53. doi:10.1016/j.toxlet.2013.09.004.
- Chen, T., G. Jia, Y. J. Wei, and J. C. Li. 2013a. Beijing ambient particle exposure accelerates atherosclerosis in ApoE knockout mice. Toxicol. Lett. 223 (2):146–53. doi:10.1016/j.toxlet.2013.09.004.
- Colhoun, H. M., D. P. Francis, M. B. Rubens, S. R. Underwood, and J. H. Fuller. 2001. The association of heart-rate variability with cardiovascular risk factors and coronary artery calcification: A study in type 1 diabetic patients and the general population. Diabetes Care 24 (6):1108–14. doi:10.2337/diacare.24.6.1108.
- Corey, L. M., C. Baker, and D. L. Luchtel. 2006. Heart-rate variability in the Apo lipoprotein E knockout transgenic mouse following exposure to Seattle particulate matter. J. Toxicol. Environ. Health Part A 69. doi:10.1080/15287390500362105.
- Davis, J. A., Q. Meng, J. D. Sacks, S. J. Dutton, W. E. Wilson, and J. P. Pinto. 2011. Regional variations in particulate matter composition and the ability of monitoring data to represent population exposures. Sci. Total Environ. 409 (23):5129–35. doi:10.1016/j.scitotenv.2011.08.013.
- DeCarlo, P. F., J. R. Kimmel, A. Trimborn, M. J. Northway, J. T. Jayne, A. C. Aiken, M. Gonin, K. Fuhrer, T. Horvath, K. S. Docherty, et al. 2006. Field-deployable, high-resolution, time-of-flight aerosol mass spectrometer. Anal. Chem. 78 (24):8281–89. doi:10.1021/ac061249n.
- DeGiorgio, C. M., P. Miller, S. Meymandi, A. Chin, J. Epps, S. Gordon, J. Gornbein, and R. M. Harper. 2010. RMSSD, a measure of vagus-mediated heart rate variability, is associated with risk factors for SUDEP: The SUDEP-7 inventory. Epilepsy Behav. 19 (1):78–81. doi:10.1016/j.yebeh.2010.06.011.
- Dockery, D. W., C. A. Pope, X. Xu, J. D. Spengler, J. H. Ware, M. E. Fay, B. G. Ferris, and F. E. Speizer. 1993. An association between air pollution and mortality in six U.S. cities. N. Engl. J. Med. 329:1753–59. doi:10.1056/NEJM199312093292401.
- Electrophysiology, Task Force of the European Society. 1996. Heart rate variability: Standards of measurement, physiological interpretation and clinical use. Task force of the European Society of Cardiology and the North American Society of Pacing and Electrophysiology. Circulation 93 (5):1043–65. doi:10.1161/01.CIR.93.5.1043.
- Environmental Protection Agency (EPA). 2018. Particulate matter (PM2.5) Trends. http://www.epa.gov/air-trends/particulate-matter-pm25-trends.
- Farraj, A. K., L. Walsh, N. Haykal-Coates, F. Malik, J. McGee, D. Winsett, R. Duvall, W. E. Kasey Kovalcik, M. H. Cascio, and M. S. Hazari. 2015. Cardiac effects of seasonal ambient particulate matter and ozone co-exposure in rats. Part Fibre Toxicol. 12 (1):12. doi:10.1186/s12989-015-0087-3.
- Farraj, A. K., M. S. Hazari, N. Haykal-Coates, C. Lamb, D. W. Winsett, and Y. Ge. 2011a. ST depression, arrhythmia, vagal dominance, and reduced cardiac micro-RNA in particulate-exposed rats. Am. J. Respir. Cell Mol. Biol. 44:185–96. doi:10.1165/rcmb.2009-0456OC.
- Farraj, A. K., M. S. Hazari, N. Haykal-Coates, C. Lamb, D. W. Winsett, Y. Ge, A. D. Ledbetter, A. P. Carll, M. Bruno, A. Ghio, et al. 2011b. ST depression, arrhythmia, vagal dominance, and reduced cardiac micro-RNA in particulate-exposed rats. Am. J. Respir. Cell Mol. Biol. 44 (2):185–96. doi:10.1165/rcmb.2009-0456OC.
- Feng, M., S. Whitesall, Y. Zhang, M. Beibel, L. D’Alecy, and K. DiPetrillo. 2008. Validation of volume-pressure recording tail-cuff blood pressure measurements. Am. J. Hypertens. 21 (12):1288–91. doi:10.1038/ajh.2008.301.
- Finlayson-Pitts, B. J., and J. N. Pitts Jr. 2000. Chemistry of the upper and lower atmosphere: Theory, experiments, and applications. San Diego, CA: Academic Press.
- Fleisher, L. A., S. M. Frank, D. I. Sessler, C. T. Cheng, T. Matsukawa, and C. A. Vannier. 1996. Thermoregulation and heart rate variability. Clin. Sci. 90 (2):97–103. doi:10.1042/cs0900097.
- Floyd, H. S., L. C. Chen, B. Vallanat, and K. Dreher. 2009. Fine ambient air particulate matter exposure induces molecular alterations associated with vascular disease progression within plaques of atherosclerotic susceptible mice. Inhal. Toxicol. 21 (5):394–403. doi:10.1080/08958370802317745.
- Freney, E. J., K. Sellegri, F. Canonaco, J. Boulon, M. Hervo, R. Weigel, J. M. Pichon, A. Colomb, A. S. H. Prévôt, and P. Laj. 2011. Seasonal variations in aerosol particle composition at the puy-de-Dôme research station in France. Atmos. Chem. Phys. 11 (24):13047–59. doi:10.5194/acp-11-13047-2011.
- Getz, G. S., and C. A. Reardon. 2016. ApoE knockout and knockin mice: The history of their contribution to the understanding of atherogenesis. J. Lipid Res. 57 (5):758–66. doi:10.1194/jlr.R067249.
- Goldbarg, A. N., H. K. Hellerstein, J. H. Bruell, and A. F. Daroczy. 1968. Electrocardiogram of the normal mouse, Mus musculus: General considerations and genetic aspects. Cardiovasc. Res. 2 (1):93–99. doi:10.1093/cvr/2.1.93.
- Hajat, A., M. Allison, A. V. Diez-Roux, N. S. Jenny, N. W. Jorgensen, A. A. Szpiro, S. Vedal, and J. D. Kaufman. 2015. Long-term exposure to air pollution and markers of inflammation, coagulation, and endothelial activation: A repeat-measures analysis in the Multi-Ethnic Study of Atherosclerosis (MESA). Epidemiology 26 (3):310–20. doi:10.1097/EDE.0000000000000267.
- Hayano, J., A. Yamada, S. Mukai, Y. Sakakibara, M. Yamada, N. Ohte, T. Hashimoto, T. Fujinami, and K. Takata. 1991. Severity of coronary atherosclerosis correlates with the respiratory component of heart-rate-variability. Am. Heart J. 121 (4):1070–79. doi:10.1016/0002-8703(91)90664-4.
- Hoffmann, B., S. Moebus, K. Kroger, A. Stang, S. Mohlenkamp, N. Dragano, A. Schmermund, M. Memmesheimer, R. Erbel, and K. H. Jockel. 2009. Residential exposure to urban air pollution, ankle-brachial index, and peripheral arterial disease. Epidemiology 20 (2):280–88. doi:10.1097/EDE.0b013e3181961ac2.
- Hoffmann, B., S. Moebus, S. Mohlenkamp, A. Stang, N. Lehmann, N. Dragano, A. Schmermund, M. Memmesheimer, K. Mann, R. Erbel, et al. 2007. Residential exposure to traffic is associated with coronary atherosclerosis. Circulation 116 (5):489–96. doi:10.1161/CIRCULATIONAHA.107.693622.
- Jerrett, M., R. T. Burnett, R. Ma, C. A. Pope 3rd, D. Krewski, K. B. Newbold, G. Thurston, Y. Shi, N. Finkelstein, E. E. Calle, et al. 2005. Spatial analysis of air pollution and mortality in Los Angeles. Epidemiology 16 (6):727–36. doi:10.1097/01.ede.0000181630.15826.7d.
- Keebaugh, A. J., C. Sioutas, P. Pakbin, J. J. Schauer, L. B. Mendez, and M. T. Kleinman. 2015. Is atherosclerotic disease associated with organic components of ambient fine particles? Sci. Total Environ. 533:69–75. doi:10.1016/j.scitotenv.2015.06.048.
- Kim, S., P. A. Jaques, M. Chang, J. R. Froines, and C. Sioutas. 2001. Versatile aerosol concentration enrichment system (VACES) for simultaneous in vivo and in vitro evaluation of toxic effects of ultrafine, fine and coarse ambient particles Part I: Development and laboratory characterization. J. Aerosol. Sci. 32 (11):1281–97. doi:10.1016/S0021-8502(01)00057-X.
- Kleinman, M. T., A. Hamade, D. Meacher, M. Oldham, C. Sioutas, B. Chakrabarti, D. Stram, J. R. Froines, and A. K. Cho. 2005. Inhalation of concentrated ambient particulate matter near a heavily trafficked road stimulates antigen-induced airway responses in mice. J. Air Waste Manage. Assoc. 55 (9):1277–88. doi:10.1080/10473289.2005.10464727.
- Knowlton, K., C. Hogrefe, B. Lynn, C. Rosenzweig, J. Rosenthal, and P. L. Kinney. 2008. Impacts of heat and ozone on mortality risk in the new york city metropolitan region under a changing climate. In Seasonal forecasts, climatic change and human health: Health and climate, ed. M. C. Thomson, R. Garcia-Herrera, and M. Beniston, 143–60. Dordrecht: Springer Netherlands.
- Koton, S., N. Molshatzki, V. M. Yuval, D. M. Broday, Y. Drory, D. M. Steinberg, and Y. Gerber. 2013. Cumulative exposure to particulate matter air pollution and long-term post-myocardial infarction outcomes. Prev. Med. 57 (4):339–44. doi:10.1016/j.ypmed.2013.06.009.
- Krewski, D., M. Jerrett, R. T. Burnett, R. Ma, E. Hughes, Y. Shi, M. C. Turner, C. A. Pope 3rd, G. Thurston, E. E. Calle, et al. 2009. Extended follow-up and spatial analysis of the American Cancer Society study linking particulate air pollution and mortality. Res. Rep. Health Eff. Inst. (140):5–114. discussion 115-36.
- Kuhn, T., S. Biswas, and C. Sioutas. 2005. Diurnal and seasonal characteristics of particle volatility and chemical composition in the vicinity of a light-duty vehicle freeway. Atmos. Environ. 39 (37):7154–66. doi:10.1016/j.atmosenv.2005.08.025.
- Kunzli, N., M. Jerrett, R. Garcia-Esteban, X. Basagana, B. Beckermann, F. Gilliland, M. Medina, J. Peters, H. N. Hodis, and W. J. Mack. 2010. Ambient air pollution and the progression of atherosclerosis in adults. PLoS ONE 5 (2):e9096. doi:10.1371/journal.pone.0009096.
- Kunzli, N., M. Jerrett, W. J. Mack, B. Beckerman, L. LaBree, F. Gilliland, D. Thomas, J. Peters, and H. N. Hodis. 2005. Ambient air pollution and atherosclerosis in Los Angeles. Environ. Health Perspect. 113 (2):201–06. doi:10.1289/ehp.7523.
- Kurhanewicz, N., R. McIntosh-Kastrinsky, H. Tong, L. Walsh, A. K. Farraj, and M. S. Hazari. 2014. Ozone co-exposure modifies cardiac responses to fine and ultrafine ambient particulate matter in mice: Concordance of electrocardiogram and mechanical responses. Part Fibre Toxicol. 11 (1):54. doi:10.1186/s12989-014-0054-4.
- Landrigan, P. J., R. Fuller, N. J. R. Acosta, O. Adeyi, R. Arnold, N. Basu, A. B. Baldé, R. Bertollini, S. Bose-O’Reilly, J. I. Boufford, et al. 2017. The Lancet Commission on pollution and health. Lancet. doi:10.1016/S0140-6736(17)32345-0.
- Li, N., J. R. Harkema, R. P. Lewandowski, L. A. Meiying Wang, G. R. Bramble, Z. N. Gookin, M. T. Kleinman, C. Sioutas, and A. E. Nel. 2010. Ambient ultrafine particles provide a strong adjuvant effect in the secondary immune response: Implication for traffic-related asthma flares. Am. J. Physiol. Lung Cell. Mol. Physiol. 299 (3):L374–L383. doi:10.1152/ajplung.00115.2010.
- Liao, D. P., J. W. Cai, R. W. Barnes, H. A. Tyroler, P. Rautaharju, I. Holme, and G. Heiss. 1996. Association of cardiac autonomic function and the development of hypertension - The ARC study. Am. J. Hypertens. 9 (12):1147–56. doi:10.1016/S0895-7061(96)00249-X.
- Lippmann, M., K. Ito, J. S. Hwang, P. Maciejczyk, and L. C. Chen. 2006. Cardiovascular effects of nickel in ambient air. Environ. Health Perspect. 114 (11):1662–69. doi:10.1289/ehp.9150.
- Lossius, K., M. Eriksen, and L. Walloe. 1994. Thermoregulatory fluctuations in heart-rate and blood-pressure in humans - effect of cooling and parasympathetic blockade. J. Auton. Nerv. Syst. 47 (3):245–54. doi:10.1016/0165-1838(94)90185-6.
- Martin, M., R. Y. W. Chang, B. Sierau, S. Sjogren, E. Swietlicki, J. P. D. Abbatt, C. Leck, and U. Lohmann. 2011. Cloud condensation nuclei closure study on summer arctic aerosol. Atmos. Chem. Phys. 11 (22):11335–50. doi:10.5194/acp-11-11335-2011.
- Michaels, R. A., and M. T. Kleinman. 2000. Incidence and apparent health significance of brief airborne particle excursions. Aerosol. Sci. Technol. 32 (2):93–105. doi:10.1080/027868200303803.
- Mirowsky, J. E., L. Jin, G. Thurston, D. Lighthall, T. Tyner, L. Horton, K. Galdanes, S. Chillrud, J. Ross, K. E. Pinkerton, et al. 2015. In vitro and in vivo toxicity of urban and rural particulate matter from California. Atmos. Environ. (1994) 103 (256–262). doi: 10.1016/j.atmosenv.2014.12.051.
- Mirvis, D. M. 1988. Physiologic bases for anterior ST segment depression in patients with acute inferior wall myocardial infarction. Am. Heart J. 116 (5 Pt 1):1308–22. doi:10.1016/0002-8703(88)90456-5.
- Mitchell, G. F., A. Jeron, and G. Koren. 1998. Measurement of heart rate and Q-T interval in the conscious mouse. Am. J. Physiol. 274 (3):H747–51. doi:10.1152/ajpheart.1998.274.3.H747.
- Oldham, M. J., R. F. Phalen, R. J. Robinson, and M. T. Kleinman. 2004. Performance of a portable whole-body mouse exposure system. Inhal. Toxicol. 16 (9):657–62. doi:10.1080/08958370490464670.
- Pardo, M., F. Xu, X. Qiu, T. Zhu, and Y. Rudich. 2018. Seasonal variations in fine particle composition from Beijing prompt oxidative stress response in mouse lung and liver. Sci. Total Environ. 626:147–55. doi:10.1016/j.scitotenv.2018.01.017.
- Pope, C. A., A. J. Cohen, and R. T. Burnett. 2018. Cardiovascular disease and fine particulate matter: Lessons and limitations of an integrated exposure-response approach. Circ. Res. 122 (12):1645–47. doi:10.1161/CIRCRESAHA.118.312956.
- Pope, C. A., 3rd, and D. W. Dockery. 2006. Health effects of fine particulate air pollution: Lines that connect. J. Air Waste Manag. Assoc. 56 (6):709–42. doi:10.1080/10473289.2006.10464485.
- Pope, C. A., M. Ezzati, J. B. Cannon, R. T. Allen, M. Jerrett, and R. T. Burnett. 2018. Mortality risk and PM2.5 air pollution in the USA: An analysis of a national prospective cohort. Air Qual. Atmos. Health 11 (3):245–52. doi:10.1007/s11869-017-0535-3.
- Pope, C. A., R. T. Burnett, G. D. Thurston, M. J. Thun, E. E. Calle, D. Krewski, and J. J. Godleski. 2004. Cardiovascular mortality and long-term exposure to particulate air pollution: Epidemiological evidence of general pathophysiological pathways of disease. Circulation 109:71–77. doi:10.1161/01.CIR.0000108927.80044.7F.
- Ramanathan, G., F. Yin, M. Speck, C. H. Tseng, J. R. Brook, F. Silverman, B. Urch, R. D. Brook, and J. A. Araujo. 2016. Effects of urban fine particulate matter and ozone on HDL functionality. Part Fibre Toxicol. 13(1):26–36. doi:10.1186/s12989-016-0139-3.
- Ren, C., G. M. Williams, L. Morawska, K. Mengersen, and S. Tong. 2008. Ozone modifies associations between temperature and cardiovascular mortality: Analysis of the NMMAPS data. Occup. Environ. Med. 65 (4):255. doi:10.1136/oem.2007.033878.
- Rogge, W. F., M. A. Mazurek, L. M. Hildemann, G. R. Cass, and B. R. T. Simoneit. 1993. Quantification of urban organic aerosols at a molecular level: Identification, abundance and seasonal variation. Atmos. Environ. Part A. General Topics 27 (8):1309–30. doi:10.1016/0960-1686(93)90257-Y.
- Romero Lankao, P. 2007. Are we missing the point?: Particularities of urbanization, sustainability and carbon emissions in Latin American cities. Environ. Urban 19 (1):159–75. doi:10.1177/0956247807076915.
- Rowan, W. H., M. J. Campen, L. B. Wichers, and W. P. Watkinson. 2007. Heart rate variability in rodents: Uses and caveats in toxicological studies. Cardiovasc. Toxicol. 7 (1):28–51. doi:10.1007/s12012-007-0004-6.
- Russell, M., D. T. Allen, D. R. Collins, and M. P. Fraser. 2004. Daily, seasonal, and spatial trends in PM2.5 mass and composition in southeast texas special issue of aerosol science and technology on findings from the fine particulate matter supersites program. Aerosol. Sci. Technol. 38 (sup1):14–26. doi:10.1080/02786820390229318.
- Scott, J. L., and R. M. Walls. 1985. QT interval prolongation. J. Emerg. Med. 3 (3):221–25. doi:10.1016/0736-4679(85)90076-9.
- Simula, S., E. Vanninen, S. Lehto, A. Hedman, P. Pajunen, M. Syvänne, and J. Hartikainen. 2014. Heart rate variability associates with asymptomatic coronary atherosclerosis. Clin. Auton. Res. 24 (1):31–37. doi:10.1007/s10286-013-0220-z.
- Speerschneider, T., and M. B. Thomsen. 2013. Physiology and analysis of the electrocardiographic T wave in mice. Acta Physiol. (Oxf) 209 (4):262–71. doi:10.1111/apha.12172.
- Straus, S. M., J. A. Kors, M. L. De Bruin, C. S. van der Hooft, A. Hofman, J. Heeringa, J. W. Deckers, J. H. Kingma, M. C. Sturkenboom, B. H. Stricker, et al. 2006. Prolonged QTc interval and risk of sudden cardiac death in a population of older adults. J. Am. Coll. Cardiol. 47 (2):362–67. doi:10.1016/j.jacc.2005.08.067.
- Sun, Q., A. Wang, X. Jin, A. Natanzon, D. Duquaine, R. D. Brook, J. G. Aguinaldo, Z. A. Fayad, V. Fuster, M. Lippmann, et al. 2005. Long-term air pollution exposure and acceleration of atherosclerosis and vascular inflammation in an animal model. JAMA 294 (23):3003–10. doi:10.1001/jama.294.23.3003.
- Sun, Q. H., A. X. Wang, X. M. Jin, A. Natanzon, D. Duquaine, R. D. Brook, J. G. S. Aguinaldo, Z. A. Fayad, V. Fuster, M. Lippmann, et al. 2005. Long-term air pollution exposure and acceleration of atherosclerosis and vascular inflammation in an animal model. JAMA 294 (23):3003–10. doi:10.1001/jama.294.23.3003.
- Tong, H., G. A. Rappold, D. Diaz-Sanchez, E. S. Steck, J. Berntsen, E. W. Cascio, B. R. Devlin, and M. J. Samet. 2012. Omega-3 fatty acid supplementation appears to attenuate particulate air pollution–induced cardiac effects and lipid changes in healthy middle-aged adults. Environ. Health Perspect. 120 (7):952–57. doi:10.1289/ehp.1104472.
- Tonne, C., J. Yanosky, A. Gryparis, S. Melly, M. Mittleman, R. Goldberg, S. von Klot, and J. Schwartz. 2009. Traffic particles and occurrence of acute myocardial infarction: A case-control analysis. Occup. Environ. Med. 66 (12):797–804. doi:10.1136/oem.2008.045047.
- Xu, L., S. Suresh, H. Guo, R. J. Weber, and N. L. Ng. 2015. Aerosol characterization over the southeastern United States using high-resolution aerosol mass spectrometry: Spatial and seasonal variation of aerosol composition and sources with a focus on organic nitrates. Atmos. Chem. Phys. 15 (13):7307–36. doi:10.5194/acp-15-7307-2015.
- Xu, Z., X. Xu, M. Zhong, I. P. Hotchkiss, R. P. Lewandowski, J. G. Wagner, L. A. Bramble, Y. Yang, A. Wang, J. R. Harkema, et al. 2011. Ambient particulate air pollution induces oxidative stress and alterations of mitochondria and gene expression in brown and white adipose tissues. Part Fibre Toxicol. 8:20. doi:10.1186/1743-8977-8-20.
- Zanobetti, A., D. R. Gold, P. H. Stone, H. H. Suh, J. Schwartz, and B. A. Coull. 2010. Reduction in heart rate variability with traffic and air pollution in patients with coronary artery disease. Environ. Health Perspect. 118:324–30. doi:10.1289/ehp.0901003.
- Zanobetti, A., and J. Schwartz. 2005. The effect of particulate air pollution on emergency admissions for myocardial infarction: A multicity case-crossover analysis. Environ. Health Perspect. 113 (8):978–82. doi:10.1289/ehp.7550.