
 ?Mathematical formulae have been encoded as MathML and are displayed in this HTML version using MathJax in order to improve their display. Uncheck the box to turn MathJax off. This feature requires Javascript. Click on a formula to zoom.
ABSTRACT
Particulate matter (PM) from poultry production facilities may strongly affect the health of animals and workers in the houses, and PM emitted to the ambient air is an important pollution source to the surrounding areas. Aviary system is considered as a welfare friendly production system for laying hens. However, its air quality is typically worse as compared with conventional cage systems, because of the higher PM concentration of indoor air and other airborne contaminants. Furthermore, PM’s physical property, which has a direct impact on the penetration depth into the lungs of the birds and humans, is largely unknown for the aviary system. Therefore, a systematic method was utilized to investigate the characteristics of particles in the aviary house with large cage aviary unit system (LCAU) in Beijing, China. For the field measurements, three measuring locations were selected with two inside and one outside the house with LCAU to continuously monitor PM concentrations and collect the samples for particle size distribution (PSD) analysis. Results showed that PM2.5, PM10, and total suspended particulate (TSP) concentrations averaged at 0.037 ± 0.025 mg/m3, 0.42 ± 0.10 mg/m3, and 1.92 ± 1.91 mg/m3, respectively. Particle concentrations increased from October to December due to less ventilation as the weather got colder, and were generally affected by stocking density, ventilation rate, birds’ activities, and housing system. Meanwhile, indoor PM2.5 concentration was easily impacted by the ambient air quality. Mass median diameter (MMD) and mass geometric standard deviation (MGSD) of the TSP during the measurement were 18.92 ± 7.08 μm and 3.11 ± 0.31, respectively. Count median diameter (CMD) and count geometric standard deviation (CGSD) were 1.94 ± 0.14 μm and 1.48 ± 0.08, respectively. Results indicated that the aviary system can attain a good indoor condition by suitable system design and environment control strategy.
Implications: Indoor PM2.5 concentration of the layer house can be significantly affected by ambient air quality when the air quality index (AQI) was larger than 100. PM2.5 and PM10 concentrations of the layer house with a LCAU system were comparable to the cage system. TSP concentration was higher, and PM size was larger than most of the cage system. System design, larger space volume, and higher ventilation rate were the main influence factors. Good indoor environment of the aviary system can be achieved through the reasonable design of the production system and appropriate environment control strategy.
Introduction
Air in poultry houses contains a large quantity of air pollutants, especially for particulate matter (PM) (Takai et al. Citation1998), and the indoor PM presents great risks to the respiratory health of both animals and human beings. For laying hens, particles with the sizes between 3.7 and 7 μm can be stuck in the head and the anterior trachea, and the 1.1 μm particles are mostly deposited in chicken’s lungs and posterior air sacs (Hayter and Besch Citation1974). Chronic inhalation of high PM concentration increases the mortality of the birds (Guarino, Caroli, and Navarotto Citation1999). As a media, PM also carries lots of bacteria. PM2.5, for instance, could penetrate into people’s alveoli (Zhang Citation2005), and long term of exposure to high level of PM and endotoxin is potentially harmful to the respiratory system of farmers as well (Basinas et al. Citation2015; Radon et al. Citation2001). Meanwhile, an indoor environment with high PM concentration also weakens the visibility and consequently affects the daily operations of the workers. Previous studies have characterized PM concentration, size distribution, and spatial variation in conventional laying hen houses, and documented that housing system, animal activities, and environment control strategy are the major factors affecting the indoor PM concentration and associated emissions (Lin et al. Citation2017; Takai et al. Citation1998).
Since 2012, the European Union (EU) has banned the conventional cages and regulated that adequate litter areas of the alternative systems for the birds to rest and quietly laying eggs should be provided (Council of the European Union Citation1999). The purpose of the regulation is to improve layers welfare. However, the indoor environment of the welfare-oriented system has much higher PM concentration than conventional cage system. The PM concentrations of the aviary system, a welfare friendly production system, were reported to be generally 2 to 10, or even 50 folds higher than conventional housing systems (Le Bouquin et al. Citation2013; Lin et al. Citation2017; Nimmermark et al. Citation2009; Takai et al. Citation1998). Under current environment control strategy of the aviary housing, the provision of the litter on the floor, which could not be timely cleaned out, is commonly believed to be the dominating production source of particle and other air contaminates (Yang et al. Citation2018; Zheng et al. Citation2013).
Although there is no such a legislation as the Council Directive 99/74/EC in China, the recognition of the importance of animal welfare in China is rapidly growing, among the academic community in particular (Meng et al. Citation2012). Thus, a new large cage aviary unit (LCAU) system for laying hens was developed at China Agricultural University (), to trigger the improvement of the layer welfare in the nation. The multi-tier LCAU allowed the free access of birds to different wire-mesh floors, which was equipped with manure belts at the bottom to receive and timely remove the droppings. Unlike the aviary system currently used in European Union, there was no litter provision on the floor of the newly designed LCAU system. Studies have investigated the PM characteristics of the aviary system in the EU and the United States. However, the fundamental PM information is unavailable for the LCAU system. Furthermore, the PM characteristics for the alternative system, physical properties for instance, are still largely unknown (Lin et al. Citation2012; Ni et al. Citation2012; Wang-Li et al. Citation2013), which are the prerequisites to evaluate the air quality of the laying hen houses and the risks to the health of people and chickens. In addition, this information, which is governing the particle behavior, can provide essential data for PM mitigation strategy (Hu et al. Citation2016; Yang et al. Citation2015).
Figure 1. The locations for PM concentration monitoring and PSD sampling: (a) Schematic layout of the measured laying hen house with LCAU; and (b) Vertical plan of the LCAU.
As reported, animal farms are the point sources of PM emission to atmosphere (Takai et al. Citation1998; Winkel et al. Citation2015). Evidence has shown that the emission indeed affects the air quality of the residential district (Chen and Zhao Citation2011), but attention is seldom paid on the impacts of ambient air quality on the PM concentrations inside the livestock houses. Some precautions during the PM measurement or data correction after collecting should be taken into account.
The objectives of this study were to (1) quantify PM2.5, PM10, and total suspended particulate (TSP) concentrations of a welfare friendly system of the LCAU without litter provision for layer production; (2) investigate its PM size distribution; and (3) reveal the causation of PM properties difference between LCAU, conventional cage, enriched cage, and other aviary systems.
Materials and methods
Surveyed laying hen house with LCAU
Field data collection was conducted from October 1, 2017 to January 31, 2018, in an experimental pilot-scale laying hen house (9.0 m W × 28.2 m L × 3.6 m H) at the Experimental Station of China Agricultural University in Beijing (). This house was equipped with one and a half rows of newly developed multi-tier LCAU. As shown in , the LCAU consisted of aviary cages, hopper trolleys, feeders, nipple drinkers, perches, and nest boxes. A wire floor was installed at the bottom of the unit, and beneath where the manure belts were equipped. All the measurements were carried out within the cage 1. More details of LCAU were given by Yang et al. (Citation2018).
The house was designed with a negative-pressure tunnel ventilation system. Three axial flow fans (WUSUN Co., LTD, Guangdong, China) were installed on the gable wall to ventilate the house. From spring to autumn, axial fans were automatically operated based on indoor air temperature, while the fans were controlled by carbon dioxide (CO2) concentration in winter. A total of 1,800 hybrid White Leghorn layers (Yukou Jing Pink I layer, Yukou, Beijing, China) at 430-day-old (onset age) were evenly allocated inside the aviary units, with a space allowance of 987 cm2/hen. Light was on at 5:00 a.m. and off at 9:00 p.m., following a 16 hr light:8 hr dark schedule. Feed was automatically delivered to the trough by the hopper trolley, and the birds were fed twice a day at 8:00 a.m. and 2:00 p.m., respectively. Collected chicken feces were delivered to the end of the house by manure belts, and then scraped onto a manure conveyor to convey outside at 6:00 p.m. every other day. Eggs were manually packed after being automatically transferred to the collection platform at the front frame by the conveyor belts.
PM concentration monitoring
PM concentrations (PM2.5, PM10, and TSP) inside and outside the layer house were continuously monitored using self-developed portable devices over three months in order to observe its seasonal variation and spatial distribution. With the purpose to find difference of PM properties between air inlet side and outlet side, a monitoring point was set in the front (air inlet end) and another one was at the back (exhaust fan end) of the house, respectively. Two locations were both set at the height of 1.7 m above the floor to monitor the PM concentration of the animal occupation zone (AOZ) (), which were in the middle position of the aviary system. The sampling height was also considered at the respiratory level of the workers inside the house. Three portable devices were located at each measuring point (), and the mean value represented the PM concentration of the air inlet or outlet. The outside monitoring point was set at 1.7 m above the ground, right in front of the evaporative pad, to provide the background PM concentration information.
In order to get a full knowledge of the PM distribution regularity in aviary house, multiple real-time PM monitoring points should be set; however, the approved PM measuring devices like the tapered element oscillating microbalances (TEOMs) are too expensive to meet this large quantity requirement. For the self-developed portable device, an Arduino Mega2560 microcontroller (Arduino, www.arduino.cc) was paired with a sensor shield (including a data logging module) from DFRobot (V2.4, DFRobot, Inc., Shanghai, China). Time module (DS1502), OLED screen, and PM sensors were wired to the shield. Real-time PM concentration data were saved as a text file into the micro SD card at a 20-second interval. For each device, a light scattering sensor with 0–1 mg/m3 measurement range, and 1 μg/m3 sensitivity (PMS5003T, Plantower, Inc., Beijing, China) was screened out to measure the mass concentrations of PM2.5 and PM10, while another sensor with 0–20 mg/m3 measurement range and 1 μg/m3 sensitivity (SDS198, Nova, Inc., Jinan, Shandong, China) was integrated to measure the TSP mass concentration. These low-cost sensors were based on the Mie scattering theory and many of them were validated to response correlates well with research-grade instruments (Kelly et al. Citation2017; Liu et al. Citation2017). The accuracy can reach ± 10 μg/m3 while testing. Before field measurement, the developed devices were all calibrated using the TEOMs.
PM sampling for weighing and size analyzing
In order to measure the mass-based size distribution and to further analyze its size distribution in count of the particles, two Andersen 8-Stage Non-Viable Ambient Particle Sizing Samplers (20–800, Thermo Scientific, Inc., Franklin, MA) were applied to collect the particles weekly. PM samplings were taken at a flow rate of 28.32 L/min for 24 hr each time at two locations (front and back) of the aviary cage (). The 8-stage sampler was an multi-orifice cascade impactor, which had a metal plate with a polytetrafluoroethylene (PTFE) filter (81 mm ϕ, 0.2 μm pore size) at each stage to measure the particle size concentrations with the size ranges of smaller than 0.4, 0.4– 0.7, 0.7– 1.1, 1.1– 2.1, 2.1– 3.3, 3.3– 4.7, 4.7– 5.8, 5.8– 9.0, and larger than 9.0 μm, respectively. Before weighing, all filters were stored in a dryer at 20°C for 48 hr. Filters were weighed before and after sampling for pre- and post-weights.
PM size distribution analysis
Filters of the cascade impactor with collected particles were immersed into ethanol solution for 15 min ultrasonic bathes to extract PM for particle size distribution (PSD) analysis (Wang-Li et al. Citation2013). The PSD of the collected samples from layer house was measured by a LA-960 laser scattering analyzer (Horiba, Japan) with the detectable size ranges of 0.01 to 5000 μm. Assuming that the density of particles in all sizes was equivalent (1 g/cm3), the volume distribution of particles measured by the instrument could be treated as mass-based distribution (Buser et al. Citation2008; Yang et al. Citation2015; Zheng et al. Citation2013). The most important physical parameters of the PM, including mass median diameter (MMD), count median diameter (CMD), and their geometric standard deviations (MGSD and CGSD), were then automatically calculated by the analyzer. Since there was no standard refractive index (RI) for the PM from animal feeding operation (AFO), a RI of 1.5 was selected in this study referring to a previous research (Wang-Li et al. Citation2013).
Screening the smoggy days on PM measurement
The air quality index (AQI) is an indicator usually used for reflecting daily air quality in weather report. In this article, the AQI equals to the maximum of individual air quality indexes (IAQI) by referring to the computing method of China, and the pollutant corresponding to the highest IAQI is defined as the primary pollutant (Ministry of Ecology and Environment of the People’s Republic of China Citation2012). When AQI was higher than 100, the primary pollutant was considered as non-attainment pollutant.
In this study, a field measurement on PM characteristics of a laying hen house was carried out from autumn to winter in Beijing. During the period, some smoggy days occurred, and AQI was generally high, which may theoretically result in an overestimation of the PM concentration and uncertainty of size distribution if the data on the days are not filtrated out. In order to eliminate the influence of smoggy days on the PM characteristics, a hierarchical cluster analysis was applied based on the mass-based composition data obtained from Anderson samplers.
The particle size composition in the mass of a day was treated as an observation (detailed mass compositions are presented in Table A1 in the Supplementary Appendix). In the cluster procedure, the squared Euclidean distance was used to evaluate the dissimilarity between two observations. Two m dimensions observations x = (zx1, zx2, …, zxm) and y = (zy1, zy2, …, zym) with the shortest distance among all the samples would be classified as one cluster. Squared Euclidean distance was defined as follows:
Assuming CK and CL, two clusters containing different observations were merged to form cluster CM. The distance between two clusters ( was calculated using the average linkage method with the following equation:
where and
stood for the number of observations in CK and CL. Combining Equations (1) and (2), then
could be presented as
where was
and
was
. The
and
represented the ith and jth observation (row vector if it was coordinate data), respectively. The
and
were the mean vector for cluster CK and CL. Inner environment of the house would not greatly change if there was no external disturbance and all observations should tend to join in one cluster. In practice, big variances existed because of the outdoor atmospheric pollution and the effects had been removed before analyzing the PM concentrations and the PSD.
Data processing and statistical analysis
The original experimental data were processed and statistically analyzed with Excel 2013 (Microsoft, USA). SAS 9.2 software analysis of variance (ANOVA) was used to analyze the statistically significant difference, which was defined when the P value was less than 0.05 (P < 0.05). Data were expressed as mean ± standard deviation (SD). Average linkage method was applied for clustering by SAS 9.2 software (SAS Institute Inc., Cary, NC, USA). The schematic layout of the measured laying hen house was plotted by AutoCAD 2014 (Autodesk Inc., USA).
Results and discussion
Influence of ambient air quality on indoor PM concentration measurement
Stripped and shadow blocks in presented the five clusters, and the proportion of variance reached 83.9%. The horizontal distance between each group represented their dissimilarities, and dates labeled with different colors stood for the level of AQI in that day. The dates with green and yellow background, representing excellent and good AQI, were sorted into two groups. The difference between the two clusters could be explained by the high ventilation rate in October and early November, and the total mass concentration of PM inside during this period was lower than that in winter. Hence the days in December and January were assorted as another group. The other three days, in which the PM size compositions were distinguished from the above two groups, were lightly or moderately polluted. During the measurement, the days with different AQI were allocated into three individual groups.
Figure 2. Classification of the PM composition based on hierarchical cluster analysis in the days with different atmospheric air quality. Date with green background – Excellent air quality (AQI: 0– 50); Yellow – Good (AQI: 50– 100); Orange – Lightly polluted (AQI: 100– 150); Red – Moderately polluted (AQI: 150– 200).
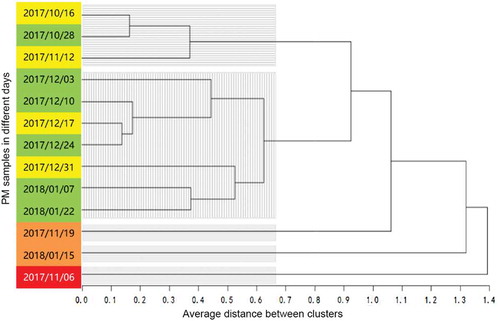
On these days, the primary pollutant was the PM2.5, which occurred on three individual polluted days, namely Nov. 19, Jan. 15, and Nov. 6, during the field measurement. When it happened, a considerable part of the collected PM in the aviary house was derived from the atmosphere. The ambient air quality on smoggy days did have a significant impact on indoor PM concentration, although the evaporative pad at the air inlets functioned as an air scrubber that can filter out the coarse particles to some extent (Almuhanna et al. Citation2009). Some particles, in particular small ones, which do not easily settle down, could still penetrate into the interior space through the joints between doors, windows, walls, and even the evaporative pad. In order to reveal the real PM characteristics of the layer house, data from those smoggy days with the ambient AQI over 100 were excluded in the PM analysis in this article.
Generally, the specific regulation between the inside and outside PM concentrations of the livestock housing is still not very clear. Joo et al. (Citation2013) found that ambient PM2.5 concentration sometimes was even higher than that inside the naturally ventilation dairy barns according to a two-year field study. However, another measurement conducted in a poultry house by Shen et al. (Citation2018) demonstrated that no significant difference could be found between the indoor and outdoor PM2.5 concentrations. Even the infiltration function of PM transmission via ventilation system existed, atmospheric air quality may still have direct impact on the indoor PM concentration of animal barns, especially on smoggy days, and further study of it is suggested.
PM mass concentrations in laying hen house with LCAU
As shown in , the overall average concentrations of PM2.5, PM10, and TSP of the layer house with LCAU during the measurements were 0.037 ± 0.025, 0.42 ± 0.10, and 1.92 ± 1.91 mg/m3, respectively. Generally, PM2.5 and PM10 concentration had subtle differences compared with the conventional cage (CC) system and the enriched cage (EC) system in other research, but they were lower than the values reported from other aviary (AV) systems. Regarding the TSP concentration, no apparent difference was observed when compared with the winter data of a CC system in China documented by He (Citation2008). He (Citation2008) reported the TSP concentration inside an eight-tiered cage house was much higher than other studies, which was commonly within the ranges of 0.99 to 1.22 mg/m3 (Almuhanna Citation2013; Takai et al. Citation1998). The PM10 emission rate was approximately 29.5 mg/d/hen in this case, much lower than the previously published flux of 138.0 mg/d/hen from the AV system. At the same time, it was about 1.8 folds greater than the documented emission rate (16.5 mg/d/hen) from the EC system, and approximately 20% higher than that in the CC system (24.5 mg/d/hen) when daily average ambient temperature ranged from 10 to 20°C (Shepherd et al. Citation2015), which was similar to the thermal environment in this study.
Table 1. Overall average PM concentrations in varied production systems, expressed in mean ± SD (mg/m3).
Floor area (space allowance) (cm2/hen) is a customary usage to describe the size of the living space for the birds, which is typically considered as an important welfare indicator. The AV system is usually considered as an animal-friendly production system because of its enriched facilities provision and large space for the hens to perform their natural behaviors. In this study, the floor area of the developed LCAU (987 cm2/hen) was greater than that of the CC and EC systems. Moreover, a definition of volume per hen (m3/hen) in this article, defined as the volume of poultry house divided by the total number of laying hens, was used to demonstrate the relation between PM concentration and space allowance. Although the floor area of the LCAU was lower than other reported aviary systems, its volume of 0.29 m3/hen was the largest, as indicated in . Large floor area and the space volume of the LCAU might greatly contribute to its comparable air quality to CC system, for PM2.5 and PM10 in particular. Large particles, such as feathers (Cambra-Lopez et al. Citation2011b), are easily aroused by the turbulence caused by bird movements in AV, which might explain why TSP concentrations in LCAU were higher. Apparently, more activities of the birds in the LCAU system were performed, compared with CC and EC operations.
Although the experiment was conducted during relatively cold weather in this study, the average PM concentrations all remained at a similar level as that in CC systems. The ventilation strategies in this pilot-scale laying hen house changed with seasons during the measurement, and its ventilation rate was higher compared with other poultry farms. A high ventilation rate contributed to a relatively good environment with low PM concentration inside the house, but may result in higher emission. It was similar to the finding of Costa and Guarino (Citation2009), who reported the PM2.5, PM10, and TSP concentrations were 0.032, 0.238, and 0.444 mg/m3, respectively, in an AV system at the average ventilation rate of 2.52 m3/h/hen.
In the LCAU system, PM2.5 and PM10 concentrations were much lower compared with other AV systems operated with littered area and ground surface. In EU countries, straw, wood shavings, or alfalfa are usually recycled for litter spreading on the floor. Previous results of four aviary houses in the Netherlands with litter floors showed much higher PM2.5 and PM10 concentrations, which were 0.217 mg/m3 and 3.362 mg/m3, respectively (Winkel et al. Citation2015). The litter-feces mixture on the floor was concluded as a major source resulting in much higher airborne fine particle concentrations in these aviary system houses. The LCAU in this study was installed with wire floors and no litter was supplied, which was considered as another major reason for the relatively good indoor air quality.
TSP variation inside the house
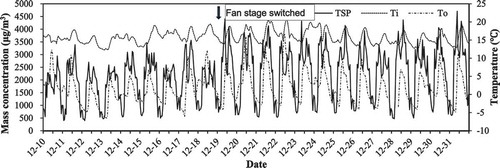
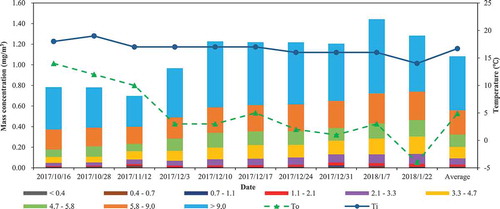
An example of TSP concentration variation inside the house in December was plotted in Figure 3. TSP concentration was within a range of 0.40–4.71 mg/m3, which was increasing as the ventilation decreased due to the weather getting colder. The overall average TSP concentration during this time was 2.16 ± 1.00 mg/m3, and reached the highest in the end of December.
A clear diurnal pattern was found. Indoor TSP concentration began to sharply increase when chicken woke up and performed activities after the lights were turned on at 5:00 a.m., and dropped down to around 0.6 mg/m3 at night after the birds rested. Two peaks were observed daily with the occurrence at approximately 8:00 a.m. and 2:00 p.m., respectively, which mainly corresponded to the feeding operations at the hours. For this aviary housing, manure was removed every two days from 5:00 p.m. to 6:00 p.m., and an increasing of TSP concentration was also observed during the cleaning.
From December 19, ventilation system was switched to stage 3 with the operation of fan 3 (800 mm diameter) instead of fan 1 (1,260 mm diameter), associated with the average ventilation rate decreasing from 5,313 m3/h to 3,750 m3/h and the average TSP concentration increasing from 1.92 mg/m3 to 2.36 mg/m3. Under the stage, the fan was intermittently operated based on the CO2 concentration inside the house, and typically ran in the midnight to exhaust accumulated CO2. The process might arise the dust inside the house, especially for coarse particulate, and therefore, another small peak at midnight was detected, as shown in . During the whole measurement, indoor TSP concentrations were always significantly higher than that of the ambient and showed a clear diurnal pattern regardless of atmospheric environment. Since bacteria are usually attached to large PM or the bacteria themselves have particle morphology and diffuse in the same dynamic way as particles, plenty of TSP emitted from poultry farms may contaminate the surrounding environment, which should be paid attention to.
Figure 3. Variation of TSP concentration inside the laying hen house with LCAU in December, 2017. To = Temperature outside the laying hen house; Ti = Temperature inside the laying hen house.
Particle size distribution in mass
PM mass distributions of the air inlet side (East) and outlet side (West) of the laying hen house are presented in and . At both sides, the PM had a mass fraction peak at the range of 4.7 to 5.8 μm, and exhibited obvious bimodal distribution curves as illustrated in and . However, particles smaller than 1.1 μm at the West accounted for a higher mass fraction than the East. Generally, the PSD of PM tends to follow a single-mode (peak) lognormal distribution in an ideal situation (Hinds Citation1999). The observed bimodal lognormal distribution in this study indicated that the sources of PM from this aviary house were more complicated and the particles were not monodispersed. A similar pattern was also found by Van Ransbeeck et al. (Citation2012) in the fattening pig facility.
Figure 4. Mass distribution at the air inlet (East) end of laying hen house.
Figure 5. Mass distribution at the air outlet (West) end of laying hen house.
As documented, feather, feed, and manure are the major particle sources inside the layer house, while the manure and feed contribute more to the fine particulate generation (Cambra-Lopez et al. Citation2011a). illustrated that feces were conveyed by the manure belt to the rear of this surveyed house. Therefore, the particles generated from manure may have more impact on the mass distribution at the outlet end as shown in , for those PM smaller than 1.1 μm in particular. The result is consistent with previous findings on the PM size distribution of cage system for layer production (Cambra-Lopez et al. Citation2011b).
The observed MMDs were ranged from 11.34 to 31.78 μm, and MGSDs were from 2.79 to 3.93 μm. The average MMDs and MGSDs at the inlet end were 19.66 ± 8.16 μm and 3.07 ± 0.07, respectively; and they were 18.19 ± 6.70 μm and 3.15 ± 0.45 at the outlet end (). No statistical significance was found on MMDs and MGSDs of the particles collected from different positions (P > 0.05). The MMD standard error was high compared to other studies. One reason for this result is that the Anderson cascade impactor did not pair with preseparator, which may lead to the consequence of large particle bouncing and re-entrainment errors. Another reason that caused this situation is the activity of birds in the aviary system may vary greatly and make the concentration of large particle fluctuate widely. Therefore, the MMD standard error can be higher than other cage and high-rise systems.
Figure 6. Positional average PM MMDs and MGSDs with standard deviations.
PM mass distribution in our study was similar as the findings of Wang-Li et al. (Citation2013), who reported the MMD and MGSD of the particles from high-rise layer houses were 19.21 ± 1.27 μm and 2.60 ± 0.09 expressed in aerodynamic equivalent diameter (AED), respectively. While compared to some other measurements in laying hen houses (Yang et al. Citation2015), the MMD and MGSD in this study were higher. One reason is that the high ventilation rate may facilitate the suspension and resuspension of coarse particles, thereby resulting in the larger MMD. Housing system is another key factor that greatly impacts the MMD and the proportion of large particles contributes greatly. In the study of Yang et al. (Citation2015), the four investigated laying hen houses were all conventional cage systems with manual-belt. Large particles were easily aroused by birds’ activities in aviary system, leading to a larger MMD in this study.
Mass concentration of particles with different sizes collected by Anderson eight-stage samplers was illustrated in . Particles with diameter larger than 9 μm accounted for 40–50% of the total, and the sizes in the range of 5.8 to 9 μm were about 20%. As the ventilation rate decreased from October to December, more accumulation of particles was detected inside the house (). The production cycle of the house came to the end in January and the number of laying hens decreased from January 7, and then the mass concentration of PM reduced correspondingly, as illustrated in .
Figure 7. Distribution of different sized PM in mass measured by Anderson 8-stage non-viable sampler from October to December. To = Temperature outside the laying hen house; Ti = Temperature inside the laying hen house.
Particle size distribution in count
Count cumulative percentage at both sides of the house reached the highest at the 2.269 μm diameter of the particles. Some small particles with the diameter under 1 μm were detected, among which the frequency of particle at the outlet was higher compared with the inlet side, revealing the accumulation of the small particles at the rear of the house. During the measurement, the PM count distribution did not illustrate a seasonal variation, as presented in and . It might be attributed to the fact that the field measurement was carried out at the late stage of a production cycle, during which the particle source was kept relatively stable.
Figure 8. Count distribution at the inlet end of laying hen house.
Figure 9. Count distribution at the outlet end of laying hen house.
The PM count had a median diameter ranged from 1.76 to 2.16 μm, and a CGSD from 1.37 to 1.60. The average CMDs and CGSDs at the inlet end were 1.94 ± 0.13 μm and 1.46 ± 0.08, respectively, and they were 1.94 ± 0.17 μm and 1.50 ± 0.09 at the outlet end (). No statistical significance on CMDs and CGSDs (P > 0.05) was found at different positions. The detected CMDs and CGSDs in this study were higher than that of most laying hen houses (Lai et al. Citation2012). Similarly, it can be explained by the same reason of the MMD and MGSD distribution in Section 3.4. In welfare-oriented systems, more large particles might be generated because of more birds’ activities, which resulted in a larger proportion of the suspended particles. Thus, the median diameter in count would increase, as the findings of Zheng et al. (Citation2013), who investigated the PM properties in an aviary chamber, and reported the CMD and CGSD were 2.11 μm and 2.34, respectively. Even in the conventional cage system, large particles could also dominate the PSD if stocking density is higher (Almuhanna Citation2013).
Figure 10. Positional average PM CMDs and CGSDs with standard deviations.
Proportion of sampled particle in different sizes
The volume distribution outputted by LA-960 in and can be treated as mass distribution by assuming a constant density of the particles in different sizes. Then the PM concentration ratios can be calculated by the cumulative distribution, and the mass and count distribution were totally different. PM proportion outputted by LA-960 illustrated that PM1 (namely, a particle smaller than 1 μm) at the front of the house accounted for 0.18% of the total particle weight, which was smaller than 0.22% at the rear. PM2.5 took 12.15% and 10.26% of the total PM at the inlet and outlet end of laying hen house, while the percentages of PM10 were 40.42% and 42.94%, respectively. The proportion of PM2.5 and PM10 was lower if calculated using the data obtained from sensors. This discrepancy might result from the measurement limitation of Anderson eight-stage sampler, which could not capture all the particles larger than 9 μm.
Figure 11. Mass cumulative distribution at the inlet end of laying hen house.
Figure 12. Mass cumulative distribution at the outlet end of laying hen house.
The thoracic particle (<10 μm) is the most harmful portion that can be deposited in the lung airways and gas exchange regions of a human respiratory system. It can also be stuck in chicken’s anterior tracheas, lungs, and air sacs. The PM2.5/PM10 ratio reported by Shen et al. (Citation2018) ranged from ~50% to ~80%, higher than the largest proportion of 49.5% in this study. Considering the similar PM2.5 level in these two literatures, the concentration of coarse fraction particulate matter (PM2.5–10) was greater in the aviary system and accounted for bigger proportion. This phenomenon could also be attributed to animal activities and the suspension of large particles caused by high ventilation rate.
In count distribution, PM1 accounted for 7.14% and 11.31% of the sampled PM at the inlet and outlet end of house, while PM2.5 were 78.55% and 77.33%, and PM10 at both ends reached 100% ( and ). It means that although there was little amount of weight of PM2.5 and PM10 in the air of the poultry house, the number of these small particles was more considerable. Inhaling excessive small PM can negatively affect the health of human beings and chicken. Nevertheless, only approximately 7–10% of PM sampled at both side of the house was PM1, which is much lower than that of other research (Zheng et al. Citation2013). In their study, there are plenty of fine particles, which are generated by the birds’ scratching and dust-bathing on the littered floor. Hence, impacts of litter provision on birds’ welfare needs to be reevaluated in further research.
Figure 13. Count cumulative distribution at the inlet end of laying hen house.
Figure 14. Count cumulative distribution at the outlet end of laying hen house.
Conclusion
Based on a hierarchical cluster analysis, the indoor PM2.5 concentration of the surveyed layer house was significantly affected by ambient air quality when AQI was larger than 100, at which the data were excluded when characterizing the PM properties. PM2.5 and PM10 concentrations of the laying hen house with the LCAU system were generally comparable to those of the conventional cage system due to the system design, larger space volume per hen, and relatively higher ventilation rate. While its TSP concentration was higher, and particle size was larger than most of the cage system. More layers’ activities and higher ventilation rate in the system resulted in larger particles, leading to a difference of PM distributions. Particles smaller than 1 μm were easier accumulated at the rear of house because of manure removal. A relatively good indoor environment of the aviary system can be achieved through a reasonable design of the production system and appropriate ventilation control strategy.
Supplemental Material
Download MS Word (27.2 KB)Disclosure statement
No potential conflict of interest was reported by the authors.
Supplementary material
Supplementary material data for this article can be accessed here.
Additional information
Funding
Notes on contributors
Zongyang Li
Zongyang Li is a Ph.D. Student at the Department of Agricultural Structure and Bioenvironmental Engineering, China Agricultural University, Beijing, China.
Chaoyuan Wang
Chaoyuan Wang, Baoming Li, Zhengxiang Shi, Weichao Zheng, and Guanghui Teng are professors in the Department of Agricultural Structure and Bioenvironmental Engineering, College of Water Resources and Civil Engineering, China Agricultural University, Beijing, China.
Baoming Li
Chaoyuan Wang, Baoming Li, Zhengxiang Shi, Weichao Zheng, and Guanghui Teng are professors in the Department of Agricultural Structure and Bioenvironmental Engineering, College of Water Resources and Civil Engineering, China Agricultural University, Beijing, China.
Zhengxiang Shi
Chaoyuan Wang, Baoming Li, Zhengxiang Shi, Weichao Zheng, and Guanghui Teng are professors in the Department of Agricultural Structure and Bioenvironmental Engineering, College of Water Resources and Civil Engineering, China Agricultural University, Beijing, China.
Weichao Zheng
Chaoyuan Wang, Baoming Li, Zhengxiang Shi, Weichao Zheng, and Guanghui Teng are professors in the Department of Agricultural Structure and Bioenvironmental Engineering, College of Water Resources and Civil Engineering, China Agricultural University, Beijing, China.
Guanghui Teng
Chaoyuan Wang, Baoming Li, Zhengxiang Shi, Weichao Zheng, and Guanghui Teng are professors in the Department of Agricultural Structure and Bioenvironmental Engineering, College of Water Resources and Civil Engineering, China Agricultural University, Beijing, China.
References
- Almuhanna, E. A. 2013. Concentration, size distribution and electrostatic charge of laying hen house particulate matter. Environ. Pollut. 2 (3):67–80. doi:10.5539/ep.v2n3p67.
- Almuhanna, E. A., R. G. Maghirang, J. P. Murphy, and L. E. Erickson. 2009. Laboratory scale electrostatically assisted wet scrubber for controlling dust in livestock buildings. Appl. Eng. Agric. 25 (5):745–50. doi:10.13031/2013.28853.
- Basinas, I., T. Sigsgaard, H. Kromhout, D. Heederik, I. M. Wouters, and V. Schlunssen. 2015. A comprehensive review of levels and determinants of personal exposure to dust and endotoxin in livestock farming. J. Exposure Sci. Environ. Epidemiol. 25 (2):123–37. doi:10.1038/jes.2013.83.
- Buser, M. D., J. D. Wanjura, D. P. Whitelock, S. C. Capareda, B. W. Shaw, and R. Lacey. 2008. Estimating FRM PM10 sampler performance characteristics using particle size analysis and collocated TSP and PM10 samplers: Cotton gins. Trans. ASABE. 51 (2):695–702. doi:10.13031/2013.24382.
- Cambra-Lopez, M., T. Hermosilla, H. T. L. Lai, A. J. A. Aarnink, and N. W. M. Ogink. 2011a. Particulate matter emitted from poultry and pig houses: Source identification and quantification. Trans. ASABE. 54 (2):629–42. doi:10.13031/2013.36466.
- Cambra-Lopez, M., A. G. Torres, A. J. A. Aarnink, and N. W. M. Ogink. 2011b. Source analysis of fine and coarse particulate matter from livestock houses. Atmos. Environ. 45:694–707. doi:10.1016/j.atmosenv.2010.10.018.
- Chen, C., and B. Zhao. 2011. Review of relationship between indoor and outdoor particles: I/O ratio, infiltration factor and penetration factor. Atmos. Environ. 45 (2):275–88. doi:10.1016/j.atmosenv.2010.09.048.
- Costa, A., and M. Guarino. 2009. Particulate matter concentration and emission factor in three different laying hen housing systems. J. Agric. Eng. 40 (3):15–24. doi:10.4081/jae.2009.79.
- Council of the European Union. 1999. Council directive 1999/74/EC. Laying down minimum standards for the protection of laying hens. Accessed July, 2019. https://eur-lex.europa.eu/eli/dir/1999/74/oj.
- Guarino, M., A. Caroli, and P. Navarotto. 1999. Dust concentration and mortality distribution in an enclosed laying house. Trans. ASAE. 42 (4):1127–33. doi:10.13031/2013.13261.
- Hayes, M., H. Xin, H. Li, T. Shepherd, Y. Zhao, and J. Stinn. 2012. Ammonia, greenhouse gas, and particulate matter concentrations and emissions of aviary layer houses in the Midwestern USA. 2012 IX International Livestock Environment Symposium (ILES IX), St. Joseph, MI, ASABE. doi: 10.13031/2013.41575
- Hayter, R., and E. Besch. 1974. Airborne-particle deposition in the respiratory tract of chickens. Poult. Sci. 53 (4):1507–11. doi:10.3382/ps.0531507.
- He, Y. 2008. Research of dust distribution and influencing environmental factors in three different poultry houses. PhD diss., China Agricultural University, College of Water Resources and Civil Engineering, Beijing, China. in Chinese.
- Heber, A. J., -T.-T. Lim, J.-Q. Ni, P.-C. Tao, A. M. Schmidt, J. A. Koziel, S. J. Hoff, L. D. Jacobson, Y. Zhang, and G. B. Baughman. 2006. Quality-assured measurements of animal building emissions: Particulate matter concentrations. J. Air Waste Manage. Assoc. 56 (12):1642–48. doi:10.1080/10473289.2006.10464569.
- Hinds, W. C. 1999. Aerosol technology: Properties, behavior, and measurement of airborne particles. New York: John Wiley & Sons.
- Hu, D., L. Wang-Li, O. D. Simmons, J. J. Classen, and J. A. Osborne. 2016. Size distributions of bioaerosols in an egg production facility and its vicinity. Environ. Eng. Sci. 33 (4):215–23. doi:10.1089/ees.2015.0220.
- Joo, H. S., P. M. Ndegwa, A. J. Heber, J.-Q. Ni, B. W. Bogan, J. C. Ramirez-Dorronsoro, and E. L. Cortus. 2013. Particulate matter dynamics in naturally ventilated freestall dairy barns. Atmos. Environ. 69:182–90. doi:10.1016/j.atmosenv.2012.12.006.
- Kelly, K. E., J. Whitaker, A. Petty, C. Widmer, A. Dybwad, D. Sleeth, R. Martin, and A. Butterfield. 2017. Ambient and laboratory evaluation of a low-cost particulate matter sensor. Environ. Pollut. 221:491–500. doi:10.1016/j.envpol.2016.12.039.
- Lai, H. T., A. J. A. Aarnink, M. Cambra-López, T. T. Huynh, H. K. Parmentier, and P. W. G. Koerkamp. 2012. Airborne particles in animal houses. 2012 IX International Livestock Environment Symposium (ILES IX), St. Joseph, MI, ASABE. doi:10.13031/2013.41589.
- Le Bouquin, S., A. Huneau-Salaun, D. Huonnic, L. Balaine, S. Martin, and V. Michel. 2013. Aerial dust concentration in cage-housed, floor-housed, and aviary facilities for laying hens. Poult. Sci. 92 (11):2827–33. doi:10.3382/ps.2013-03032.
- Lin, X., R. Zhang, S. Jiang, H. El-Mashad, and H. Xin. 2017. Emissions of ammonia, carbon dioxide and particulate matter from cage-free layer houses in California. Atmos. Environ. 152:246–55. doi:10.1016/j.atmosenv.2016.12.018.
- Lin, X. J., E. L. Cortus, R. Zhang, S. Jiang, and A. J. Heber. 2012. Ammonia, hydrogen sulfide, carbon dioxide and particulate matter emissions from California high-rise layer houses. Atmos. Environ. 46:81–91. doi:10.1016/j.atmosenv.2011.10.021.
- Liu, D., Q. Zhang, J. K. Jiang, and D. R. Chen. 2017. Performance calibration of low-cost and portable particular matter (PM) sensors. J. Aerosol. Sci. 112:1–10. doi:10.1016/j.jaerosci.2017.05.011.
- Meng, X., R. Hamer, Q. Meng, P. Wang, F. Meng, H. Li, J. Feng, D. Xue, and Y. Zhou. 2012. Animal welfare development in China. Science 338 (6111):1150–51. doi:10.1126/science.338.6111.1150.
- Ministry of ecology and environment of the People’s Republic of China. 2012. HJ 633-2012. Technical regulation on ambient air quality index (on trial). Accessed July, 2019. http://kjs.mee.gov.cn/hjbhbz/bzwb/jcffbz/201203/W020120410332725219541.pdf.
- Ni, J.-Q., L. Chai, L. Chen, B. W. Bogan, K. Wang, E. L. Cortus, A. J. Heber, -T.-T. Lim, and C. A. Diehl. 2012. Characteristics of ammonia, hydrogen sulfide, carbon dioxide, and particulate matter concentrations in high-rise and manure-belt layer hen houses. Atmos. Environ. 57:165–74. doi:10.1016/j.atmosenv.2012.04.023.
- Nimmermark, S., V. Lund, G. Gustafsson, and W. Eduard. 2009. Ammonia, dust and bacteria in welfare-oriented systems for laying hens. Ann. Agr. Env. Med. 16 (1):103–13.
- Radon, K., C. Weber, M. Iversen, B. Danuser, S. Pedersen, and D. Nowak. 2001. Exposure assessment and lung function in pig and poultry farmers. Occup. Environ. Med. 58 (6):405–10. doi:10.1136/oem.58.6.405.
- Shen, D., S. Wu, P. Y. Dai, Y. S. Li, and C. M. Li. 2018. Distribution of particulate matter and ammonia and physicochemical properties of fine particulate matter in a layer house. Poult. Sci. 97 (12):4137–49. doi:10.3382/ps/pey285.
- Shepherd, T. A., Y. Zhao, H. Li, J. P. Stinn, M. D. Hayes, and H. Xin. 2015. Environmental assessment of three egg production systems—Part II. Ammonia, greenhouse gas, and particulate matter emissions. Poult. Sci. 94 (3):534–43. doi:10.3382/ps/peu075.
- Takai, H., S. Pedersen, J. O. Johnsen, J. H. M. Metz, P. W. G. G. Koerkamp, G. H. Uenk, V. R. Phillips, M. R. Holden, R. W. Sneath, J. L. Short, et al. 1998. Concentrations and emissions of airborne dust in livestock buildings in Northern Europe. J. Agr. Eng. Res. 70 (1):59–77. doi:10.1006/jaer.1997.0280.
- Van Ransbeeck, N., H. Van Langenhove, S. Van Weyenberg, D. Maes, and P. Demeyer. 2012. Typical indoor concentrations and emission rates of particulate matter at building level: A case study to setup a measuring strategy for pig fattening facilities. Biosyst. Eng. 111 (3):280–89. doi:10.1016/j.biosystemseng.2011.12.004.
- Wang-Li, L., Z. Cao, Q. Li, Z. Liu, and D. B. Beasley. 2013. Concentration and particle size distribution of particulate matter inside tunnel-ventilated high-rise layer operation houses. Atmos. Environ. 66:8–16. doi:10.1016/j.atmosenv.2012.03.064.
- Winkel, A., J. Mosquera, P. W. G. G. Koerkamp, N. W. M. Ogink, and A. J. A. Aarnink. 2015. Emissions of particulate matter from animal houses in the Netherlands. Atmos. Environ 111:202–12. doi:10.1016/j.atmosenv.2015.03.047.
- Yang, L., Q. Tong, H. Shi, G. Chen, Z. Shi, W. Zheng, and B. Li. 2018. Adaptability of pullets from cages to a large cage aviary unit system during the initial settling-in period. Int. J. Agric. Biol. Eng. 11 (5):70–76. doi:10.25165/j.ijabe.20181105.3216.
- Yang, X., J. Lee, Y. Zhang, X. Wang, and L. Yang. 2015. Concentration, size, and density of total suspended particulates at the air exhaust of concentrated animal feeding operations. J. Air Waste Manage. Assoc. 65 (8):903–11. doi:10.1080/10962247.2015.1032446.
- Zhang, Y. 2005. Indoor air quality engineering. Boca Raton, FL: CRC Press.
- Zhao, Y., T. A. Shepherd, H. Li, and H. Xin. 2015. Environmental assessment of three egg production systems–Part I: Monitoring system and indoor air quality. Poult. Sci. 94 (3):518–33. doi:10.3382/ps/peu076.
- Zheng, W., Y. Zhao, H. Xin, B. Li, R. S. Gates, Y. Zhang, and M. Soupir. 2013. Concentrations and size distributions of airborne particulate matter and bacteria in an experimental aviary laying-hen chamber. Trans. ASABE. 56 (6):1493–501. doi:10.13031/trans.56.10273.