
 ?Mathematical formulae have been encoded as MathML and are displayed in this HTML version using MathJax in order to improve their display. Uncheck the box to turn MathJax off. This feature requires Javascript. Click on a formula to zoom.
ABSTRACT
Green energy generation from agricultural waste has the potential to minimize dependency on fossil and reduce the resultant environmental impact of this fuel provided anaerobic reactor performance is optimized. Hence, the interactive impact of carbon to nitrogen (C/N) ratio, particle size, and co-digestion of dairy manure (DM) and corn stover (CS) on solid-state anaerobic digester (SSAD) performance was investigated with four treatments (DMCS24S, DMCS24L, DMCS28L, and DMCS32L) in this solid-state study. Novel scanning electron microscope (SEM) image analysis utilized to describe the corn stover using ImageJ indicated that corn stover of particle size 0.18–0.42 mm had lower rough surface texture relative to the 0.42–0.84 mm size. This observation not only influenced the ingestate degradation, the bioconversion rate was negatively affected by 0.18–0.42 mm particle size of corn stover. Notably, increase in C/N ratio led to decrease in total ammonia nitrogen (TAN) and alkalinity concentration (Alk), hence, treatments with the lowest C/N ratio had better reactor performance in terms of suitable process parameters such as Alk, pH, ORP, and TAN. Furthermore, DMCS24L treatment had the highest methane yield (106 mL/g VS) and net methane energy (2.92 MJ/kg). Interestingly, modified Gompertz model gave the best kinetic description of the methane production. This SSAD mesophilic study suggests that corn stover, with particle size of 0.42–0.84 mm, co-digested with dairy manure under a C/N ratio of 24 has the potential to enhance methane yield and optimize reactor performance.
Implications: The utilization of agricultural waste for bioenergy generation through solid-state anaerobic digestion could be enhanced through the interactive impact of substrate particle size, carbon-to-nitrogen (C/N) ratio and co-digestion, which has not been previously studied. These ternary factors significantly improved reactor performance and enhanced methane yield when corn stover of 0.42–0.84 mm particle size was co-digested with dairy manure to achieve a C/N ratio of 24.
Introduction
Anaerobic digestion (AD) has emerged as one of the primary routes to harness green energy from organic matter but tends to use large quantities of water. Recently, this technology has been improved to limit water usage through a biological method known as solid-state anaerobic digestion (SSAD). Other benefits of SSAD compared to liquid-state anaerobic digestion include higher pumpability, reduced energy loss from microbes, smaller reactor volume requirement, reduced handling cost, easier storability, and better methane volumetric productivity (Brown, Shi, and Li Citation2012; Fuchs and Drosg Citation2013; Guendouz et al. Citation2008; Li et al. Citation2015).
Despite the benefits, challenges such as poor microbial cell translocation, elevated retention time, high inoculum volume requirement, and high ammonia concentration in the reactor have limited green energy generation from SSAD (Li et al. Citation2015; Li, Park, and Zhu Citation2011; Tao et al. Citation2017). Some of these challenges involved with SSAD have been mitigated through nutrient adjustment, solid content alteration, substrate to inoculum ratio variation, leachate recirculation, and co-digestion (Feng et al. Citation2018; Li et al. Citation2018; Pezzolla et al. Citation2017; Xu and Li Citation2012; Zhang, Zhang, and Li Citation2018). Additionally, SSAD methane production rate kinetics has only been developed to describe methane yield and not for the prediction (Feng et al. Citation2018). Therefore, a research study looking at the methane yield kinetics prediction on SSCoD of the feedstock with dairy manure using an experimental reactor was conducted.
Furthermore, there are no mesophilic SSAD studies that have considered the interactive effect of particle size, C/N ratio, and substrate-inoculum ratio in co-digestion of substrates on reactor performance. These ternary factors (particle size, C/N ratio, and substrate-inoculum ratio) individually impact methane yield and overall reactor performance significantly. However, some SSAD studies have considered at most only two of these factors. For instance, a solid-state mono-digestion study, which focused on the impact of particle size and substrate-to-inoculum ratio, indicated that particle size and solid content synergistically influenced methane yield (Motte et al. Citation2013). Precisely in the study, treatment with 15% total solids (TS) and either 0.1 mm or 0.7 mm particle size of wheat straw outperformed treatments with at least 20% TS in terms of methane production, particularly at the growth phase (Motte et al. Citation2013). In another related SSAD study of different C/N ratios from corn stover and chicken manure blend were varied, the results suggested that the highest methane production was obtained with a C/N of 17.4 (Li et al. Citation2013).
As previously stated, none of these SSAD research works studies considered the interactive effect of particle size and C/N ratio on methane yield for even for a binary substrate mix. Therefore, in this proposed SSCoD mesophilic study, the objectives are (1) to understand the synergetic effect of substrate particle size and C/N ratio on reactor performance, as described by methane yield, ash content degradation, and volatile fatty acid (VFA) bioconversion to methane for two low-cost agricultural substrates (corn stover and dairy manure) co-digested in an experimental reactor; (2) to further determine the surface morphology of the corn stover particles, as influenced by the particle sizes using scanning electron micrograph (SEM) and image analysis with ImageJ, correlation on reactor performance; and (3) to develop methane production rate kinetics models for SSCoD (corn stover and dairy manure) in the reactor.
Methodology
Substrates and inoculum
Corn stover was collected from North Dakota State University (NDSU) Experimental plots, in Fargo, ND, USA in November 2017. The dried corn stover was milled, a process often described as milling pretreatment, with a Schuttle Buffalo hammer mill (Model W6H, New York, USA) equipped with a 3 mm mesh sieve. The milled material was graded into two particle size classes (0.18–0.42 mm and 0.42–0.84 mm) with RO-TAP Testing Sieve Shaker (Ohio, USA). The choice of these sizes was based on the range considered optimal for methane yield as reported earlier (Xiao et al. Citation2013). The graded stover was packed in bags and stored in a dry environment under ambient condition until used for analyzes.
Dairy manure was collected from NDSU Dairy Research Farm, Fargo, ND, USA, and inoculum was obtained from a mesophilic digester operated by American Crystal Sugar Company, Moorhead, MN, USA. Both manure and inoculum were utilized on the same day of collection. The composition of these substrates is presented in .
Table 1. Characteristics of corn stover, dairy manure and inoculum used in this study.
Influent mix
The three substrates (corn stover, dairy manure, and inoculum) were blended to achieve a C/N ratio of 24 and total solids (TS) of 16% for the two particle sizes (0.18– 0.42 mm and 0.42– 0.84 mm) by employing the reported procedure (Wang et al. Citation2014; Equation (1)) as:
where R is the C/N ratio of the three feedstocks; M1, M2, M3 are the moisture content (% w.b.) of dairy manure, inoculum, and corn stover, respectively; C1, C2, C3 are the carbon content (% d.b.) of dairy manure, inoculum, and corn stover, respectively; TS1, TS2, TS3 are the total solids (% d.b.) and N1, N2, N3 are the nitrogen content (% d.b.) of dairy manure, inoculum, and corn stover, respectively.
Based on the outcome of this study, subsequent ingestates mix (dairy manure with corn stover) was adjusted to the C/N ratios of 28 and 32. This mix was limited to only 0.42– 0.84 mm grade of corn stover. Hence, the following four treatments (DMCS24S, DMCS24L, DMCS28L, and DMCS32L) mix are presented in .
Table 2. Co-digestion substrate mix proportion based on total solids.
Approximately 1.5 kg of the four treatments (DMCS24S, DMCS24L, DMCS28L, and DMCS32L) were introduced into 6 L PVC digesters with 3.5 L working volume. While the other compartment of these digesters houses the leachate. Oxygen resident in the digesters was dislodged with nitrogen gas to allow for a favorable anaerobic environment. This was performed before submerging the digester in an improvised thermostatically controlled water-bath, preset at 37 ± 1.0 °C.
The gas production from the digester was quantified through a tipping bucket gas collector coupled to the digester. The gas collector has a semi-automated inverted tipping bucket connected through a SMC D-A93 magnetic reed switch sensor to a CR1000 data logger for real-time data collection. Additionally, the digesters were periodically agitated (once in every 7 days) to ensure leachate return and uniformity in microbial and nutrient distribution (Li et al. Citation2016). Gas produced from the control, a digester with only inoculum as substrate, was deducted from gas production from each treatment. This significantly addressed the inoculum effect on biogas quantification, especially at the lag phase of the experiment. Furthermore, biogas or methane yield was calculated by the daily biogas or methane production divided by feeding volatile solids. Also, volumetric methane productivity was evaluated by dividing the volume of methane produced by the working reactor volume (Brown and Li Citation2013). Each treatment of the study was triplicated, and the mean value and standard deviation are reported.
Substrate and treatment analytical method
Total and volatile solids
Influent and digestate from each treatment were analyzed for total solids and volatile solids following the existing method (Motte et al. Citation2014). Precisely, 15 g of each sample was oven-dried at 105°C for 48 hr prior to carbonization under 550°C for 3 hr (Motte et al. Citation2014). This procedure was equally replicated for the substrates (dairy manure, corn stover, and inoculum). Generally, in this study, digesters were dismantled either after 60 days of detention time or when VFA accumulation occurred beyond the threshold level in the reactor.
Ph and redox potential
Furthermore, the pH and redox potential (ORP) of these treatments, as well as the substrates were measured with HANNA HI 4522 dual channel benchtop meter (Michigan, USA) at the beginning and cessation of the experiment. Due to the nature of the corn stover, the pH for the untreated corn stover was determined with the method described (Al-Ghouti et al. Citation2003).
Total carbon, total nitrogen, carbohydrate, and crude protein
Briefly, carbon and nitrogen content of the substrates, ingestates, and digestates were inspected with a combustion analyzer- Elemental Vario Macro Cube – CNS analyzer (Germany) following the available protocol (Pella Citation1990). The Kjeldahl method was equally used to ascertain the total nitrogen content (Isaac and Johnson Citation1976). Structural carbohydrate, which includes acid detergent fiber (ADF) and neutral detergent fiber (NDF) was analyzed following the existing method (Goering and Van Soest (Citation1970). However, the acid detergent lignin (ADL) of the structural carbohydrate was measured using the AOAC official method (AOAC, Citation2010). Also analyzed were the total crude protein and ash content, these followed the protocol described by the AOAC official method (AOAC Citation2010) and Chemists and Horwitz (Citation1990), respectively.
Ammonia, alkalinity, and volatile fatty acids
Ammonia–nitrogen of these samples (substrates, ingestate, and digestate) was evaluated following the International Organization of Standardization procedure for water quality determination of ammonium nitrogen by flow analysis, ISO – 11,732:1997 protocol. While the alkalinity of these samples was carried out with the method described by APHA (Citation1992), referred to as the titration method with 0.01N sulfuric acid.
The VFA was the summation of starch-sourced VFA (acetic, propionic, butyric, and valeric acids) and protein-sourced VFA (isobutyric and isovaleric acids). In summary, VFA concentration was measured following the procedure described by Baumgardt (Citation1964).
Biogas composition
Biogas composition (methane-CH4, carbon dioxide-CO2, and hydrogen sulfide-H2S) was analyzed using a 8610C, SRI gas chromatograph (California, USA). For the measurement, the biogas was siphoned from the headspace of each digester through a 20 mL syringe. A 5 mL of this gas was diluted with 500 mL of nitrogen gas in a 0.5 L Tedlar bag prior to introduction into the gas chromatograph (GC) for compositional analysis. Afterward, the Tedlar bag was connected to a hydrogen sulfide analyzer (Jerome 631X, Arizona Instrument LLC, Arizona, USA) for hydrogen sulfide concentration analysis. The same level of dilution described was considered for subsequent computation of the biogas concentration.
SEM images for feedstock particle morphology
The morphological difference between the two corn stover particle sizes (0.18– 0.42 and 0.42– 0.84 mm) was inspected in this study from the images acquired with the SEM. High-resolution micrographs of the corn stover samples at two particle sizes (0.18–0.42 mm and 0.42– 0.84 mm) were captured using a scanning electron microscope (Model: JEOL JSM-6490LV, Massachusetts, USA). The ground samples were filled on a cylindrical specimen holder (12.2 mm Ø × 10 mm height) and placed on the specimen stage. The samples were sputtered with gold particles to enhance electrical conductivity. The preset magnification in the software was set at “X250.” The dimensions of the resulting images were 1280 × 960 pixels with each image was ≈1.2 MB. The differences in surface profile features can be identified by visual examination; however, it is a subjective approach. Therefore, an image analysis method was developed to quantify the surface texture profile as an objective method. The details of the developed image analysis method are presented subsequently.
SEM image analysis for feedstock particle morphology
The image analysis of the SEM images was performed using Fiji (Ver. ImageJ 1.52q, Java 1.8, Rasband (Citation2019); Schindelin et al. (Citation2012)) an open source image analysis software. This software has been used to develop custom specific plugins in various agricultural applications (Igathinathane et al. Citation2009; Sunoj et al. Citation2018b). A concise flowchart () shows the sequence of image processing operations performed in the developed ImageJ plugin. The SEM images were directly used for image analysis plugin development as they were already in grayscale () and did not require any image preprocessing procedure. The surface profile, the observable variation in the surface roughness/texture, of the particles was analyzed by obtaining the gray pixel intensity values across the image horizontal direction within a region of interest (ROI). The variation in the intensity values provides an objective estimate of roughness of the particle. The roughness measurement from SEM images will be used to discriminate between two particle sizes.
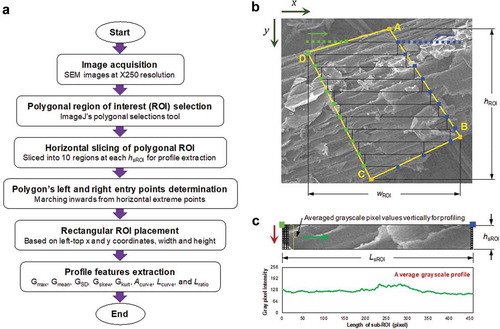
Figure 1. Process flowchart and the SEM image surface profile analysis strategy. (a) Overall flowchart of the developed ImageJ plugin showing sequence of image processing operations for profile classification of the corn stover particle sizes, (b) demonstration of the surface profile analysis on a portion of SEM image showing 10 rectangular sub-ROIs used for profile values extraction, and (c) illustration of grayscale profile generation for one sub-ROI by averaging gray pixels along hsROI vertically and proceeding along LsROI horizontally.
Development of SEM image surface profile plugin
As the object of interest is the surface of the ground particles in the image, it is necessary to avoid the background regions that are made of darker pixels and skewed the profile values in the analysis. Therefore, a polygonal ROI (ABCD; ) representing a specific region of the particle for analysis (based on the particles in the image) was delineated using the “polygonal selection” tool in the ImageJ toolbar (usually by specifying the four or more corners of the polygon). Based on the height of polygonal ROI (hROI) the region was divided into rectangular sub-ROIs (n = 10, fixed in this study) for profiles extraction (). The height of each sub-ROI was evaluated as hsROI = hROI/(n + 1), which accommodated start and end margins. The polygonal ROI was horizontally sliced at each y-coordinate spaced at hsROI starting from A. At each slicing y-coordinate, the left entry points (green) and right entry points (blue) of the polygon were evaluated by marching inward by appropriately incrementing/decrementing x-coordinate from horizontal extreme points (B and D) until the pixel enters the polygon. This was checked by the condition “polygon.contains(x, y) = = TRUE”. Similarly, all the entry points were assessed on the left and right sides of the polygon.
To draw a rectangular ROI inside the polygon () the following four values were necessary: the left-top x- and y-coordinates, length, and height of the rectangle. The left-top x-coordinate was determined by comparing two consecutive left entry points and selecting the one with the maximum x-coordinate value. The left-top y-coordinate of rectangular ROI was the entry point’s y-coordinate, which was already determined. To determine the length of the rectangle, the maximum extent of the rectangle was first determined based on the similar approach of comparing two consecutive right entry points, but the one with the minimum x-coordinate value was selected. The difference between left-top x-coordinate and the right-top x-coordinate provides the length of the rectangular sub-ROI (LsROI). The height of the rectangle was already established as hSROI. These four values were used to generate the rectangular ROI that was overlaid inside the polygon for profile values extraction.
On each sub-ROI, the profile values were extracted by averaging the gray pixel values along hsROI (vertically) and progressing across the LsROI (horizontally) to complete the profile (). This approach of having a rectangular ROI is preferred over a line ROI because it avoids bias on gray values extraction, and it covers most of the portion of the polygonal ROI representing the surface texture.
Profile plot features extraction and analysis
From the profile, the two particle sizes of corn stover showed differences in the profile pattern; however, the procedure needs to be developed to consistently quantify the differences for comparison. Three regions were delineated on each SEM image, which served as replications (). On each replication, 10 profiles were extracted, and their average was calculated for comparing the features.
Figure 2. Sample SEM images of ground corn stover at two particle sizes (0.14–0.42 mm and 0.42–0.84 mm) showing the selected replication regions along with their surface profile from sub-ROIs. The black rectangles in Rep #2 represent the sub-ROIs used for generating the respective profile given below the SEM image.
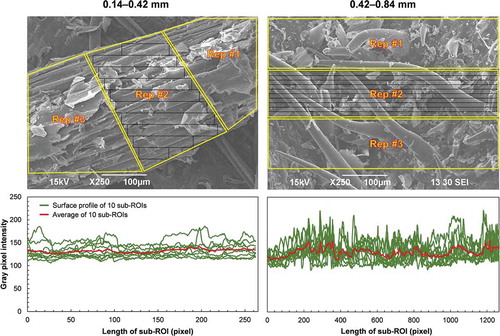
Various profile features were calculated from the grayscale values of the profile to test their suitability to discriminate particles by surface texture. These features included the gray maximum (Gmax), gray mean (Gmean), gray standard deviation (GSD), length of profile curve (Lcurve), and area under the curve (Acurve) of the ROI were evaluated following the methodology of Sunoj, Igathinathane, and Jenicka (Citation2018a). In addition to these features, gray skewness (Gskew), gray kurtosis (Gkurt) were also calculated to test its suitability on finding surface profile. A new dimensionless feature termed as Lratio was developed as the Lcurve will be affected by the size of rectangular ROI (). The extracted features were used to test whether any of these features showed prominent differences between the surface profile of two particle sizes.
The Gmax, Gmean, GSD, Gskew, and Gkurt were obtained using respective Java methods from the DescriptiveStatistics() class, while the mathematical expressions for calculating the Acurve, Lcurve, and Lratio are as follows:
where i is the pixel index along width of the sub-ROI; n is the total number of pixels along the ROI width; x is the x-coordinate of the profile plot; Gi is the grayscale intensity value at ith pixel of the profile; Lratio is a dimensionless length ratio; and LsROI is the length of each rectangular sub-ROI. The best profile feature will provide a clear separation of values between corn stover samples at two particle sizes. This analysis will provide the surface profile of the samples and can be used to obtain insights on methane yield.
Estimated analysis in SSAD
Free ammonia concentration, volumetric methane productivity, holocellulose degradation, substrate biodegradability, and the net energy for the treatments at the cessation of the experiment were calculated using standard estimation methods reported in the literature.
Free ammonia regime
Free ammonia (FA) was computed from the total ammonia-nitrogen (TAN) of the digestate (Zhou, Elbeshbishy, and Nakhla Citation2013) as:
where Kam is the dissociation constant for ammonia at 37°C (1.855 × 10⁻⁵ mol/L), while Kw is the dissociation constant for water at 37°C (2.355 × 10⁻¹⁴ mol/L). Digestate pH was also considered to compute FA (mg/L) in Equation (4).
Degradation
Cellulose (CE) and hemicellulose (HE) degradation, and the total and volatile solids reduction were evaluated using the following relationships (Equations 5–8):
Substrate biodegradability
Substrate biodegradability (Sb) was calculated (Scharer and Moo-Young Citation1979; Equation 9) to compare different treatments substrate digestibility. The treatment with lower Sb at the cessation of any experiment suggests higher substrate digestibility in the reactor and vice versa.
Net methane energy
Total methane energy was computed using the low heating or calorific value for methane as 35.89 kJ/L (Theuretzbacher et al. Citation2015; Equation (10)). Besides, net methane energy was estimated by deducting energy exerted to mill and grade corn stover from total methane energy, since no energy was exerted on the other substrate (dairy manure) prior to co-digestion (Adapa, Tabil, and Schoenau Citation2011; Theuretzbacher et al. Citation2015). Also deducted from the total methane energy to obtain the net methane energy was the energy consumed by the 1000 W bath heater (Tempco, TAT30002, USA) to both initiate and maintain mesophilic condition in the digester.
Briefly, to estimate the energy required to grind the corn stover was measured using a 1800W Kill a Watt® EZ (China) meter was coupled to a Thomas Wiley mill (Philadelphia, USA). This arrangement enabled to obtain data needed for the grinding energy computation under loading and no-loading condition in real-time. This similar procedure was followed to obtain data required to compute the energy exerted to grade corn stover. Hence, the voltage, current, power, frequency, and power factor were digitally obtained at the initial time and at a 2-minute interval. Similar procedures were followed by Adapa, Tabil, and Schoenau (Citation2011) and Miao et al. (Citation2011) for both grinding/milling and grading specific energy computation (Equations 10 and 11). However, energy generated by microbial activity was not included in this computation. All calculations in this section were done on dry basis and for only the successful treatments (in terms of methane yield) in this study.
where ∆P is the power difference (W) between idle and milling condition, t is the operating time (s), and m is the input mass of ground sample (kg).
Kinetic model fitting and validation
Models considered
For only the successful experiments in this study (in terms of methane yield), a few common and specialized reaction kinetic models reported in the literature were studied for their suitability and model performance. The kinetic models considered were the first order, modified first order, cone, modified Gompertz, Fitzhugh, exponential, Page, Peleg and logistics growth models () were employed to fit the measured methane yields. Non-linear curve fitting of models was performed with POLYMATH 6.10 software using mrgmin() method as well as with R using nlsLM() method of non-linear regression. The kinetic models were also used in the prediction of methane yield at the specified time (e.g, 60, 90, and 120 d). In addition, t ≥ 0 for all the models expressed with POLYMATH software.
Table 3. Details of the kinetic models used in this study.
Kinetic models validation
Models that fitted the measured methane yield most were validated with Pearson’s correlation coefficient (r), coefficient of determination (R2), root mean square error (RMSE), normalized root mean square error (NRMSE), and Akaike’s information criterion (AIC) following the standard relationships widely use (Akaike, Citation1998; El-Mashad Citation2013; Lima et al. Citation2018; Motulsky and Christopoulos Citation2004; Equations (12–15)). A combination of high r and R2 value, with low values of RMSE, NRMSE, and AIC indicate superior performance of the model in describing the methane production kinetics.
where Yoi is the measured data point for the methane yield (mL/gVS), Ypi is the predicted data point for the methane yield (mL/gVS), Ymn is the mean of the measured data points for the methane yield (mL/gVS), nm is the number of data points in the measured or experimented data point for the methane yield, Ymax and Ymin are the maximum and minimum experimental value for the methane yield, respectively, RSS is the residual sum of squares, and h is the number of model parameters or variables.
Data analysis
The experimental data in this study were statistically analyzed with a completely randomized design using SAS software (Version 9.4, SAS Institute Inc., Cary, NC, USA). To conduct pairwise comparisons of the treatment means, the Duncan multiple range tests (DMRT) were used with a threshold p-value set at 5%.
Results and discussion
Compositional change among treatments
Aside from the textural properties of corn stover, the treatment (blend of the corn stover, dairy manure, and inoculum) compositional influence on reactor performance was also investigated.
Process parameters regime
In general, pH regime primarily affects reactor performance. It influences alkalinity production by methanogens as well as affects the other anaerobic microbes’ well-being. For instance, in an event that the pH in the reactor is below 6.5, carbonate and bicarbonate require to maintain suitable alkalinity concentration in the reactor are not produced by methanogens from resident dissolved carbon dioxide (McDonald Citation2016). Precisely in this study, such strong nexus existed between pH and alkalinity, especially at the cessation of the experiment.
For instance, alkalinity at the end of the experiment for treatments DMCS24S and DMCS24L significantly increased by at least 50% under a corresponding pH>7.3 (). This obviously suggests an effective reactor performance. On the contrary, at post-digestion pH<5.2, alkalinity for treatment DMCS32L significantly reduced by more than 60% while that of DMCS28L treatment relatively remain unchanged. The two possible explanations for this trend could be the low methanogenic activities as a result of the low ORP in treatments (DMCS28L and DMCS32L; ).
Table 4. Characteristics of pre- and post-digestion samples under different treatments.
It could also probably be linked to the rapid hydrolysis of polymers leading to high VFA production and then subsequent accumulation in these treatments (). ORP less than −250 mV has been recommended for active methanogens activities (Zupančič and Grilc Citation2012), but at the cessation of treatments DMCS28L and DMCS32L experiment, the ORP had significantly increased to an unsuitable range for methanogens. Precisely the ORP had increased from less than −310 mV to more than +110 mV ().
Interestingly, C/N ratio seems to play an important role in the observed results, as the C/N increased from 28 (DMCS28L) to 32 (DMCS32L), alkalinity and ammonia-nitrogen at the end of the experiments decreased significantly, while the VFA increased significantly (). On the contrary, at C/N of 24 (DMCS24S and DMCS24L), irrespective of corn stover particle sizes, most of the process parameters namely, pH, ORP, alkalinity, and ammonia-nitrogen were within suitable range stated for suitable anaerobic digestion process (Li et al. Citation2018; Mao et al. Citation2015; Sun et al. Citation2016; Zupančič and Grilc Citation2012). Hence, reactors with the C/N ratio of 24 might be more suitable for solid-state anaerobic co-digestion of dairy manure and corn stover relative to C/N of 28 or 32. Remarkably, the C/N ratio might be one of the primary AD factors that influenced reactor performance under this study.
Ash content
Also, of interest is the impact of ash content on reactor performance. For instance, the ash content for DMCS24S and DMCS24L increased by 26.5% and 60.0%, respectively, at the end of the experiment (). A trend that clearly indicated that a large fraction of the biodegradable substance might have been utilized for methane production (Steffen et al. Citation2016). This was contrary to the slight increase (<10%) in ash content with treatment DMCS28L and DMCS32L at the cessation of the experiment (). Furthermore, the particle size of corn stover seems to affect ash content production in the treatments with C/N ratio of 24. For instance, with the 0.42 − 0.84 mm corn stover particle size treatment (DMCS24L), biodegradation in terms of ash content production was more pronounced relative to treatment with the particle size of 0.18 − 0.42 mm (DMCS24S). Hence, this trend suggests a better biological activity under a corn stover particle size of 0.42 − 0.84 mm relative to the DMCS24S treatment with 018 − 0.42 mm particle size.
Crude protein and ammonia nitrogen regime
Furthermore, on reactor performance, despite the significantly higher crude protein concentration in treatments with C/N of 24 (DMCS24S and DMCS24L) relative to DMCS28L and DMCS32L treatments at the cessation of the experiment (). Park and Li (Citation2012) opined that ammonia-nitrogen production is a better indicator of protein degradation in substrate than crude protein content. Hence ammonia–nitrogen production was harnessed in the study to investigate protein reduction in all the treatments. Ammonia-nitrogen for the treatments DMCS24S, DMCS24L, DMCS28L, and DMCS32L after the experiment had increased by 2.9, 3.1, 2.9, and 4.1 folds, respectively (). However, this outcome was affected by the initially ammonia-nitrogen concentration and C/N of the treatments, as the C/N ratio increased the initial ammonia concentration decreased (). Notwithstanding, in this study, DMCS32L treatment had the highest protein degradation or reduction in terms of the proportion of ammonia-nitrogen produced.
Furthermore, the ammonia-nitrogen concentration for all the treatments in this study () was lower than the 4100– 6000 mg/L range detrimental to methanogens (Fujishima, Miyahara, and Noike Citation2000; Sun et al. Citation2016). Also, equally important is the free ammonia produced from these rich nitrogenous substrates. Free ammonia could either be beneficial for bacteria growth or antagonistic depending on the concentration (Wang et al. Citation2018). Free ammonia nitrogen concentration for DMCS24S, DMCS24L, DMCS28L, and DMCS32L at the cessation of the experiment were 66.23, 123.22, 0.18 and 0.10 mg/L, respectively. These concentrations were below 337– 800 mg/L stipulated for a negative impact on glycolytic pathway (Duan et al. Citation2012; Fujishima, Miyahara, and Noike Citation2000; Sun et al. Citation2016). Hence, neither free ammonia nitrogen nor total ammonia-nitrogen concentration posed any inhibitory limitations to the systems under this study.
VFA bioconversion and composition
The VFA played a major role in biogas production; however, the imbalance among all the four microbial groups (hydrolytic bacteria, acidogens, acetogens, and methanogens) in the digester will adversely affect bioconversion of VFA into methane. In this study, the DMCS24L treatment seems to have the best VFA bioconversion rate (from 7.92– 4.46 g/L), followed by the DMCS24S (). However, for the other two treatments (DMCS28L and DMCS32L), VFA bioconversion was low and as such VFA accumulation occurred. This trend might be as a result of rapid VFA production under C/N ratio of 28 and 32 during the experiment, which was not commensurate with acetogens and methanogen bioconversion of the acids.
Interestingly, the lower bioconversion rate in DMCS24S relative to DMCS24L could be linked to the lower corn stover particle size which allows for easy microbial access to the feedstock and hence rapid hydrolysis process than with treatment DMCS24L. Hence, corn stover particle size influenced microbial degradation in this study and similar trends were also observed by Xiao et al. (Citation2013). Similarly, high VFA production in treatment DMCS24S relative to DMCS24L could be as a result of the fine particle size of corn stover (0.18– 0.42mm) which increased the tendency for media acidification due to quick fermentation of the soluble fractions (Motte et al. Citation2014).
Also, of importance is the bioconversion of the starch-sourced (Ss) VFA (acetic, butyric, propionic, and valeric acids) and the protein-sourced (Ps) VFA (isobutyric and isovaleric acids). Interestingly, treatments DMCS28L and DMCS32L had the worst bioconversion of SsVFA at the cessation of the experiment (). Hence, this trend might imply an imbalance in the microbial community, attributed to rapid VFA production and accumulation in the early stage of the digestion process which upset the reactor completely. Additionally, the pH dropped in these reactors (<5.2) further buttressed poor digester performance ().
Figure 3. VFA concentration of the treatments at the pre- and post-digestion stage (error bar = 1 std. dev).
Aside from the process parameters that were previously mentioned in this section, some studies have led credence to VFA/alkalinity, VFA/ammonia, and propionic/acetic ratio as good indicators for reactor performance. Interestingly in this SSAD study, VFA/Alkalinity and VFA/Ammonia for only treatment DMCS24L was within range of 0.05 − 1.22 and 0.25 − 1.17 respectively () stated for a successful digestion process void of inhibition or reactor upset (Brown and Li Citation2013; Li et al. Citation2013).
Table 5. Process parameter for each treatment used in this study.
On the contrary, DMCS24S, DMCS28L, and DMCS32L were outside this range (). Hence, this result could establish that the biological activities of methanogens were impeded in reactors DMCS24S, DMCS28L, and DMCS32L as a result of VFA accumulation. Nevertheless, the VFA accumulation impact was more pronounced with DMCS28L and DMCS32L relative to DMCS24S (). Interestingly, all the treatments had propionic to acetic ratio lower than 1.4 (), indicative of a suitable acidic ratio for all the treatments (Hill, Cobb, and Bolte Citation1987). However, Ehimen et al. (Citation2011) opined that this ratio was not a suitable predictor for reactor performance. Hence, Gao et al. (Citation2015) suggested a safe propionic to acetic ratio lower than 0.08, which were exceeded by all the treatments in this study at the cessation of the experiment. (). Overall, the high VFA production and acid ratio imbalance challenges in this study could possibly be attributed to the utilization of substrates (dairy manure and corn stover) that are high in cellulose and hemicellulose.
Fiber content degradation
Aside considering process parameter ratio as yardstick to predict reactor performance, fiber content degradation has also been employed for this purpose. In this study, the cellulose and hemicellulose degradation were considered to have a better understanding of reactor performance. As expected, hemicellulose degradation was significantly more pronounced than the cellulose for all the treatments (p < .05; ). This was simply because of its branched structure that allows for better microbial disintegration (Vasco-Correa and Li Citation2015).
Figure 4. Cellulose, hemicellulose, and substrate biodegradability under different treatments (error bar = 1 std. dev).
Precisely in this study, cellulose and hemicellulose degradations were over 0.5 and 40% for treatments DMCS24S and DMCS24L, respectively (). While for treatments DMCS28L and DMCS32L, cellulose and hemicellulose degradations were less than 7 and 18%, respectively (). Hence, treatments DMCS24S and DMCS24L were considered to have efficient reactor performance due to the high (>40%) hemicellulose degradation. Understandably as shown in , cellulose degradation was low for all the treatment’s (<10%), which could be attributed to the sturdy and unbranched nature of cellulose (). An observation also noted by Vasco-Correa and Li (Citation2015) on lignocellulosic biomass. It is also of interest that there was no significant difference (p > .05) as a result of the corn stover particle size among the four treatments based on cellulose degradation. Hence, cellulose degradation was low irrespective of corn stover particle size and C/N ratio.
Further degradation evaluation indicated that there was no significant difference between the substrate degradability in treatments DMCS24S and DMCS24L (p > .05), though the biodegradability was slightly higher in treatment DMCS24S (). However, the low substrate degradability values noted with treatments DMCS28L and DMCS32L relative to treatments DMCS24S and DMCS24L was due to the non-degradation of the cellulose content in these treatments (DMCS28L and DMCS32L) at the cessation of the experiment. (). Hence, substrate biodegradability could only be harnessed to inspect successful digesters and not the failed ones.
Total and volatile solids reduction
Volatile and total solids reduction at the cessation of the experiment () further established the trend observed with the fiber content degradation previously stated in this study (). Succinctly as shown in , volatile solid (VS) reduction was highest with treatment DMCS24L (7.3%) and lowest with DMCS28L (0.6%). Nevertheless, VS reduction was generally low for all the treatments relative to 50% VS reduction suggested for effective reactor performance (Ehimen et al. Citation2011; Hill, Cobb, and Bolte Citation1987). Hence, a form of thermal, chemical or biological pretreatment of the ingestate might be required to improve VS reduction within the 60 days retention time considered in this study.
Figure 5. Total and volatile solids reduction under different treatments (TS, VS; error bar = 1 std. dev).
Furthermore, the low VS reduction in this study equally suggests that milled pretreated corn stover co-digested with dairy manure does not enhance microbial accessibility to cellulose and hemicellulose. Notwithstanding, with an ingestate C/N ratio of 24, the VS reduction was significantly higher (p < .05) than treatments at C/N ratios of 28 and 32 ().
Understandably in this study, increase in moisture content (reduction in total solids, between 13 – 33%) observed for all the treatments at the end of the experiment () could be attributed to the degradation of the water-soluble fraction of the influent (Motte et al. Citation2014).
Biogas concentration and yields
The crux of fiber content and volatile solid degradation in an anaerobic digester is to ensure high methane and biogas yield from an active and mutual nexus between the anaerobic bacteria and archaea. Therefore, the active presence of methanogens in the digester was monitored by the methane concentration. For treatments DMCS24S and DMCS24L, methane concentration was greater than 40% after the third week of the experiment and the peak methane concentration was over 50% (), a pattern that suggests active methanogenic activities. In contrast, methane concentration for treatments DMCS28L and DMCS32L all through the experiment was less than 25% ().
Figure 6. Methane composition over time for different treatments.

Though Syaichurrozi (Citation2018) had attributed high methane concentration to high proteinous substrates, other factors such as C/N ratio and particle size of substrates obviously played a significant role in the outcome of this result. For example, in this study, treatments with C/N ratio of 24 (DMCS24S and DMCS24L) not only had early and active methanogenic activities ascribed to high initial methane concentration, but methane concentration doubled after the third weeks, which is unlike the relatively slight increment observed with the DMCS28L and DMCS32L treatments (). Hence, there seems to be a balance between the bacteria and archaea biological activities in treatments DMCS24Sand DMCS24L, which suggests effective reactor performance in these digesters.
Figure 7. Hydrogen sulfide concentration trends under different treatments.
Aside methane concentration, hydrogen sulfide (H2S) concentration was also measured. High H2S concentration implies active sulfur-reducing bacteria activities, being the by-product of the bacteria (Kushkevych et al. Citation2017). In general, the bacteria compete with methanogens for nutrient. The observed rise in hydrogen sulfide production between the first and second week of the experiment for treatments DMCS24S and DMCS24L () explains why the corresponding methane concentration in these treatments (DMCS24S and DMCS24L) was low within this period (). As sulfur-reducing bacteria was competing with methanogens for nutrient (hydrogen). However, after the decline in H2S production, particularly after the 5th week (), methane concentration in these treatments (DMCS24S and DMCS24L) had reached about 45% and was relatively stable until the end of the experiment (). Nevertheless, a consistently low methane concentration from treatments DMCS28L and DMCS32L was likely to be attributed to VFA accumulation.
From another point of view, high crude protein content in feedstock has been strongly linked with H2S generation in digesters (Kryvoruchko et al. Citation2009). Hence, in this study, the treatments with high crude content (DMCS24S and DMCS24L) produced high H2S concentration relative to the treatments (DMCS28L and DMCS32L) with lower crude protein concentration (). In summary, the concentration of H2S lower than 4000 ppm, did not significantly impact methanogenic activities in this study. This is in line with the value of <5000 ppm suggested for safe H2S concentration in an AD process (Isa, Grusenmeyer, and Verstraete Citation1986).
Biogas and methane yield and volumetric productivity
Reactor performance could also be evaluated from the gas yield and volumetric productivity. In this study biogas and methane yield for treatments DMCS24S, DMCS24L, DMCS28L, and DMCS32L were 140, 231, 40.1, and 26 mL/g VS and 53, 106, 3.8, and 2.2 mL/g VS, respectively (). This result suggests that treatments DMCS24S and DMCS24L had better reactor performance than treatments DMCS28L and DMCS32L. Hence, the C/N ratio of 24 was more suitable for the blend of dairy manure and corn stover under this solid-state mesophilic study than 28 and 32. In addition, methane yields obtained in this study for treatment DMCS24L (106 mL/gVS) was significant higher (p < .05) than some of the values (41, 60, and 58 mL/gVS) reported in a solid-state mono-digestion study of either corn stover or dairy manure only (Degueurce et al. Citation2016; Feng et al. Citation2018). An indication that a good synergy existed between co-digestion and corn stover particle size that improved the methane yield.
Figure 8. Overall biogas and methane yield for different treatments.
On the impact of particle size, at lower particle size of corn stover (0.18 − 0.42 mm) under a C/N ratio of 24 (DMCS24S), both methane and biogas yield of treatment DMCS24S was significantly lower (p < .05) than treatment with higher corn stover particle size (0.42 − 0.84 mm) under the same C/N ratio (DMCS24L). Hence, particle size of corn stover influenced both methane and biogas yield under this mesophilic solid-state study; a trend that agrees with published research (Xiao et al. Citation2013). Additionally, methane yield for DMCS24L in this study was very close to the value (88– 113 mL/g VS) documented in a mesophilic SSAD study with switchgrass (Sheets, Ge, and Li Citation2015).
Furthermore, the volumetric methane production gives a good understanding of the utilization efficacy of the reactor volume (Xu et al. Citation2016). The volumetric methane production for treatments DMCS24L and DMCS24S, was 6 and 3 L/Lwork, respectively (). However, this result was lower than the values reported in a SSAD study of yard trimming (Xu et al. Citation2016) and switchgrass (Sheets, Ge, and Li Citation2015) but closely related to the range documented in a SSAD study with rice straw (Zhou et al. Citation2017). An indication that the substrate type might influence methane volumetric productivity. Volumetric methane production for treatments DMCS28L and DMCS32L were less than 0.5 L/Lwork, hence was not reported in and were not further analyzed for net methane energy, SEM surface profile image analysis, and reaction kinetics.
Figure 9. Volumetric methane production and total methane energy for treatments with a C/N ratio of 24(error bar = 1 std. dev).
Net methane energy
From an economic standpoint, the amount of energy that could be harnessed from this anaerobic digestion process and utilized is very important. Hence, in this study, net methane yields estimated, after the energy required to process corn stover and heat-up the reactors were deducted, were 1.02 and 2.92 MJ/kg for treatments DMCS24S and DMCS24L respectively (). Notably, the net methane yield for DMCS24L was higher than the net energy value reported by Mustafa et al. (Citation2018) in an anaerobic digestion study of sugar bagasse, though the DMCS24S value was significantly lower. This result indicated that dairy manure co-digested with 0.42– 0.84 mm corn stover particle size under SSAD study can significantly improve net methane yield. Understandably, net methane energy for treatments DMCS28L and DMCS32L was less than 0.2 MJ/kg, as a result of the low methane yield (data not shown in ).
Corn stover SEM micrographs surface profile analysis results
The SEM of milled corn stover at two-particle sizes of 0.18–0.42 mm and 0.42–0.84 mm was obtained at 250X, and these digital images () were used to extract surface texture profile to derive the desired profile features. The various profile features mean and standard deviation (SD) values of 10 sub-ROIs for three replications of two particle sizes (0.14 − 0.42 mm and 0.42 − 0.84 mm) of corn stover revealed the variation of the particle sizes (). Most of the features showed higher mean value for the larger size corn stover particles.
Figure 10. Mean and standard deviation values of the profile features from 10 sub-ROIs of each replication (based on polygonal ROI) from the milled corn stover SEM images discriminating the particle sizes.
Of the features analyzed, except Gmean and Gkurt, all other features showed a prominent separation between two particle sizes. The Gmax produced a good separation between two particle sizes for Rep1 and Rep2, but the mean value was the same for Rep3. This could be due to the region selected as Rep3 in 0.42 − 0.84 mm sample () had a smoother texture compared to the other two replications. Also, this may not be considered as a suitable feature because one thin vertical line of a white pixel will produce a maximum value irrespective of the particle size. Similar effect expected in GSD as the SD represents the spread of gray pixel values, which will get affected even with one vertical line of either black or white pixel.
In the case of Gskew, the mean values of two particle sizes showed a good separation but the SD values had a considerable overlap that made it unsuitable for discrimination. The Acurve and Lcurve, showed a clear separation between two particle sizes. Higher mean values of Acurve and Lcurve denotes the rough surface texture of the larger particle size. Even though these two features showed good discrimination, they are less suitable because they are majorly influenced by the LsROI. For example, the Lcurve for 0.42–0.84 mm was measured with 1250 values, while the other sample was only for 265 values (). Similarly, the Acurve will also have the same effect as Lcurve but at a higher magnitude. Therefore, in such scenarios, the developed feature Lratio, which is normalized and dimensionless, performed better and it is preferred over the other two features (Acurve and Lcurve). The higher values of particles at 0.42 − 0.84 mm represent a rougher surface than the 0.14 − 0.42 mm. Also, it should be noted that the separation of mean values was prominent and there was no overlap in the SD bar. Therefore, Lratio is considered the best to differentiate between two particle sizes of milled corn stover from SEM images.
Even though smaller particles, in general offer more reaction surface area compared to larger particles per unit mass, the higher methane production observed with the larger particles () can be attributed to the increased reaction surface as indicated by the measured increased surface roughness. This insight obtained is a unique output of image analysis and has the potential for various further analysis. The surface roughness indicated by valid discriminating features forms a potential measure that can be correlated to the various properties of the feedstock and the outputs of microbial digestion which can be explored in future research. Thus, the novel methodology of texture profile image analysis of feedstocks will become an alternative tool to study and predict microbial digestion process and outcomes.
Reaction kinetic model and validation
Several studies have employed kinetic models to describe biogas production (Lima et al. Citation2018, Syaichurrozi Citation2018). In this study, methane yields of the treatments as a function of time suitable for reaction kinetics model development are presented (); however, the reaction kinetics for treatments DMCS28L and DMCS32L were not considered because the reactors failed due to VFA accumulation resulting in low pH. It should also be noted that the DMCS24S and DMCS24L methane production were good and increasing, however, these trends have not displayed the stabilization phase of the general growth curve.
Figure 11. Cumulative methane production with different treatments over the time studied.
Results of developed kinetic models of viable treatments (DMCS24S and DMCS24L), with reactor performance, are presented in . High values of r and R2 and low values of RMSE, NRMSE, and AIC indicate high predictability of the model. Another feature that helps in deciding the suitability of the model is the “Shape” of the kinetic model prediction, which can also be observed from the methane prediction beyond the observed times (e.g., 90 d and 120 d; ). Both the simple (first order, modified first order, exponential, Page, and Peleg) and advanced (cone, modified Gompertz, Fitzhugh, and logistics growth) group of models in general produced high r and R2 values >0.9. Therefore, for model selection, AIC, extended prediction, and the shape of the kinetic model trend should be employed.
Table 6. Kinetic model and validation for treatment with C/N ratio of 24.
As AIC is the best parameter to compare the model performance, which penalizes the increased number of parameters in the model, the tested models were ranked using AIC (). Overall, the ranking of the advanced kinetic models was better than the simpler models, hence the best model selection should be from the family of advanced models. The rankings, which have shown some variation between the treatments of the advanced models are:
Performance for DMCS24S treatment (AIC based): FzM > CM > MGM > LgM
Performance for DMCS24L treatment (AIC based): MGM > CM > FzM > LgM
The final set of kinetic model selection in combination with the shape of the extended kinetics trend. This information can also be observed from the predicted 90 and 120 days methane production results. Therefore, irrespective of the AIC ranking a curve shape of sigmoid with correct saturation level (“Sig – right”) will represent a correct methane production kinetics. Most of the advanced models were qualified based on the “shape test”, but none of the simpler models even though they had better AIC sometimes or shape was sigmoid (but low prediction).
It was also found that some of the advanced models were not consistent with the shape across the two treatments (). Further data collection and analysis would correct this discrepancy. Despite the better performance of the advanced group of models, the Modified Gompertz (MGP) was consistently ranked good (4 and 1) while having the logical sigmoid with the correct saturation level. Therefore, based on this study the Modified Gompertz kinetic model was the best and recommended for modeling methane production. Cone and Fitzhugh models can also be recommended as a second choice for methane production kinetics.
Though, the POLYMATH software could not be used to predict methane yield over extended days unlike the R using nlsLM(),It had a better lag phase time and hydrolysis rate constant description. Therefore, with the modified Gompertz model, the lag phase time (λ) required for the anaerobic microbes to adapt to the substrates prior to methane production was lower with the DMCS24S (9.1 days) treatment relative to the DMCS24L (12.3 days). This might be attributed to the easy accessibility of microbes in treatment DMCS24S to corn stover in this treatment, due to the enlarged surface area of the stover as a result of the low particle size (0.18 – 0.42 mm) relative to treatment DMCS24L. Similarly, with the cone model, the hydrolysis rate constant (P) was greater with treatment DMCS24L (0.0262/day) than treatment DMCS24S (0.0144/day), an indication of the better organic matter degradation in treatment DMCS24L than with DMCS24S (Syaichurrozi Citation2018).
Hence, Cone and modified Gompertz models are the most appropriate models under this SSAD study to describe methane production kinetics based on DMCS24L treatment. These two models were recommended by (Syaichurrozi Citation2018) for biogas production kinetics.
Conclusion
Solid-state reactor performance was evaluated under a synergetic blend of particle size, carbon to nitrogen ratio, and co-digestion in a mesophilic study.
Succinctly, we found that the SEM images of the stover, analyzed with ImageJ software prior to mixing with dairy manure, indicated that 0.18 − 0.42 mm particle size had lower rough surface texture relative to the 0.42 − 0.84 mm particle size. A trend that explained the high polymer degradation in treatment DMCS24S relative to DMCS24L, which impacted VFA bioconversion rate. Furthermore, we discovered that free ammonia, total ammonia nitrogen, and hydrogen sulfide concentration less than 124 mg/L, 4801 mg/L, and 4000 ppm respectively did not pose any significant threat to methanogenic activities.
Despite the high acid ratio (propionic/acetic acid > 0.08) in this study linked to high cellulose and hemicellulose content in the substrates, DMCS24S and DMCS24L treatments with a C/N ratio of 24 produced methane yield and net methane energy of 53 and 106 mL/g VS and 1.02 and 2.92 MJ/kg respectively. Furthermore, the yield kinetic was best described by modified Gompertz model. Hence, based on the reactor performance of treatment DMCS24L, dairy manure co-digested with a 0.42– 0.84 mm particle size corn stover under a C/N of 24 in a solid-state mesophilic condition has the potential to generate environmentally friendly energy that could complement fossil fuel.
Acknowledgment
Also, support from NDSU Graduate School and Dean of CAFSNR are acknowledged. Effort from Dr. Borhan Md (Research Specialist) and Dr. Niloy Sarker with some of the experimental set-up is highly appreciated.
Disclosure statement
No potential conflict of interest was reported by the authors.
Additional information
Funding
Notes on contributors
A.A. Ajayi-Banji
A.A. Ajayi-Banji, Graduate Student, Department of Agricultural and Biosystems Engineering, North Dakota State University, NDSU Department 7620, PO Box 6050, Fargo, ND 58108, USA. He can be contacted at [email protected]
S. Rahman
S. Rahman, Associate Professor, Department of Agricultural and Biosystems Engineering, North Dakota State University, NDSU Department 7620, PO Box 6050, Fargo, ND 58108, USA. He can be contacted at [email protected]
S. Sunoj
S. Sunoj, Doctoral Research Assistant, Department of Agricultural and Biosystems Engineering, North Dakota State University, NDSU Department 7620, PO Box 6050, Fargo, ND 58108, USA. He can be contacted at [email protected]
C. Igathinathane
C. Igathinathane, Associate Professor, Department of Agricultural and Biosystems Engineering, North Dakota State University, NDSU Department 7620, PO Box 6050, Fargo, ND 58108, USA. He can be contacted at [email protected]
References
- Adapa, P., L. Tabil, and G. Schoenau. 2011. Grinding performance and physical properties of non-treated and steam exploded barley, canola, oat and wheat straw. Biomass Bioenerg. 35 (1):549–61. doi:10.1016/j.biombioe.2010.10.004.
- Akaike, H. 1998. Information theory and an extension of the maximum likelihood principle Selected papers of hirotugu akaike, 199–213. New York, NY: Springer.
- Al-Ghouti, M. A., M. A. M. Khraisheh, S. J. Allen, and M. N. Ahmad. 2003. The removal of dyes from textile wastewater: A study of the physical characteristics and adsorption mechanisms of diatomaceous earth. J. Environ. Manage 69 (3):229–38. doi:10.1016/j.jenvman.2003.09.005.
- AOAC. 2010. Official methods of analysis. 18th Ed., Revision 3. Rockville, MD: AOAC International 2010.
- APHA. 1992. Standard methods for the examination of water and wastewater (2320B). 18th ed. Washington, DC: American Public Health Association.
- Baumgardt, B. R. 1964. Practical observations on the quantitative analysis of free volatile fatty acids (VFA) in aqueous solutions by gas-liquid chromatography. Madison, WI: Department of Dairy Science, University of Wisconsin.
- Brown, D., J. Shi, and Y. Li. 2012. Comparison of solid-state to liquid anaerobic digestion of lignocellulosic feedstocks for biogas production. Bioresour. Technol. 124:379–86. doi:10.1016/j.biortech.2012.08.051.
- Brown, D., and Y. Li. 2013. Solid state anaerobic co-digestion of yard waste and food waste for biogas production. Bioresour. Technol. 127:275–80. doi:10.1016/j.biortech.2012.09.081.
- Chemists, A. A., and W. Horwitz. 1990. Official methods of analysis, 15th ed., Vol. I, 489. Arlington, VA: AOAC.
- Degueurce, A., N. Tomas, S. Le Roux, J. Martinez, and P. Peu. 2016. Biotic and abiotic roles of leachate recirculation in batch mode solid-state anaerobic digestion of cattle manure. Bioresour. Technol. 200:388–95. doi:10.1016/j.biortech.2015.10.060.
- Duan, N., B. Dong, B. Wu, and X. Dai. 2012. High-solid anaerobic digestion of sewage sludge under mesophilic conditions: Feasibility study. Bioresour. Technol. 104:150–56. doi:10.1016/j.biortech.2011.10.090.
- Ehimen, E. A., Z. F. Sun, C. G. Carrington, E. J. Birch, and J. J. Eaton-Rye. 2011. Anaerobic digestion of microalgae residues resulting from the biodiesel production process. Appl. Energy 88 (10):3454–63. doi:10.1016/j.apenergy.2010.10.020.
- El-Mashad, H. M. 2013. Kinetics of methane production from the codigestion of switchgrass and Spirulina platensis algae. Bioresour. Technol. 132:305–12. doi:10.1016/j.biortech.2012.12.183.
- Feng, J., Y. Li, E. Zhang, J. Zhang, W. Wang, Y. He, and C. Chen. 2018. Solid-state co-digestion of NaOH-pretreated corn straw and chicken manure under mesophilic condition. Waste Biomass Valoriz. 9 (6):1027–35. doi:10.1007/s12649-017-9834-z.
- Fuchs, W., and B. Drosg. 2013. Assessment of the state of the art of technologies for the processing of digestate residue from anaerobic digesters. Water Sci. Technol. 67:1984–93. doi:10.2166/wst.2013.075.
- Fujishima, S., T. Miyahara, and T. Noike. 2000. Effect of moisture content on anaerobic digestion of dewatered sludge: Ammonia inhibition to carbohydrate removal and methane production. Water Sci. Technol. 41 (3):119–27. doi:10.2166/wst.2000.0063.
- Gao, S., M. Zhao, Y. Chen, M. Yu, and W. Ruan. 2015. Tolerance response to in situ ammonia stress in a pilot-scale anaerobic digestion reactor for alleviating ammonia inhibition. Bioresour. Technol. 198:372–79. doi:10.1016/j.biortech.2015.09.044.
- Goering, H. K., and P. J. Van Soest. 1970. Forage fiber analyses. In Agr. Handbook No. 379. Washington, DC: ARS, USDA.
- Guendouz, J., P. Buffiere, J. Cacho, M. Carrere, and J. P. Delgenes. 2008. High-solids anaerobic digestion: Comparison of three pilot scales. Water Sci. Technol. 58 (9):1757–63. doi:10.2166/wst.2008.521.
- Hill, D. T., S. A. Cobb, and J. P. Bolte. 1987. Using volatile fatty acid relationships to predict anaerobic digester failure. Trans. ASAE. 30 (2):496–0501. doi:10.13031/2013.31977.
- Igathinathane, C., L. O. Pordesimo, E. P. Columbus, W. D. Batchelor, and S. Sokhansanj. 2009. Sieveless particle size distribution analysis of particulate materials through computer vision. Comput. Electron. Agric. 66 (2):147–58. doi:10.1016/j.compag.2009.01.005.
- Isa, Z., S. Grusenmeyer, and W. Verstraete. 1986. Sulfate reduction relative to methane production in high-rate anaerobic digestion: Microbiological aspects. Appl. Environ. Microbiol. 51 (3):580–87. doi:10.1128/AEM.51.3.580-587.1986.
- Isaac, R. A., and W. C. Johnson. 1976. Determination of total nitrogen in plant tissue, using a block digestor. J. Assoc. Off. Anal. Chem. 59:98–100.
- Kryvoruchko, V., A. Machmüller, V. Bodiroza, B. Amon, and T. Amon. 2009. Anaerobic digestion of by-products of sugar beet and starch potato processing. Biomass Bioenerg. 33 (4):620–27. doi:10.1016/j.biombioe.2008.10.003.
- Kushkevych, I., M. Vítězová, T. Vítěz, and M. Bartoš. 2017. Production of biogas: Relationship between methanogenic and sulfate-reducing microorganisms. Open Life Sci. 12 (1):82–91. doi:10.1515/biol-2017-0009.
- Li, Y., F. Xu, Y. Li, J. Lu, S. Li, A. Shah, and G. Li. 2018. Reactor performance and energy analysis of solid-state anaerobic co-digestion of dairy manure with corn stover and tomato residues. Waste Manage. 73:130–39. doi:10.1016/j.wasman.2017.11.041.
- Li, Y., J. Shi, M. C. Nelson, P. Chen, J. Graf, Y. Li, and Z. Yu. 2016. Impact of different ratios of feedstock to liquid anaerobic digestion effluent on the performance and microbiome of solid-state anaerobic digesters digesting corn stover. Bioresour. Technol. 200:744–52. doi:10.1016/j.biortech.2015.10.078.
- Li, Y., R. Zhang, C. Chen, G. Liu, Y. He, and X. Liu. 2013. Biogas production from co-digestion of corn stover and chicken manure under anaerobic wet, hemi-solid, and solid-state conditions. Bioresour. Technol. 149:406–12. doi:10.1016/j.biortech.2013.09.091.
- Li, Y., S. Y. Park, and J. Zhu. 2011. Solid-state anaerobic digestion for methane production from organic waste. Renew. Sustain. Energy Rev. 15 (1):821–26. doi:10.1016/j.rser.2010.07.042.
- Li, Y. F., M. C. Nelson, P. H. Chen, J. Graf, Y. Li, and Z. Yu. 2015. Comparison of the microbial communities in solid-state anaerobic digestion (SS-AD) reactors operated at mesophilic and thermophilic temperatures. Appl. Microbiol. Biotechnol. 99 (2):969–80. doi:10.1007/s00253-014-6036-5.
- Lima, D. R. S., O. F. H. Adarme, B. E. L. Baêta, L. V. A. Gurgel, and S. F. de Aquino. 2018. Influence of different thermal pretreatments and inoculum selection on the biomethanation of sugarcane bagasse by solid-state anaerobic digestion: A kinetic analysis. Ind. Crops Prod. 111:684–93. doi:10.1016/j.indcrop.2017.11.048.
- Mao, C., Y. Feng, X. Wang, and G. Ren. 2015. Review on research achievements of biogas from anaerobic digestion. Renew. Sustain. Energy Rev. 45:540–55. doi:10.1016/j.rser.2015.02.032.
- McDonald, J. 2016. Alkalinity and pH relationship. Chemistry 393–94. Accessed August 6, 2019. http://www.veoliawatertech.com/crownsolutions/ressources/documents/2/21951,Water-pp393-394.pdf.
- Miao, Z., T. E. Grift, A. C. Hansen, and K. C. Ting. 2011. Energy requirement for comminution of biomass in relation to particle physical properties. Ind. Crops Prod. 33 (2):504–13. doi:10.1016/j.indcrop.2010.12.016.
- Motte, J. C., R. Escudié, J. Hamelin, J. P. Steyer, N. Bernet, J. P. Delgenes, and C. Dumas. 2014. Substrate milling pretreatment as a key parameter for solid-state anaerobic digestion optimization. Bioresour. Technol. 173:185–92. doi:10.1016/j.biortech.2014.09.015.
- Motte, J. C., R. Escudié, N. Bernet, J. P. Delgenes, J. P. Steyer, and C. Dumas. 2013. Dynamic effect of total solid content, low substrate/inoculum ratio and particle size on solid-state anaerobic digestion. Bioresour. Technol. 144:141–48. doi:10.1016/j.biortech.2013.06.057.
- Motulsky, H., and A. Christopoulos. 2004. Fitting models to biological data using linear and nonlinear regression: A practical guide to curve fitting. Oxford, UK: Oxford University Press.
- Mustafa, A. M., H. Li, A. A. Radwan, K. Sheng, and X. Chen. 2018. Effect of hydrothermal and Ca(OH)2 pretreatments on anaerobic digestion of sugarcane bagasse for biogas production. Bioresour. Technol. 259:54–60. doi:10.1016/j.biortech.2018.03.028.
- Park, S., and Y. Li. 2012. Evaluation of methane production and macronutrient degradation in the anaerobic co-digestion of algae biomass residue and lipid waste. Bioresour. Technol. 111:42–48. doi:10.1016/j.biortech.2012.01.160.
- Pella, E. 1990. Elemental organic-analysis. 1. Historical Developments. Am. Lab. 22 (3):116.
- Pezzolla, D., F. Di Maria, C. Zadra, L. Massaccesi, A. Sordi, and G. Gigliotti. 2017. Optimization of solid-state anaerobic digestion through the percolate recirculation. Biomass Bioenerg. 96:112–18. doi:10.1016/j.biombioe.2016.11.012.
- Rasband, W. 2019. ImageJ. Bethesda, MD: US National Institutes of Health. Accessed August 2, 2019. https://imagej.nih.gov/ij/.
- Scharer, J. M., and M. Moo-Young. 1979. Methane generation by anaerobic digestion of cellulose-containing wastes. In Advances in biochemical engineering, vol. 11, edited by T. K. Ghose, A. Fiechter, and N. Blakebrough, 85–101. Berlin, Heidelberg: Springer.
- Schindelin, J., I. Arganda-Carreras, E. Frise, V. Kaynig, M. Longair, T. Pietzsch, S. Preibisch, C. Rueden, S. Saalfeld, B. Schmid, et al. 2012. Fiji: An open-source platform for biological image analysis. Nat. Methods 9:676–82. doi:10.1038/nmeth.2019.
- Sheets, J. P., X. Ge, and Y. Li. 2015. Effect of limited air exposure and comparative performance between thermophilic and mesophilic solid-state anaerobic digestion of switchgrass. Bioresour. Technol. 180:296–303. doi:10.1016/j.biortech.2015.01.011.
- Steffen, F., A. Requejo, C. Ewald, R. Janzon, and B. Saake. 2016. Anaerobic digestion of fines from recovered paper processing–Influence of fiber source, lignin and ash content on biogas potential. Bioresour. Technol. 200:506–13. doi:10.1016/j.biortech.2015.10.014.
- Sun, C., W. Cao, C. J. Banks, S. Heaven, and R. Liu. 2016. Biogas production from undiluted chicken manure and maize silage: A study of ammonia inhibition in high solids anaerobic digestion. Bioresour. Technol. 218:1215–23. doi:10.1016/j.biortech.2016.07.082.
- Sunoj, S., C. Igathinathane, and S. Jenicka. 2018a. Cashews whole and splits classification using a novel machine vision approach. Postharvest Biol. Technol. 138:19–30. doi:10.1016/j.postharvbio.2017.12.006.
- Sunoj, S., S. N. Subhashree, S. Dharani, C. Igathinathane, J. G. Franco, R. E. Mallinger, and D. Archer. 2018b. Sunflower floral dimension measurements using digital image processing. Comput. Electron. Agric. 151:403–15. doi:10.1016/j.compag.2018.06.026.
- Syaichurrozi, I. 2018. Biogas production from co-digestion Salvinia molesta and rice straw and kinetics. Renew. Energy 115:76–86. doi:10.1016/j.renene.2017.08.023.
- Tao, B., J. Donnelly, I. Oliveira, R. Anthony, V. Wilson, and S. R. Esteves. 2017. Enhancement of microbial density and methane production in advanced anaerobic digestion of secondary sewage sludge by continuous removal of ammonia. Bioresour. Technol. 232:380–88. doi:10.1016/j.biortech.2017.02.066.
- Theuretzbacher, F., J. Blomqvist, J. Lizasoain, L. Klietz, A. Potthast, S. J. Horn, and A. Bauer. 2015. The effect of a combined biological and thermo-mechanical pretreatment of wheat straw on energy yields in coupled ethanol and methane generation. Bioresour. Technol. 194:7–13. doi:10.1016/j.biortech.2015.06.093.
- Vasco-Correa, J., and Y. Li. 2015. Solid-state anaerobic digestion of fungal pretreated Miscanthus sinensis harvested in two different seasons. Bioresour. Technol. 185:211–17. doi:10.1016/j.biortech.2015.02.099.
- Wang, X., X. Lu, F. Li, and G. Yang. 2014. Effects of temperature and carbon–nitrogen (C–N) ratio on the performance of anaerobic co-digestion of dairy manure, chicken manure and rice straw focusing on ammonia inhibition. PLoS One 9 (5):1–7.
- Wang, Y., G. Li, M. Chi, Y. Sun, J. Zhang, S. Jiang, and Z. Cui. 2018. Effects of co-digestion of cucumber residues to corn stover and pig manure ratio on methane production in solid state anaerobic digestion. Bioresour. Technol. 250:328–36. doi:10.1016/j.biortech.2017.11.055.
- Xiao, X., R. Zhang, Y. He, Y. Li, L. Feng, C. Chen, and G. Liu. 2013. Influence of particle size and alkaline pretreatment on the anaerobic digestion of corn stover. BioResources 8 (4):5850–60. doi:10.15376/biores.8.4.5850-5860.
- Xu, F., F. Wang, L. Lin, and Y. Li. 2016. Comparison of digestate from solid anaerobic digesters and dewatered effluent from liquid anaerobic digesters as inocula for solid state anaerobic digestion of yard trimmings. Bioresour. Technol. 200:753–60. doi:10.1016/j.biortech.2015.10.103.
- Xu, F., and Y. Li. 2012. Solid-state co-digestion of expired dog food and corn stover for methane production. Bioresour. Technol. 118:219–26. doi:10.1016/j.biortech.2012.04.102.
- Yuan, H., Y. Lan, J. Zhu, A. C. Wachemo, X. Li, and L. Yu. 2019. Effect on anaerobic digestion performance of corn stover by freezing–thawing with ammonia pretreatment. Chin. J. Chem. Eng. 27 (1):200–07. doi:10.1016/j.cjche.2018.04.021.
- Zhang, G., Z. Zhang, and C. Li. 2018. Improvement of solid-state anaerobic digestion of yard waste by co-digestion and pH adjustment. Waste Biomass Valoriz. 9 (2):211–21. doi:10.1007/s12649-016-9798-4.
- Zhou, P., E. Elbeshbishy, and G. Nakhla. 2013. Optimization of biological hydrogen production for anaerobic co-digestion of food waste and wastewater biosolids. Bioresour. Technol. 130:710–18. doi:10.1016/j.biortech.2012.12.069.
- Zhou, Y., C. Li, I. A. Nges, and J. Liu. 2017. The effects of pre-aeration and inoculation on solid-state anaerobic digestion of rice straw. Bioresour. Technol. 224:78–86. doi:10.1016/j.biortech.2016.11.104.
- Zupančič, G. D., and V. Grilc. 2012. Anaerobic treatment and biogas production from organic waste. Manage. Org. Waste 3:1–28.