
 ?Mathematical formulae have been encoded as MathML and are displayed in this HTML version using MathJax in order to improve their display. Uncheck the box to turn MathJax off. This feature requires Javascript. Click on a formula to zoom.
ABSTRACT
Electrostatic precipitators (ESP) have been considered as the main particulate matter (PM) removal facility in the energy industry. This paper presents a real-time optimization method for a one-chamber industrial ESP in an ultra-low emission power plant with an intelligent optimization system (IOS). The IOS seeks to optimize the energy consumption of ESP subject to the outlet concentration requirement in real-time. A coordination control logic is designed to regulate the optimized operation set points with varying operation conditions. The operation optimized by the IOS is compared with the operations under PID (proportion-integral-derivative) and manual control. The results show that the IOS improves the emission compliance rate from 95% of manual control to 100% and the medium concentration is tuned to be 46.6% closer to the emission target. Furthermore, a good balance between emission and energy consumption is achieved, with 35.50% energy conservation for the same emission upper limit of 30 mg/m3. These results prove that the IOS significantly contributes to the efficient operation and economic PM removal by ESP for the energy industry.
Implications
Electrostatic precipitators (ESP) is one of the main PM removal facilities in coal-fired power plants. An intelligent optimization system (IOS) with prediction, optimization, and control modules is designed and constructed for the ESP in an ultra-low emission power plant. A PM removal model is used to predict the outlet concentration of the ESP. The optimal energy consumption of ESP subject to the outlet concentration requirement problem is solved by the particle swarm optimization. A closed-loop and rapping tolerant method is used to eliminate the fluctuation in time-averaged concentration. The system raised is able to ensure the compliance rate while decreasing the energy consumption of the ESP.
Introduction
In 2017, coal accounts for 27.6% of global energy consumption, over half of which was consumed in China (BP Citation2018). Coal combustion is an important source of particulate matters (PM). According to the Annual Report of China Power released by the China Electricity Council, China’s thermal power industry emitted 260 kt of PM in 2017 (China Electricity Council Citation2018), constituting about 3.3% of the total emission of PM in China (National Bureau of Statistics Citation2019). The Upgrade and Transformation Action Plan for Coal-fired Power Energy Saving and Emission Reduction (National Development and Reform Commission of PRC Citation2014) published in 2014 requested the reduction of both average coal consumption (<300 g/kWh) and PM emission (<5 mg/m3) in coal-fired power plants in China. Technologies for the removal of pollutants, especially PM, are highly demanded in coal-fired power plants (Sui et al. Citation2016).
For effectively removing PM, various gas cleaning devices are developed such as cyclones, bag filters, granular-bed filters, scrubbers, and electrostatic precipitators (ESP). ESP, due to its high efficiency, convenience in maintenance, and stable operation, has become one of the main techniques for exhaust gas treatment in PM emitting industries (Jaworek, Krupa, and Czech Citation2007; Yan et al. Citation2016). Developed and utilized over a century, the PM removal mechanism in electrostatic precipitator (ESP) has been studied thoroughly by experimental (Noda and Makino Citation2010) and numerical approaches (Guo, Yu, and Guo Citation2015). The behavior of corona discharge and PM in a wide range of temperature (Cooperman Citation1974), humidity (Yawootti et al. Citation2015), and electrical configuration (Ali et al. Citation2017; Penney and Gelfand Citation1978) have been studied to develop the design and operation strategies for ESP.
To achieve more efficient and economic removal of PM, especially inhalable PM (PM10) and fine PM (PM2.5) (Shi et al. Citation2016), enhancing facilities such as pre-chargers (Tański, Berendt, and Mizeraczyk Citation2019), agglomeration systems (Sobczyk et al. Citation2017), tubular economizers (Qi et al. Citation2017), and water spray systems (Chen et al. Citation2014) have been designed and adopted. New types of power supplies, including switch mode power supply (Fothergill, Devine, and Lefley Citation2001) and pulsed power supply (Klippel Citation2000), have been designed to provide enhanced corona behavior and particle removal. Taking advantage of the advanced PM removal techniques, the overall removal efficiency of PM in coal-fired power plants could reach 99% (Li et al. Citation2019), with the outlet concentration less than 5 mg/m3, achieving ultra-low emission (Yang et al. Citation2018).
Considering the wide range of inlet PM concentration and flue gas flux caused by the change of load and coal, ESPs are commonly designed with a large operation margin to guarantee the PM emission, resulting in high auxiliary power consumption and additional CO2 emission. In order to enhance the economic performance of ESPs, communication, monitoring (Mukherjee, Roy, and Das Citation2014), and control loops (Prasad et al. Citation1999) have been studied, and programmable logic controllers (PLCs), which enables programming and execution of basic operational logics (Liao and Tarng Citation2009), have been widely employed. Grass et al. (Grass Citation2002; Grass, Zintl, and Hoffmann Citation2010) designed a fuzzy-logic-based control system to enhance energy efficiency of ESP, and as the result, energy conservation especially during varying load was achieved. However, the parameters derived from operational experience and field tuning could not ensure the operation running at the optimal operation set points.
The process of particle removal in ESP “could be divided into three main stages: particle charging, transport, and collection” (Kiss and Berta Citation2001), which could be influenced by several variables. Finding the best operation parameters of ESP is a non-linear constrained optimization problem that cannot be solved with linear programming or dynamic programming techniques (Elbeltagi, Hegazy, and Grierson Citation2005). As a common optimization method for solving nonlinear programming problems (Nabaei et al. Citation2016), intelligent optimization algorithms (metaheuristics) have been widely applied in many fields such as agriculture (Hashimoto et al. Citation2001), transportation (Kadiyala, Kaur, and Kumar Citation2013; Perhinschi et al. Citation2011), and manufacturing (Wu and Chang Citation2003), etc. (Loughlin et al. Citation2000; Qin, Huang, and Liu Citation2010; Wu and Wan Citation2018). Meanwhile, some research has been carried out to optimize the operation parameters of ESP with intelligent optimization algorithms. Li et al. (Citation2013) developed an artificial neural network (ANN) combining genetic algorithm (GA) method at a pilot scale platform and achieved energy conservation with different emission targets. Nonetheless, the open-loop structure of the control system did not use real-time emission as feedback and could not eliminate the prediction error introduced by the model mismatch, which inevitably increases during long-term online operation. Moreover, in the existing studies, energy conservation was rarely considered together with emission performance, which is the foremost operation target of ESP. Besides, limited by hardware conditions and software capabilities, existing operation system of ESP does not meet the requirement of modeling and computational demands.
In recent years, scholars are also paying attention to the small-scale ESPs for their potential in medical (Kettleson et al. Citation2013), domestic (Dastoori et al. Citation2013), small-scale boilers (Patiño et al. Citation2016), and aerospace (Afshar-Mohajer et al. Citation2011) applications. Different from large scales ESPs, which are designed with long residence time and commonly consist of a couple of parallel chambers so that the PM emission fluctuation in any chamber could be diluted, small-scale ESP is more sensitive to the operation distortion, especially rapping. This has triggered more comprehensive studies on distortion characteristics and operation methods.
In this article, an intelligent optimization system (IOS) is designed and constructed for the ESP in an ultra-low emission power plant. Modules including prediction, optimization, and coordination are integrated to achieve real-time optimization and coordination of operation set points. The optimal problem on energy consumption of ESP subject to the outlet concentration requirement is built by the energy consumption objective function obtained on the basis of corona discharge characteristic in a wire-plate configuration, and outlet concentration prediction model constructed based on the PM removal mechanism. Affecting factors are analyzed. The operation performance of IOS, including real-time performance, PM emission distribution, and energy consumption, are studied and compared with other control methods in field operations with the same outlet concentration target of 30 mg/m3.
The rest of the paper is organized as follows. Section 2 elaborates the research and development methodology of the proposed IOS. Section 3 presents the results and discussion from the IOS-guided operations. The paper is concluded in Section 4 with future work.
Intelligent optimization system methodology
To optimize the operation of ESP, a four-layer structured IOS, including optimization, coordination, monitoring & communication, and execution has been designed as illustrated in . The prediction, optimization, and control modules, built with Python script, are implemented on the constructed IOS server. An object linking and embedding for process control (OPC) server is built to connect and communicate with the continuous emission monitoring system (CEMS), PLCs, engineer station (ES), operation station (OS), and other online monitoring devices.
Figure 1. The four-layer IOS for ESP.
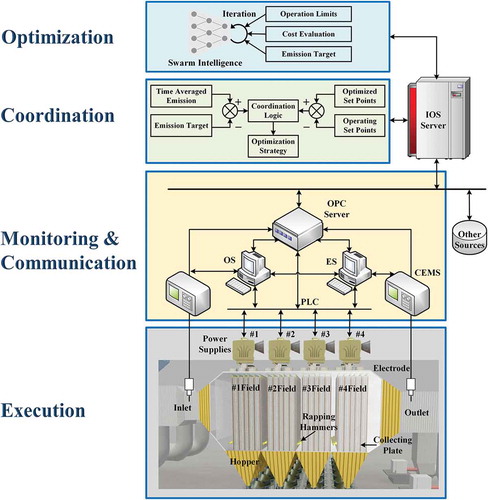
The construction and operation of the IOS involve the procedures presented in . The models are constructed based on the PM removal and its power consumption mechanism. Optimization is carried out based on the constructed models subject to operation limits and emission targets. The set points of operation voltage are regulated based on optimization results and real-time data. Finally, the operation voltages are adjusted by inner controllers of power supplies according to the transmitted set points from OPC server.
Table 1. Procedures of building and operating the IOS for ESP.
PM concentration model of ESP
Industrial ESPs, composed of cascading and parallel discharging fields installed with high voltage power supplies, rapping systems, and heating systems, etc., are commonly designed with wire-duct discharging configuration (Al-Hamouz, El-Hamouz, and Abuzaid Citation2011). The wires, or discharging electrodes, are installed on frames connected with high voltage power supplies that introduce corona discharge between the discharging electrodes and collecting plates. Plasma and high strength electric field in the ESP work collectively to charge particles and drive them along the direction of electric field gradient and finally into the collecting plates.
The removal efficiency of PM is affected by factors including flue gas parameters, particle diameter, particle charge, and electric field strength, etc. By manipulating secondary voltage, the electric field strength and particle charge could be changed, while flue gas parameters, including component, temperature, humidity, and pressure, are not controllable and regarded as disturbance variables (DVs). The outlet concentration of an ESP is equal to the accumulation of outlet fractional concentration as shown in the following equation (Deutsch Citation1922):
where
= outlet concentration, mg/m3;
= fractional inlet concentration with a diameter of
, mg/m3;
= operation voltage at field
, V;
= particle charge decided by particle diameter and secondary voltage, C;
= electric field strength manipulated by secondary voltage, C;
= Cunningham correction factor for different PM diameter;
= number of cascading electrical fields;
= collecting plate area of single field, m2;
= flue gas flux, m3/s.
= flue gas viscosity, mPa·s.
,
and
are derived from testing results, design parameters, and online monitored data, respectively. The methods to derive factors including
,
, and
could be found in the works from Lawless (Citation1996), Cooperman (Citation1981), Mizuno (Citation2000), Lin, Chen, and Tsai (Citation2012), Le, Lin, and Tsai (Citation2013), and Zheng et al. (Citation2016), etc.
We studied an ESP of an ultra-low emission power plant. Its design parameters including rapping settings are listed in . Different from large-scale coal-fired power plants, the boiler has a smaller capacity (220 t/h) and adopts a smaller ESP. The rapping settings including sequence and duration at different discharging fields are tuned and kept constant during operation. The off durations at different fields differ from each other. As the result, their rapping times are different, preventing a large amount of reentrainment caused by simultaneous rapping. Despite the convenience in control and operation, the rapping of collecting plates and discharging electrodes in this one-chamber arrangement shows a strong correlation with changes in outlet concentration. This allows us to better understand the distortion factors of ESP operation.
Table 2. The design parameters and rapping settings of ESP.
Based on EquationEquation (1)(1)
(1) and design parameters introduced above, an outlet concentration model of ESP can be built following the steps in .
Figure 2. The procedure to develop the PM removal model for ESP.
The optimization model for ESP
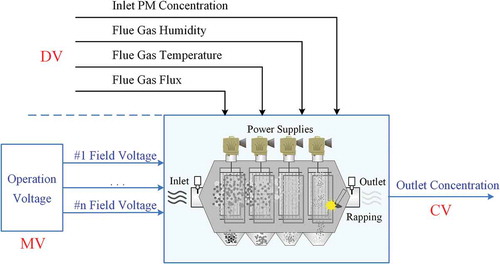
When operating an ESP, the controlled (dependent) variable (CV) is the outlet concentration. Most of the DVs, including flue gas flux, temperature, humidity, and PM concentration, are decided by the combustion procedure that varies during load shift and change of coal component, etc. The main manipulated (independent) variables (MVs) are secondary values of the power supplies. The operation diagram of ESP adopted in this paper is shown in .
Figure 3. Operation diagram of ESP.
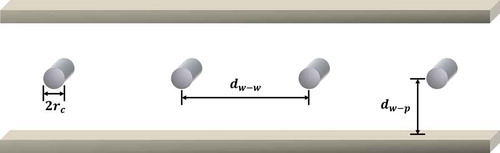
As an electricity consuming facility, the main operation cost of ESP is the energy consumption of power supplies under different operating conditions. The dimensions of a typical ESP are indicated in . According to the corona discharge mechanism in a wire-duct reactor, the secondary current is (Cooperman Citation1981):
Figure 4. Cross-section of a typical duct ESP.
where
= Wire-plate distance, m.
= Wire-wire distance, m.
=
, V2;
= effective electric strength of
, V/m;
= effective cylinder radius of
, m;
= radius of wire, m;
= operating secondary voltage, V;
= the onset voltage, V;
= dielectric constant in vacuum;
= ion mobility, cm2/(V·s);
= total length of wire, m.
The effective cylinder radius can be calculated by the flowing equation (Cooperman Citation1960):
It is worth noting that the percent error of EquationEquation (3)(3)
(3) is less than 1% under the condition of
≤0.6. In this paper,
, and the percent error caused by using EquationEquation (3)
(3)
(3) is about 3.2%.
With the power conversion efficiency as , the power consumption of power supply at field #i is:
where
= operating secondary voltage of field #i, V;
= secondary current of field #i, A.
At the same time, a penalty part is adopted to ensure that the PM emission corresponding to the optimized set points is within the limit:
where
= outlet concentration target;
= partial penalty factor;
= exponential penalty factor;
= rectified linear unit,
.
Considering the range of operation voltage, which is limited by corona onset and sparking voltage, the problem on the optimal energy consumption of ESP subject to the outlet concentration requirement could be constructed as:
Subject to:
where
= secondary voltage at field
;
= corona onset voltage of field
;
= sparking voltage of field
.
According to the PM removal mechanism in ESP, the relationship between operating voltage and removal efficiency is nonlinear. In addition, energy consumption at different discharging fields has a nonlinear positive correlation with operation voltage. Consequently, the operation optimization of ESP is a multi-variable nonlinear programming (NLP) problem. Particle swarm optimization (PSO) algorithm (Kennedy and Eberhart Citation1995), which has shown efficiency in solving multi-variable nonlinear optimization problems, is adopted as the problem solver (Zawbaa et al. Citation2018).
The coordination method for voltage regulation
The electrostatic precipitation procedure of PM has been analyzed through the affecting variables derived from online monitoring and offline measurement. However, the effect of rapping, which is one of the main reasons for PM reentrainment, on outlet concentration could not be theoretically predicted due to the difficulty in analysis and simulation. As the rapping PM reentrainment could be intense, especially caused by rapping at outlet fields, a rapping tolerant control system is important to the stable operation of ESPs.
The standards of PM emission in coal-fired power plants require the time-averaged concentration (hourly to annually in different countries (Zhang Citation2016)) to be strictly under the required value, and the averaging period used for this calculation in China is one natural hour (Ministry of Environmental Protection of PRC Citation2011). In the field operation of ESP, as fluctuation in PM emission is difficult to eliminate, compliance rate is commonly ensured by operating at a high secondary voltage which leads to increased operation cost. In this paper, a closed loop and rapping tolerant method, which coordinates the optimized set points with varying emission feedback and eliminates the fluctuation in time-averaged concentration, is proposed and shown in .
Figure 5. The control diagram of the coordination method for each field #i.
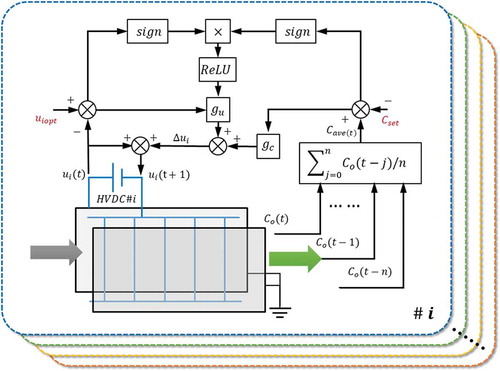
At time step , the value of voltage set point at next step
would be:
where
= operation set point for a time step t in the filed #i;
= voltage gain of optimized value;
= gain of emission deviation;
= gain of optimized voltage;
= sign function,
;
= rectified linear unit,
;
= emission target;
= time-averaged emission at
;
= outlet concentration at
;
= optimized operation voltage of field
;
= number of time steps for averaged outlet concentration.
The coordination of operation voltage consists of two parts: the deviation compensation for the difference between time-averaged emission and emission target, and optimization correction derived from optimized set points and real-time operation voltage. According to EquationEquation (8)(8)
(8) , the optimized set points will generate correction to operating voltage when the change of voltage and outlet concentration are in the same direction. This logic guarantees the PM removal efficiency and enables the operating secondary voltages to change toward optimized set points. The coordination method can achieve a progressive response to the variation of outlet concentration, while the energy consumption is reduced since the operation voltages are around the optimized set points.
Results and discussion
Analysis of affecting factors
Given the fact that rapping behavior introduces more disturbance variables and their effect on outlet concentration is hard to predict, the effect of key factors on the outlet concentration of ESP are analyzed based on online operation data. Affecting weights of different parameters on the outlet concentration has been analyzed by carrying out univariate analysis on 500,000 data sets through a machine learning library package, Scikit-learn (Pedregosa et al. Citation2011). There are several methods for univariate analysis. In this paper, Pearson’s Correlation Coefficient (PCC) is used to describe the relationship between two variables. For a population, the Pearson’s correlation coefficient can be expressed as (Gardner et al. Citation2015):
where
= the covariance between X and Y;
= the standard deviation of X;
= the standard deviation of Y;
= the mean of X;
= the mean of Y.
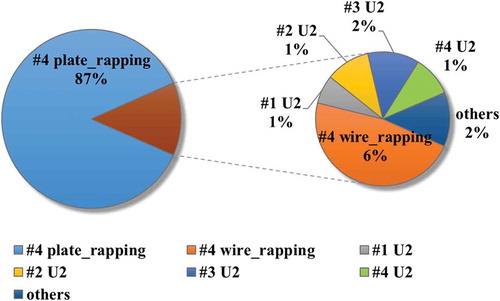
According to the results shown in , the plate and wire rapping at #4 (outlet) field has the highest impact on the change of outlet PM concentration. This is due to the fact that the PM reentrainment caused by rapping at #4 field directly goes out of ESP and cannot be removed or diluted.
Figure 6. The influencing score of different factors on the change of outlet PM concentration.
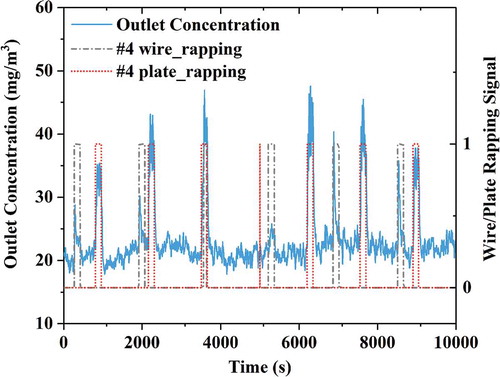
The response of outlet concentration to rapping at #4 field is shown in . The rapping signal synchronizes well with the abrupt change of outlet concentration. Plate rapping at #4 field, which scores the 1st in the factor analysis, introduces the reentrainment with a duration of more than 200 seconds. Wire rapping at #4 field, which scores the 2nd, introduces a distortion of around 50 seconds.
Figure 7. Typical response of outlet concentration to rapping behaviors at #4 field.
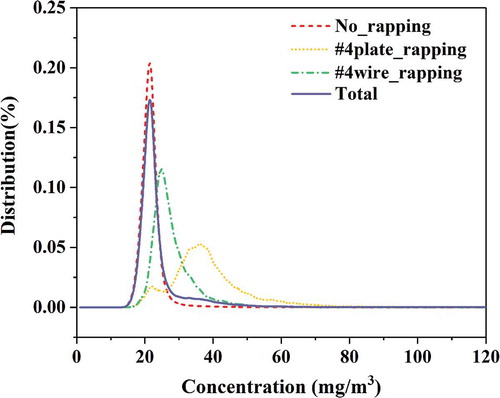
The concentration distribution under different rapping circumstances at #4 field is shown in . The medium concentration of no rapping, plate rapping, and wire rapping were 21.21, 39.33, and 27.67 mg/m3 respectively, resulted in a total medium concentration of 21.83 mg/m3. Although the distribution of overall concentration did not change significantly, the large distortion of outlet concentration during rapping at #4 field can cause surge in feedback signal and lead to abrupt change in the operating parameters. In the next part, IOS will be applied to eliminate operation distortion and its performance is analyzed and compared with the results from the manual and PID control.
Figure 8. Outlet concentration distribution under different rapping conditions.
Optimized operation through IOS
An IOS for intelligent ESP control is constructed according to the procedures and structure illustrated in and . The ESP is composed of 4 cascading discharging fields, each driven by a high-frequency high voltage power supply with a rated capacity of 72 kW. Except for #4 field, which is installed with spiral discharging electrodes that increase the discharging voltage with a lower current to enhance the removal of fine particles, the #1 to #3 fields use barbed wires to achieve decent corona discharge for the removal efficiency in a wider PM diameter range.
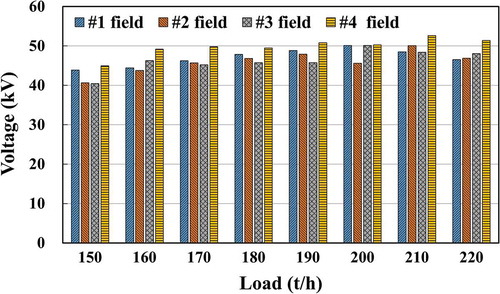
The examples of optimized operation set points, as shown in , are derived by solving the optimal problem through PSO. The optimized voltages change in different discharging fields, and the values in #4 field are the highest because the spiral discharging electrodes had lower discharging current compared with spiral electrodes at the same voltage, and a higher voltage is required for efficient removal of fine particles. Compared with the set points before using IOS, the reduction of energy consumption is in the range of 17.7% to 50.7%, which varies with the change of operation conditions.
Figure 9. Optimized operation set points at typical boiler loads.
Based on the optimized operation set points, IOS regulates the operating voltage through the proposed coordination control logic. To better study, the operation characteristic of IOS, the performance of IOS, PID, and manual control methods are studied. shows the online operation data in a duration of 3600 seconds. Blue, red, and yellow lines stand for IOS, PID, and manual operation, respectively.
Figure 10. Performance of IOS, PID, and manual control.
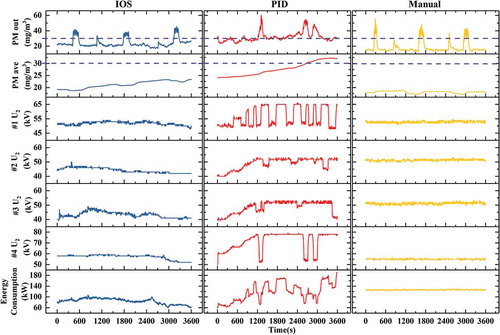
When the IOS is online, hourly average outlet concentration stays close to emission target without overshoot. The operating voltage at different fields changes according to the variation of outlet concentration at a limited range. A significant increase of #3 secondary voltage happens between 600 and 900 s, during which the operating value of #3 field is smaller than the optimized set points. Two parts of coordinated voltage correction, as presented in Section 2.3, are triggered simultaneously, leading to a larger voltage increase. Energy consumption is between 60 kW and 105 kW, varying with the change of operating voltage.
The PID control method leads to a large fluctuation of operation voltage because a specific logic is used to turn voltage down during rapping. The frequent changes in voltage result in a higher outlet concentration, and sometimes over the maximum allowed value of 30 mg/m3. As PID control is not able to adjust the voltage according to the theoretically optimized points, the energy consumption, which can be as high as 160 kW, is much higher than that of IOS method. PID control also results in a higher outlet concentration caused by rapping. As a result, in traditional field operation, manual control was preferred to achieve a more stable operation.
As to the manual control, operating secondary voltage is kept constant in the one-hour duration when the ESP is operated by human. The real-time outlet concentration is mostly under target value, and difference between the hourly average concentration and emission target is larger than 10 mg/m3. The energy consumption under manual control is relatively steady, between 120 and 130 kW.
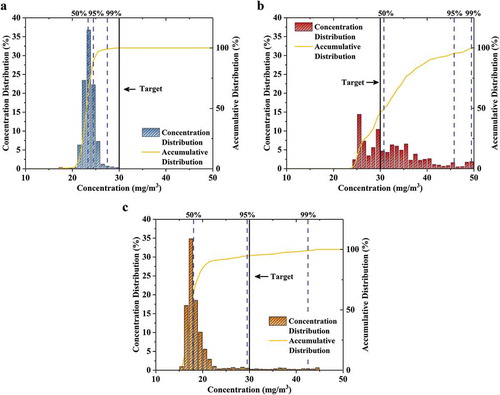
The emission distributions of three different control methods, derived from 500,000 sets of continuous operation data, are shown in . The emission of IOS method achieves 100% compliance rate for the target of 30 mg/m3, and the medium concentration is 23.53 mg/m3. Manual operation has a 95% compliance rate with a medium concentration of 17.89 mg/m3. This indicates that IOS can operate 46.6% (5.64 mg/m3) closer to the target, resulting in energy conservation. PID operation method could hardly meet the demanded emission target, with a medium concentration of 30.97 mg/m3.
Figure 11. The outlet concentration distribution of different operation methods.
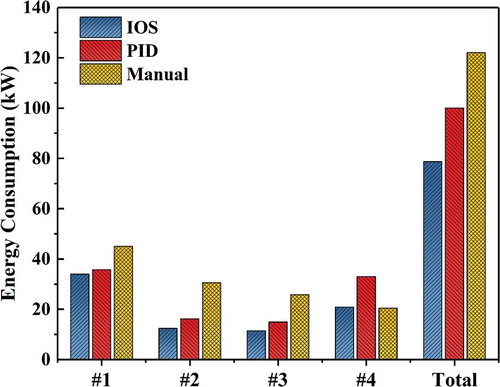
The average energy consumption of three different methods are derived and shown in . It is worth noting that the PID control method consumes more electricity than IOS but the outlet concentartion is still much higher due to the lack of rapping tolerance and set point optimization. The energy consumption of IOS at different discharging fields, except for #4 field, is lower than those of the other two methods. Compared with manual operation, which achieved the lowest emission with the highest energy consumption, IOS ensured a 100% compliance rate with 35.50% energy consumption reduction.
Figure 12. Comparing the energy consumption of IOS, PID, and manual control.
Conclusion and future work
In this study, a four-layer IOS for ESP including optimization, control, monitoring&communication, and execution is presented. The problem on the optimal energy consumption of ESP subject to the outlet concentration requirement is formulated with the energy consumption objective function and the outlet concentration mode. A coordination control logic is designed to regulate the optimized set points with real-time operation condition. Operation instructions from optimization and control modules are communicated into PLCs through OPC server. The operation distortion of the ESP is analyzed, and the operation is optimized. From the results of this study, the following conclusions can be drawn:
The IOS for ESP, connecting OPC server, ES, OS, CEMS, and other sensors, PLC, database, and execution facilities, enables the prediction, optimization, and communication tasks to be carried out simultaneously and effectively for real-time application;
For a one-chamber ESP, rapping behavior at the outlet field has the most significant impact on the outlet concentration fluctuation;
Performance comparison shown that IOS is able to adjust real-time operation voltage according to both the optimized set points and change in outlet concentration while maintaining stable operation under rapping;
The hourly average outlet concentration results from different control methods indicate that IOS can better tap the operation potential with a medium concentration of 23.53 mg/m3, which is 46.6% closer to emission target compared with manual control. More importantly, the compliance rate of IOS is 5% higher;
Operating with the same emission target of 30 mg/m3, IOS saves more than 35.5% electricity compared with manual operation while the hourly outlet concentration maintained a 100% compliance rate, proving IOS to be a reliable and effective method to achieve economic and effective PM removal in ESP.
The PM concentration model used in this paper is based on the PM removal mechanism in the electrostatic precipitator. Although the mechanism model can reflect the influence of factors on the removal efficiency of PM, such as flue gas parameters, particle diameter and etc., its accuracy is limited because each device has its own unique properties. Therefore, as our future work, we will investigate the effect of using historical operational data to modify the mechanism model. In addition, rapping at #4 field can cause the large distortion of outlet concentration. In order to achieve a higher instantaneous compliance rate, a more in-depth study on the trend of outlet concentration during rapping will be conducted in the future. Moreover, we will also focus on the application of IOS on small-scale ESPs in other industries and the development of real-time optimization method for large-scale ESPs in our future research.
Disclosure statement
No potential conflict of interest was reported by the authors.
Additional information
Funding
Notes on contributors
Chenghang Zheng
Chenghang Zheng is professor at State Key Lab of Clean Energy Utilization, State Environmental Protection Center for Coal-Fired Air Pollution Control, Zhejiang University, Hangzhou, China.
Zhongyang Zhao
Zhongyang Zhao is a Ph.D. Candidate at State Key Lab of Clean Energy Utilization, State Environmental Protection Center for Coal-Fired Air Pollution Control, Zhejiang University, Hangzhou, China.
Yishan Guo
Yishan Guo is a Ph.D. at State Key Lab of Clean Energy Utilization, State Environmental Protection Center for Coal-Fired Air Pollution Control, Zhejiang University, Hangzhou, China.
Haitao Zhao
Haitao Zhao is a postdoctoral researcher at State Key Lab of Clean Energy Utilization, State Environmental Protection Center for Coal-Fired Air Pollution Control, Zhejiang University, Hangzhou, China.
Weiguo Weng
Weiguo Weng is senior engineer at State Key Lab of Clean Energy Utilization, State Environmental Protection Center for Coal-Fired Air Pollution Control, Zhejiang University, Hangzhou, China.
Weihang Zhu
Weihang Zhu is associate professor at Department of Engineering Technology, University of Houston, Houston, TX, USA.
Baoyun Yu
Baoyun Yu is the general manager of Jiaxing Xinjia’aisi Thermal Power Co., Ltd., Jiaxing, China.
Xiang Gao
Xiang Gao is professor at State Key Lab of Clean Energy Utilization, State Environmental Protection Center for Coal-Fired Air Pollution Control, Zhejiang University, Hangzhou, China.
References
- Afshar-Mohajer, N., B. Damit, C.-Y. Wu, and N. Sorloaica-Hickman. 2011. Electrostatic particle collection in vacuum. Adv. Space Res. 48:933–42. doi:10.1016/j.asr.2011.04.030.
- Al-Hamouz, Z., A. El-Hamouz, and N. Abuzaid. 2011. Simulation and experimental studies of corona power loss in a dust loaded wire-duct electrostatic precipitator. Adv. Powder Technol. 22:706–14. doi:10.1016/j.apt.2010.10.005.
- Ali, M., K. Alam, Y. T. A. Al-Majali, and M. Kennedy. 2017. Novel hybrid composite discharge electrode for electrostatic precipitator. J. Air. Waste Manage. 67:1036–45. doi:10.1080/10962247.2017.1334718.
- BP. 2018. BP statistical review of world energy 2018. London: BP.
- Chen, T.-M., C.-J. Tsai, S.-Y. Yan, and S.-N. Li. 2014. An efficient wet electrostatic precipitator for removing nanoparticles, submicron and micron-sized particles. Sep. Purif. Technol. 136:27–35. doi:10.1016/j.seppur.2014.08.032.
- China Electricity Council. 2018. Annual report of china power. Accessed March 30, 2020. http://www.cec.org.cn/yaowenkuaidi/2018-06-14/181765.html.
- Cooperman, G. 1981. A new current-voltage relation for duct precipitators valid for low and high current densities. IEEE Trans. Ind. Appl. IA-17:236–39. doi:10.1109/TIA.1981.4503931.
- Cooperman, P. 1960. A theory for space-charge-limited currents with application to electrical precipitation. Trans. Am. Inst. Electr. Eng. Part I Commun. Electron. 79:47–50.
- Cooperman, P. 1974. Spontaneous ionization of gases at high temperature. IEEE Trans. Ind. Appl. IA–10:520–23. doi:10.1109/TIA.1974.349189.
- Dastoori, K., B. Makin, M. Kolhe, M. Des-Roseaux, and M. Conneely. 2013. CFD modelling of flue gas particulates in a biomass fired stove with electrostatic precipitation. J. Electrostat. 71:351–56. doi:10.1016/j.elstat.2012.12.039.
- Deutsch, W. 1922. Bewegung und Ladnng der Elektrizitatstrager im Zylinderkondensator. Ann. Phys. 168:335. doi:10.1002/andp.19223731203.
- Elbeltagi, E., T. Hegazy, and D. Grierson. 2005. Comparison among five evolutionary-based optimization algorithms. Adv. Eng. Inform. 19:43–53. doi:10.1016/j.aei.2005.01.004.
- Fothergill, J. C., P. W. Devine, and P. W. Lefley. 2001. A novel prototype design for a transformer for high voltage, high frequency, high power use. IEEE Trans. Power Deliver. 16:89–98. doi:10.1109/61.905601.
- Gardner, J. L., W. He, C. Li, J. Wong, K. L. Sale, B. A. Simmons, S. Singh, and D. Tanjore. 2015. Calorimetric evaluation indicates that lignin conversion to advanced biofuels is vital to improving energy yields. RSC Adv. 5:51092–101. doi:10.1039/C5RA01503K.
- Grass, N. 2002. Fuzzy-logic-based power control system for multifield electrostatic precipitators. IEEE Trans. Ind. Appl. 38:1190–95. doi:10.1109/TIA.2002.802998.
- Grass, N., A. Zintl, and E. Hoffmann. 2010. Electrostatic precipitator control systems enhancing precipitation efficiency using conventional and fuzzy logic control. IEEE Ind. Appl. Mag. 16:28–33. doi:10.1109/MIAS.2010.936967.
- Guo, B., A. Yu, and J. Guo. 2015. Numerical modelling of ESP for design optimization. Procedia Eng. 102:1366–72. doi:10.1016/j.proeng.2015.01.268.
- Hashimoto, Y., H. Murase, T. Morimoto, and T. Torii. 2001. Intelligent systems for agriculture in Japan. IEEE Contr. Syst. Mag. 21:71–85.
- Jaworek, A., A. Krupa, and T. Czech. 2007. Modern electrostatic devices and methods for exhaust gas cleaning: A brief review. J. Electrostat. 65:133–55. doi:10.1016/j.elstat.2006.07.012.
- Kadiyala, A., D. Kaur, and A. Kumar. 2013. Development of hybrid genetic-algorithm-based neural networks using regression trees for modeling air quality inside a public transportation bus. J. Air. Waste Manage. 63:205–18. doi:10.1080/10962247.2012.741054.
- Kennedy, J., and R. Eberhart. 1995. Particle swarm optimization. IEEE Int. Conf. Neural Netw. 4:1942–48.
- Kettleson, E. M., J. M. Schriewer, R. M. L. Buller, and P. Biswas. 2013. Soft-X-ray-enhanced electrostatic precipitation for protection against inhalable allergens, ultrafine particles, and microbial infections. Appl. Environ. Microb. 79:1333–41. doi:10.1128/AEM.02897-12.
- Kiss, I., and I. Berta. 2001. New concept of ESP modelling based on fuzzy logic. J. Electrostat. 51-52:206–11. doi:10.1016/S0304-3886(01)00111-5.
- Klippel, N. 2000. The influence of high-voltage pulse parameters on corona current in electrostatic precipitators. J. Electrostat. 49:31–49. doi:10.1016/S0304-3886(00)00002-4.
- Lawless, P. A. 1996. Particle charging bounds, symmetry relations, and an analytic charging rate model for the continuum regime. J. Aerosol. Sci. 27:191–215. doi:10.1016/0021-8502(95)00541-2.
- Le, T. C., G. Y. Lin, and C. J. Tsai. 2013. The predictive method for the submicron and nano-sized particle collection efficiency of multipoint-to-plane electrostatic precipitators. Aerosol. Air. Qual. Res. 13:1404–10. doi:10.4209/aaqr.2013.05.0144.
- Li, Z., C. Shao, Y. An, and G. Xu. 2013. Energy-saving optimal control for a factual electrostatic precipitator with multiple electric-field stages based on GA. J. Process. Contr. 23:1041–51. doi:10.1016/j.jprocont.2013.06.007.
- Li, Z., Y. Wang, Y. Lu, and P. Biswas. 2019. Investigation of aerosol and gas emissions from a coal-fired power plant under various operating conditions. J. Air. Waste Manage. 69:34–46.doi:10.1080/10962247.2018.1503981
- Liao, C. W., and Y. S. Tarng. 2009. On-line automatic optical inspection system for coarse particle size distribution. Powder Technol. 189:508–13. doi:10.1016/j.powtec.2008.08.013.
- Lin, G. Y., T. M. Chen, and C. J. Tsai. 2012. A modified Deutsch-Anderson equation for predicting the nanoparticle collection efficiency of electrostatic precipitators. Aerosol. Air. Qual. Res. 12:509–15. doi:10.4209/aaqr.2012.04.0085.
- Loughlin, D. H., S. R. Ranjithan, J. W. Baugh Jr., and E. D. Brill Jr. 2000. Application of genetic algorithms for the design of ozone control strategies. J. Air. Waste Manage. 50:1050–63. doi:10.1080/10473289.2000.10464133.
- Ministry of Environmental Protection of PRC, G. A. o. Q. S., Inspection and Quarantine of PRC. 2011. Emission standard of air pollutants for thermal power plants. GB/T 13223-2011. Accessed July 2, 2019. http://kjs.mee.gov.cn/hjbhbz/bzwb/dqhjbh/dqgdwrywrwpfbz/201109/t20110921_217534.shtml.
- Mizuno, A. 2000. Electrostatic precipitation. IEEE Trans. Dielect. El. In. 7:615–24. doi:10.1109/94.879357.
- Mukherjee, K., N. K. Roy, and S. Das. 2014. Centralized remote monitoring of electrostatic precipitators to enforce proper usage. Allahabad, India: International Computer and Communication Technology (ICCCT), 351–54.
- Nabaei, A., M. Hamian, M. R. Parsaei, R. Safdari, T. Samad-Soltani, H. Zarrabi, and A. Ghassemi. 2016. Topologies and performance of intelligent algorithms: A comprehensive review. Artif. Intell. Rev. 49:79–103. doi:10.1007/s10462-016-9517-3.
- National Bureau of Statistics. 2019. China statistical yearbook. Accessed March 30, 2020. http://www.stats.gov.cn/tjsj/ndsj/2018/indexch.htm.
- National Development and Reform Commission of PRC, M. o. E. P. o. P., National Energy Administration of PRC. 2014. The upgrade and transformation action plan for coal-fired power energy saving and emission reduction (2014–2020). Accessed March 30, 2020. http://zfxxgk.nea.gov.cn/auto84/201409/t20140919_1840.htm.
- Noda, N., and H. Makino. 2010. Influence of operating temperature on performance of electrostatic precipitator for pulverized coal combustion boiler. Adv. Powder Technol. 21:495–99. doi:10.1016/j.apt.2010.04.012.
- Patiño, D., B. Crespo, J. Porteiro, E. Villaravid, and E. Granada. 2016. Experimental study of a tubular-type ESP for small-scale biomass boilers. Preliminary results in a diesel engine. Powder Technol. 288:164–75. doi:10.1016/j.powtec.2015.11.006.
- Pedregosa, F., G. Varoquaux, A. Gramfort, V. Michel, B. Thirion, O. Grisel, M. Blondel, P. Prettenhofer, R. Weiss, V. Dubourg, et al. 2011. Scikit-learn: Machine learning in Python. J. Mach. Learn. Res. 12:2825–30.
- Penney, G. W., and P. C. Gelfand. 1978. The trielectrode electrostatic precipitator for collecting high resistivity dust. J. Air. Pollut. Contr. Assoc. 28:53–54. doi:10.1080/00022470.1978.10470562.
- Perhinschi, M. G., C. Marlowe, S. Tamayo, J. Tu, and W. S. Wayne. 2011. Evolutionary algorithm for vehicle driving cycle generation. J. Air. Waste Manage. 61:923–31. doi:10.1080/10473289.2011.596742.
- Prasad, N., T. Lakshminarayana, J. R. K. Narasimham, T. M. Verman, and C. Raju. 1999. Automatic control and management of electrostatic precipitator. IEEE Trans. Ind. Appl. 35:561–67. doi:10.1109/28.767002.
- Qi, Z., J. Li, D. Wu, W. Xie, X. Li, and C. Liu. 2017. Particulate matter emission characteristics and removal efficiencies of a low-low temperature electrostatic precipitator. Energ. Fuel 31:1741–46. doi:10.1021/acs.energyfuels.6b02692.
- Qin, X., G. Huang, and L. Liu. 2010. A genetic-algorithm-aided stochastic optimization model for regional air quality management under uncertainty. J. Air. Waste Manage. 60:63–71. doi:10.3155/1047-3289.60.1.63.
- Shi, Y., X. Wang, D. Chu, F. Sun, and Z. Guo. 2016. An experimental study of ash accumulation in flue gas. Adv. Powder Technol. 27:1473–80. doi:10.1016/j.apt.2016.05.007.
- Sobczyk, A. T., A. Marchewicz, A. Krupa, A. Jaworek, T. Czech, Ł. Śliwiński, D. Kluk, A. Ottawa, and A. Charchalis. 2017. Enhancement of collection efficiency for fly ash particles (PM2.5) by unipolar agglomerator in two-stage electrostatic precipitator. Sep. Purif. Technol. 187:91–101. doi:10.1016/j.seppur.2017.06.039.
- Sui, Z., Y. Zhang, Y. Peng, P. Norris, Y. Cao, and W.-P. Pan. 2016. Fine particulate matter emission and size distribution characteristics in an ultra-low emission power plant. Fuel 185:863–71. doi:10.1016/j.fuel.2016.08.051.
- Tański, M., A. Berendt, and J. Mizeraczyk. 2019. Closed SDBD-driven two-stage electrostatic precipitator. J. Clean. Prod. 226:74–84. doi:10.1016/j.jclepro.2019.03.280.
- Wu, C. C., and N. B. Chang. 2003. Global strategy for optimizing textile dyeing manufacturing process via GA-based grey nonlinear integer programming. Comput. Chem. Eng. 27:833–54. doi:10.1016/S0098-1354(02)00270-3.
- Wu, H., and Z. Wan. 2018. A multiobjective optimization model and an orthogonal design-based hybrid heuristic algorithm for regional urban mining management problems. J. Air. Waste Manage. 68:146–69. doi:10.1080/10962247.2017.1386141.
- Yan, P., C. Zheng, W. Zhu, X. Xu, X. Gao, Z. Luo, M. Ni, and K. Cen. 2016. An experimental study on the effects of temperature and pressure on negative corona discharge in high-temperature ESPs. Appl. Energ. 164:28–35. doi:10.1016/j.apenergy.2015.11.040.
- Yang, Z., C. Zheng, S. Liu, Y. Guo, C. Liang, Y. Wang, D. Hu, and X. Gao. 2018. A combined wet electrostatic precipitator for efficiently eliminating fine particle penetration. Fuel Process. Technol. 180:122–29. doi:10.1016/j.fuproc.2018.08.013.
- Yawootti, A., P. Intra, N. Tippayawong, and P. Rattanadecho. 2015. An experimental study of relative humidity and air flow effects on positive and negative corona discharges in a corona-needle charger. J. Electrostat. 77:116–22. doi:10.1016/j.elstat.2015.07.011.
- Zawbaa, H. M., S. Schiano, L. Perez-Gandarillas, C. Grosan, A. Michrafy, and C.-Y. Wu. 2018. Computational intelligence modelling of pharmaceutical tabletting processes using bio-inspired optimization algorithms. Adv. Powder Technol. 29:2966–77. doi:10.1016/j.apt.2018.11.008.
- Zhang, X. 2016. Emission standards and control of PM2.5 from coal-fired power plant. London, UK: IEA Clean Coal Centre.
- Zheng, C., Q. Chang, Q. Lu, D. Yang, X. Gao, and K. Cen. 2016. Developments in unipolar charging of airborne particles: Theories, simulations and measurements. Aerosol. Air. Qual. Res. 16:3037–54. doi:10.4209/aaqr.2016.07.0319.