
 ?Mathematical formulae have been encoded as MathML and are displayed in this HTML version using MathJax in order to improve their display. Uncheck the box to turn MathJax off. This feature requires Javascript. Click on a formula to zoom.
ABSTRACT
Mixing ratios of the criteria air contaminant nitrogen dioxide (NO2) are commonly quantified by reduction to nitric oxide (NO) using a photolytic converter followed by NO-O3 chemiluminescence (CL). In this work, the performance of a photolytic NO2 converter prototype originally designed for continuous emission monitoring and emitting light at 395 nm was evaluated. Mixing ratios of NO2 and NOx (= NO + NO2) entering and exiting the converter were monitored by blue diode laser cavity ring-down spectroscopy (CRDS). The NO2 photolysis frequency was determined by measuring the rate of conversion to NO as a function of converter residence time and found to be 4.2 s−1. A maximum 96% conversion of NO2 to NO over a large dynamic range was achieved at a residence time of (1.5 ± 0.3) s, independent of relative humidity. Interferences from odd nitrogen (NOy) species such as peroxyacyl nitrates (PAN; RC(O)O2NO2), alkyl nitrates (AN; RONO2), nitrous acid (HONO), and nitric acid (HNO3) were evaluated by operating the prototype converter outside its optimum operating range (i.e., at higher pressure and longer residence time) for easier quantification of interferences. Four mechanisms that generate artifacts and interferences were identified as follows: direct photolysis, foremost of HONO at a rate constant of 6% that of NO2; thermal decomposition, primarily of PAN; surface promoted photochemistry; and secondary chemistry in the connecting tubing. These interferences are likely present to a certain degree in all photolytic converters currently in use but are rarely evaluated or reported. Recommendations for improved performance of photolytic converters include operating at lower cell pressure and higher flow rates, thermal management that ideally results in a match of photolysis cell temperature with ambient conditions, and minimization of connecting tubing length. When properly implemented, these interferences can be made negligibly small when measuring NO2 in ambient air.
Implications: A new near-UV photolytic converter for measurement of the criteria pollutant nitrogen dioxide (NO2) in ambient air by CL was characterized. Four mechanisms that generate interferences were identified and investigated experimentally: direct photolysis of HONO which occurred at a rate constant 6% that of NO2, thermal decomposition of PAN and N2O5, surface promoted chemistry involving HNO3, and secondary chemistry involving NO in the tubing connecting the converter and CL analyzer. These interferences are predicted to occur in all NO2 P-CL systems but can be avoided by appropriate thermal management and operating at high flow rates.
Introduction
Nitrogen oxides (NOx), comprised of nitric oxide (NO) and nitrogen dioxide (NO2), are generated as by-products when air is used as an oxidant in combustion reactions. Once released to the atmosphere, NOx plays a central role in photochemical ozone (O3) production and aerosol formation (Frost et al. Citation2006; Meng, Dabdub and Seinfeld Citation1997), impacting air quality. Hence, continuous monitoring of NOx concentrations at the points of emission at mixing ratios exceeding 1 part per million by volume (10−6, ppmv) and of NOx in ambient air at trace level, usually below 1 part per billion by volume (10−9, ppbv) are needed. For both applications, NO-O3 chemiluminescence (CL) is commonly chosen (or mandated by law) for NOx analysis (Jahnke Citation2000; Penkett et al. Citation2011). In this method, NO is oxidized in excess O3 to produce excited state NO2*, which relaxes to the ground state by emitting a photon (Clough and Thrush Citation1966); the intensity of the generated light is proportional to the NO concentration sampled (Fontijn, Sabadell, and Ronco Citation1970):
Mixing ratios of NOx (and, by difference, NO2) are quantified following reduction of NO2 to NO. One example method by which NO2 is converted to NO is the heated molybdenum (Mo) converter (Fehsenfeld et al. Citation1987; Gluck et al. Citation2003; Williams et al. Citation1998):
Heated Mo converters also reduce many other components of total odd nitrogen (NOy) to NO, such as peroxyacyl nitrates (PAN; RC(O)O2NO2), alkyl nitrates (AN; RONO2), and nitric acid (HNO3) which are formed as by-products of photochemical O3 production (Dunlea et al. Citation2007; Steinbacher et al. Citation2007; Winer et al. Citation1974). In spite of this, heated Mo converters remain in use for NO2 measurement in some ambient air quality monitoring networks. For more accurate measurements of NO2, photolytic conversion (Kley and McFarland Citation1980; Pollack, Lerner and Ryerson, Citation2010; Ryerson, Williams and Fehsenfeld Citation2000; Reed et al. Citation2016b; Sadanaga et al. Citation2010) of NO2 to NO followed by CL detection (P-CL) has been recommended (Dunlea et al. Citation2007; Penkett et al. Citation2011) over CL monitors equipped with heated Mo catalysts since the former does not suffer from this systematic interference:
Since air contains oxygen (O2; ~21% by volume), the atomic oxygen generated in reaction (4) reacts with O2 to form O3:
gives an overview of photolytic NO2 converters that have been reported in the literature.
Table 1. Photolytic NO2 converters reported in the literature. BLC = blue light converter. n/d = not determined or stated.
An important parameter for these devices is their conversion factor or fraction (CF), given by the ratio of the amount of NO generated, Δ[NO], over the amount of NO2 entering the converter, [NO2]0 (Kley and McFarland Citation1980):
If NOx is conserved, Δ[NO] equals [NO2]0 – [NO2]f, where [NO2]f is the amount of NO2 exiting the converter. In practice, CF is a function of the residence time tres of the sampled gas in the photolysis cell (Ryerson, Williams, and Fehsenfeld Citation2000):
Here, j(NO2) is the NO2 photolysis frequency, and k[Ox] denotes a pseudo-first order rate coefficient multiplied by the effective concentration of oxidants which convert some of the photochemically generated NO back to NO2:
These oxidants include O3, the hydro and alkyl peroxyl radicals (HO2 and RO2), and unknown species. The magnitudes of j(NO2) and k[Ox] can be determined from a fit of EquationEquation (7)(7)
(7) to a scatter plot of CF against tres (Kley and McFarland Citation1980; Pollack, Lerner, and Ryerson Citation2010).
The quantification of NO2 in ambient air by P-CL has been extensively validated by inter-comparison with other NO2 measurements (Fehsenfeld et al. Citation1990; Fuchs et al. Citation2010). Though recent converters utilizing light centered in the 360 nm to 395 nm wavelength range provide highly selective NO2 photolysis, they are still prone to undesired photolysis of species such as HONO, bromine nitrate (BrONO2), or nitryl chloride (ClNO2) (Pollack, Lerner, and Ryerson Citation2010). Furthermore, these devices usually exhibit a small zero offset or artifact (). In addition, recent studies have reported positive interference in certain photolysis systems from PAN thermal decomposition as a result of poor thermal management (Reed et al. Citation2016b) and negative interference from photolysis of α,β-dicarbonyls when present at mixing ratios near the parts-per-million (ppmv, 10−6) mark (Villena et al. Citation2012).
In this article, we characterize a photolytic NO2 converter prototype, originally designed for continuous emission monitoring systems (CEMS) (Odame-Ankrah and Rosentreter Citation2017), to determine its optimum operating conditions for ambient air NO2 monitoring. The converter uses a proprietary set of chip arrays containing forty ~395 nm light emitting diodes (LEDs) to photodissociate NO2 to NO, and was developed primarily for selective reduction of NO2 at operating pressures of typically <200 Torr (Odame-Ankrah and Rosentreter Citation2017). Here, the performance of the converter was evaluated outside its normal operating range (i.e., at higher pressure deviating the converter from its optimum performance) to intentionally accentuate interferences that, when operated under manufacturer specified conditions, are much reduced. The amounts of NO2, NOx, and other components of NOy entering and exiting the converter were quantified by blue diode laser cavity ring-down spectroscopy (CRDS) (Taha, Odame-Ankrah, and Osthoff Citation2013). The measurement of nitrogen oxides by CRDS has been extensively validated (including by comparison with CL---see, for example, of Fuchs et al. Citation2009); the key advantages of CRDS is that mixing ratios are measured by optical absorption such that the instrument response does not need to rely on external calibration. Parameters such as the NO2 to NO conversion fraction (CF), the NO2 photolysis frequency (j(NO2)), the NO oxidation rate (k[Ox]), zero offset, relative humidity (RH) dependence, and the extent of potential interferences from HONO, PAN, isopropyl nitrate, and HNO3 were determined. The purpose of this manuscript is not to present a device that surpasses existing converters in interference suppression, but to highlight interfering processes that likely exist in all such devices but are rarely quantified. Considerations to improve the performance of the photolytic converter prototype are discussed.
Methods
Photolytic NO2 converter
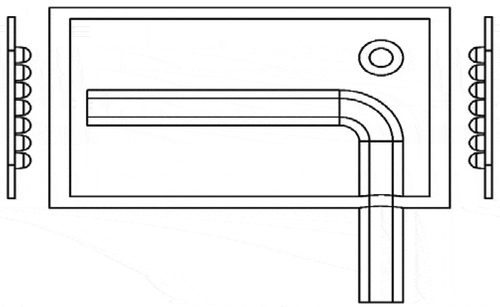
The design of the photolytic NO2 converter has been described elsewhere (Odame-Ankrah and Rosentreter Citation2017). Briefly, shows a sketch of the photolysis cell which has an internal volume of ~88 cm3 and is comprised of a cylindrical body made of ultraviolet (UV) grade quartz and two windows on opposite ends of the cell. The body of the chamber is wrapped with a highly reflective UV grade material (i.e., aluminum foil, Fabritech) to increase the photolysis of NO2. The photolysis cell features an outlet tube extending axially along the wall of the chamber and perpendicular to the inlet (). This design promotes a cyclonic flow pattern inside the reaction chamber which tapers toward the entrance of the outlet within the reaction chamber. The relatively small inner diameter of the outlet tube (~3.8 mm) and its proximity to one of the light source modules (the distance between the end of the outlet tube and the surface of the distal quartz window is ~5 mm) reduces the time available for secondary chemistry between the points of photodissociation and observation of NO downstream and outside the converter. At its manufacturer-recommended operating condition, i.e., a pressure of ~160 Torr and a flow rate of 600 standard cubic centimeters per minute (sccm), the residence times (calculated assuming plug flow) are ~1.7 s and ~0.05 s within the reaction chamber and outlet tube, respectively. The particular model used in these experiments contained three internal cooling fans: two to cool the LED chips, and one to cool the photolysis cell.
Figure 1. Schematic of the photolytic NO2 converter. (a) Light source modules comprised of LED chip arrays and cooling elements. (b) Quartz window proximal to inlet. (c) Quartz window distal to inlet. (d) Inlet tubing (tangential to the plane of view). (e) Exit tubing for transport of the photolytic products to the reaction chamber of the chemiluminescence analyzer (not shown).
Gas-phase measurements
The CRDS used in this work was a compact, two-channel instrument with 55 cm long optical cavities called General Nitrogen Oxide Measurement (GNOM; Figure S1e) (Taha, Odame-Ankrah, and Osthoff Citation2013). Briefly, mixing ratios of NO2 were quantified by optical absorption at 405 nm at a time resolution of 1 s. Mixing ratios of NOx (and, by difference, NO) were quantified in parallel by converting NO to NO2 through the addition of excess O3 to the inlet (reaction 1) (Fuchs et al. Citation2009; Odame-Ankrah Citation2015). Alternatively, the sampling channels were equipped with heated quartz inlets to convert other components of NOy to NO2, such as PAN, alkyl nitrates, or HNO3 (Paul, Furgeson, and Osthoff Citation2009). Concentrations of PAN, for example, were determined with one CRDS channel operated at room temperature (to measure background NO2), while the other sampled via a quartz tube heated to 250°C to dissociate PAN to NO2; PAN was then quantified by difference (Paul and Osthoff Citation2010). Mixing ratios of NOy were quantified by thermal dissociation of HONO (to HO and NO) and HNO3 (to HO and NO2) at 600°C followed by addition of excess O3 which oxidizes NO to NO2 (Wild et al. Citation2014). In the absence of added O3, this channel did not yield quantitative data since NO partially oxidized to NO2.
In addition, mixing ratios of NO, NO2, or NOx were monitored using a commercial NO/NOx CL-analyzer equipped with an internally mounted heated Mo converter (Thermo 42i-TL; Figure S1c), mixing ratios of O3 using a commercial UV-absorption O3 monitor (Thermo 49i), and mixing ratios of HONO by a cavity-enhanced absorption spectrometer (CEAS) (Jordan and Osthoff Citation2020).
The instruments sampled from a common inlet manifold (Figure S1c) with 1/4” (0.635 cm) outer diameter (o.d.) and 3/16” (0.476 cm) inner diameter (i.d.) fluorinated ethylene propylene (FEP) Teflon™ tubing (VWR) and through membrane filters (2 μm pore size, Pall) housed in Teflon™ filter holders (Cole Parmer).
Generation and delivery of gas mixtures
The common inlet was flooded with synthetic, NOx-free “zero air” delivered from a custom zero air generation system (Figure S1b). Part of this flow was passed through a water bubbler to control the RH, which was measured using a commercial RH probe (VWR) installed inline. For low RH experiments, dry air was delivered from a compressed gas cylinder containing NOx-free air (Air Liquide, Alphagaz grade). Excess gas was vented into an exhaust line.
Calibration gases were added to the common inlet via a pair of Teflon™ tee fittings (Entegris Fluid Handling) in a similar fashion as shown in of Odame-Ankrah and Osthoff (Odame-Ankrah and Osthoff Citation2011). One tee was placed inside the main inlet line, and its third arm was connected to the second tee (Figure S1c). One arm of this second tee was connected to the calibration gas stream (generated as described below), while the other was connected to a normally open 2-way valve (Cole-Parmer) whose other end was connected to an exhaust pump to enable rapid on/off switching of the calibration gas stream (Odame-Ankrah and Osthoff Citation2011).
Mixtures of NO and NO2 in air were generated using the output of a gas cylinder (100.2 ppmv NO in O2-free N2, Scott-Marrin; Figure S1a). This gas cylinder’s 2-stage regulator was connected via 1/8” (0.318 cm) o.d. and 0.060” (1.52 mm) i.d. polyether ether ketone (PEEK™) tubing (VICI Valco) to an all-metal mass flow controller (MFC; MKS Instruments; 20 or 100 sccm capacity). The tubing was constructed from PEEK™ to minimize O2 contamination. The output of the MFC was combined with a flow of ~50 sccm of O3 in O2, delivered via a 50 μm critical orifice and a cylinder back pressure of 20 pounds per square inch (psi; ~1.4 bar). The O3 was generated by irradiating part of the O2 flow with a Hg pen-ray lamp in a commercial “O3 generator” (VWR). The combined flow was passed through a ~ 7.2 m long coil of 1/4” (0.635 cm) o.d. and 3/16” (0.476 cm) i.d. FEP Teflon™ tubing (Figure S1a) to allow reaction (1) to go to completion.
Synthesis and delivery of PAN, HONO, isopropyl nitrate (IPN) and HNO3 is described in the S.I.
Evaluation of converter performance by CRDS
The CF was determined over a range of cell pressures and residence times, tres, by choosing appropriate inlet flow restrictions and varying the total flow rate. For most experiments shown in this article, a flow restriction was placed at the tip of each CRDS inlet, such that CRDS cell pressures were in the range of ~140 Torr to ~680 Torr at total sample flow rates of between 0.2 to 2.0 standard liters per minutes (slpm). The converter was placed between the CRDS and the CRDS inlet flow restriction (i.e., in the reduced pressure region) and was connected via 1/4” o.d. Teflon™ tubing. The internal volume of the connecting tubing was ~50 cm3 (length ≈ 2.8 m) for experiments conducted prior to April 2018 (results shown in and S3) and reduced to ~12 cm3 (length ≈ 0.7 m) in all other experiments. The pressure within the converter was monitored using an external pressure transducer (MKS). Interferences were evaluated at a pressure of 420 Torr and flow rate of 0.90 slpm, i.e., a 3.5 s residence time, unless noted otherwise.
The photolytic converter could be manually bypassed (typically once every other minute) using a pair of 2-way Teflon™ valves (Entegris Fluid Handling). When it was inline, GNOM quantified the mixing ratios of NO2 and NOx exiting the converter, from which the amount of NO was calculated by difference. When the converter was bypassed, GNOM quantified [NO2]0 and [NOx]0, i.e., the amounts entering the converter.
For some experiments, the flow restriction was moved between the photolytic converter and the CRDS, and a bypass flow of up to 12 slpm was added to facilitate larger flow rates and shorter photolysis cell residence times.
Box model simulations
EquationEquation (7)(7)
(7) neglects potential recombination of the photodissociation products in the tubing connecting the photolysis cell and NOx analyzer. Most importantly, the O3 generated by reaction (5) can titrate NO to NO2 (reaction (1)). This is neglected in the instruments described by Kley and McFarland (Kley and McFarland Citation1980) and Pollack et al. (Pollack, Lerner, and Ryerson Citation2010) because their respective photolysis cells and NO analyzers were tightly integrated. However, with the external converter setup, the residence time and chemistry in the connecting tubing are significant. A box model was constructed using the software package Igor PRO (Wavemetrics) to simulate the chemistry in the converter and in the connecting tubing. Details are given in the S.I.
LED emission spectrum and j constants
The LED emission spectrum was recorded using an Ocean-Optics USB-2000 (wavelength range 200 nm–500 nm, 200 μm entrance slit). Photolysis frequencies (referred to as j constants) of NO2, NO3, PAN, and HONO were calculated by multiplying the observed emission spectrum, F(λ), with room-temperature absorption cross-sections, σ(λ,T), and quantum yields, ϕ(λ,T), taken from the NASA-JPL evaluation (Burkholder et al. Citation2015), and integrating over all wavelengths:
Photolysis frequencies were scaled to j(NO2), which was determined from a fit to EquationEquation (7)(7)
(7) .
Results
Determination of NO2 conversion fraction
Sample time series and CF as a function of RH
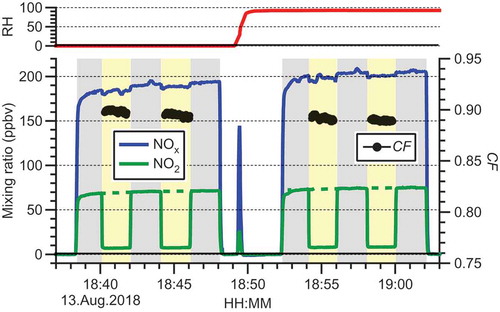
A sample time series of a typical experiment is shown in . The CRDS sampled NOx-free air delivered from a cylinder using an MFC at a flow rate of 1.8 slpm before 18:38, from 18:48 to 18:52, and after 19:02. At 18:49, the make-up gas was humidified with the aid of a bubbler. The top panel shows the RH of the make-up gas, which was continuously monitored. A mixture of NO and NO2 was added to the gas stream at a flow rate of 100 sccm from 18:18 to 18:48 and from 18:52 to 19:02. After dilution, the NO mixing ratio was in the range of 120 to 130 ppbv, and the NO2 mixing ratio in the range of 70 to 74 ppbv. The converter was then switched in- and offline approximately every 120 s (indicated by light yellow and gray backgrounds, respectively). The green dashed line indicates the interpolated mixing ratio of NO2 delivered from the NOx source during this time, [NO2]0.
Figure 2. Sample time series demonstrating the determination of the conversion fraction (CF) and its dependence on relative humidity (RH) and a pressure of 415 ± 1 Torr. The CRDS sampled NO2-free air delivered from a cylinder using a mass flow controller at a flow rate of 1.8 slpm before 18:38, from 18:48 to 18:52, and after 19:02. From 18:18 to 18:48 and 18:52 to 19:02, a mixture of NO and NO2 was added to the gas stream at a flow rate of 100 sccm. The converter was switched in- and offline approximately every 120 s (indicated by light yellow and gray backgrounds, respectively). The green dashed line indicates the interpolated mixing ratio of NO2 delivered from the NOx source. CF was calculated using EquationEquation (6(6)
(6) ) and is shown on the right axis. At 18:49, the make-up gas was humidified with the aid of a bubbler. The top panel shows the RH of the make-up gas that was continuously monitored using an RH probe.
Since the concentration of NOx is unaffected by the photolytic converter, the CF can be calculated from the right-hand side of EquationEquation (6)(6)
(6) , i.e., by dividing the difference between [NO2]0 and [NO2]f by [NO2]0. The CF is shown on the right axis. In the example shown, an average CF of 89.7% (±0.2% standard deviation) was calculated at 0% RH, while the CF was (89.1 ± 0.2)% at 93% RH. These RH values cover the extremes found in ambient air; we conclude that CF is not a function of RH.
CF as a function of residence time
The experiment shown in was repeated over a range of pressures and sample flows and with NOx samples that contained >90% NO2. A subset of the results is shown in . At low flow rates (and long photolysis cell and connecting tubing residence time), the observed CF was ~70%. As the flow rate is increased and/or the pressure is decreased, the CF increases and approached unity. At a flow rate of 2 slpm and <300 Torr pressure (), the residence time in the converter is too short to fully dissociate NO2, such that the CF is lower. Optimum conditions (i.e., maximum CF) could be reached at a variety of flow rates and pressures; this optimum region is shown with a gray underlay, and encompasses flows and pressures of commonly used NO analyzers. The CF in this region was evaluated prior to this study and found to be >0.95.
Figure 3. (a) NO2 conversion efficiency (CF) as a function of photolysis cell pressure and flow rate. The symbols denote different flow restrictions used in the experiments. The area shaded in gray indicates the optimum operating region. The open black circles show typical pressures and flows of NOx analyzers. T42 = Thermo Scientific 42, AT200 = Advanced Pollution Instrumentation 200, S6040 = Sabio Environmental 6040, ECLD8 = Ecophysics CLD88sp. (b) CF as a function of photolysis cell residence time (data from Figure 3a are shown in red color). The black dashed line is a fit to the data <0.7 s residence time assuming that k[Ox] equals zero. The solid blue line is a fit of EquationEquation (7(7)
(7) ) to the data shown in blue color.
![Figure 3. (a) NO2 conversion efficiency (CF) as a function of photolysis cell pressure and flow rate. The symbols denote different flow restrictions used in the experiments. The area shaded in gray indicates the optimum operating region. The open black circles show typical pressures and flows of NOx analyzers. T42 = Thermo Scientific 42, AT200 = Advanced Pollution Instrumentation 200, S6040 = Sabio Environmental 6040, ECLD8 = Ecophysics CLD88sp. (b) CF as a function of photolysis cell residence time (data from Figure 3a are shown in red color). The black dashed line is a fit to the data <0.7 s residence time assuming that k[Ox] equals zero. The solid blue line is a fit of EquationEquation (7(7) CF=jNO2tresjNO2tres+kOxtres1−e−jNO2tres−kOxtres(7) ) to the data shown in blue color.](/cms/asset/4a8ed0e2-b20a-40af-bac3-4d953435c118/uawm_a_1769770_f0003_oc.jpg)
A plot of CF against photolysis cell residence time is shown in . Data points corresponding to those shown in are shown as red circles. There are two distinct regimes: At short residence times (data points shown in blue), conversion of NO2 is photon limited, and CF increases. The solid blue line shows a fit of EquationEquation (7)(7)
(7) to these data, which gave j(NO2) = 4.2 s−1 and k[Ox] = 0.16 s^−1. The dashed black line shows a fit of the data with residence < 0.7 s to EquationEquation (7)
(7)
(7) , with j(NO2) = 3.7 s−1 and k[Ox] constrained to 0.0 s−1.
At long residence times (data points shown in red), CF decreased because of secondary chemistry in the tubing connecting the converter and CRDS, namely the relatively slow reaction of the photolysis products NO and O3 (reactions 1 and 2), which is investigated in more detail below in the section titled “Oxidation of NO to NO2 in the connecting tubing.”
The intermediate, optimum region with highest CF values is highlighted in gray and reaches from ~1.3 s to ~2.0 s residence time.
Photolysis frequencies
shows the LED emission spectrum, whose peak intensity is at 394.9 nm. The spectrum is slightly asymmetric with higher intensity at longer wavelengths. The parameters of an exponentially modified Gaussian function (Jeansonne and Foley Citation1991) were fitted to the observed spectrum using the “fExpGauss” function of Igor Pro, which gave the following parameters: Gaussian location = 389.7 ± 0.5 nm, full-width-at-half-maximum (FWHM) = (12.1 ± 1.1) nm (σ = (5.15 ± 0.45) nm), and τ = 10.16 ± 1.04.
Figure 4. Overlap of NO2, HONO, and NO3 absorption cross-sections (Burkholder et al., Citation2015; Voigt et al., Citation2002) (left axis) and NO2 quantum yield (ϕ; right axis) with the LED emission spectrum (right-axis).
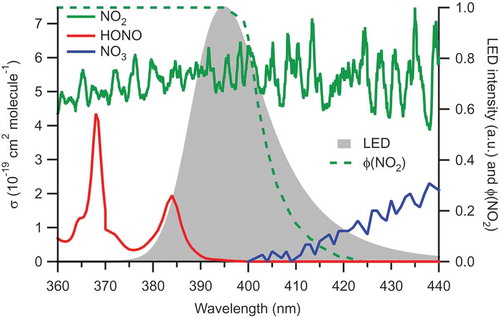
summarizes photolysis frequencies calculated using EquationEquation (9)(9) from the observed LED emission spectrum and absorption cross-sections and quantum yields, scaled to the photolysis frequency of NO2. Seven molecules have a photolysis frequency >0.01 s−1; beside NO2, these are Cl2, NO3, HONO, biacetyl, glyoxal, and ClNO2. In ambient air, abundances of Cl2, NO3, and ClNO2 are generally much lower than those of NO2 and too small to matter in its quantification; the only molecule from which a significant interference can be expected is HONO: at a residence time of 3.5 s, ~40% of this molecule is expected to photodissociate to NO. also lists a few molecules that are present in relatively high abundance such as formaldehyde (HCHO), hydrogen peroxide (H2O2), PAN, and HNO3, but whose photolysis frequencies are negligibly small.
Table 2. Photolysis frequencies calculated from the overlap of the LED emission spectrum with absorption cross-sections and quantum yields, scaled to the photolysis frequency of NO2.
Experimental characterization of artifacts and interferences
Interference from nitric oxide
The NO2 conversion fraction decreases when high concentrations of NO are sampled alongside NO2, because (a) the high background will speed up conversion of NO to NO2 by reaction with O3 in the connecting tubing after photolysis, and (b) some NO will be oxidized to NO2 in the photolysis cell due to the k[Ox] term. Both effects are investigated in the following sections.
Oxidation of NO to NO2 in the connecting tubing
shows an experiment in which the CF of ~21 ppbv NO2 was examined as a function of added NO. The time series demonstrates that the CF (calculated using the right-hand side of EquationEquation (6))(6)
(6) decreased with the amount of NO added. shows the results of box-model simulations (with k[Ox] = 0 s−1) under the conditions of . The simulations predict that CF is a function of NO at the time of observation (gray-shaded area). shows CF as a function of added NO (black circles) and the CF expected from the box model simulations (blue shade). The simulations overestimate the NO yield by 4%, or a factor of ~(j(NO2)+k[Ox])/j(NO2). Once this factor is taken into account (red shade), the simulated conversion fractions agree well with the experimentally determined CF values (). The simulations further predict that this effect scales with the residence time in the connecting tubing, i.e., the inverse of the volumetric flow rate.
Figure 5. (a) Determination of the CF for ~21 ppbv NO2 as a function of NO at 420 Torr and a flow rate of 0.90 slpm. The yellow shaded region indicates times when the converter's LEDs were turned on. (b) CF expected from box model simulations of NO2 photolysis (yellow shaded region) and subsequent oxidation of NO by the O3 generated by NO2 photolysis. In these simulations, k[Ox] was set to 0 s-1. The area shown in gray brackets the time of observation by CRDS. (c) Comparison of experimental (black circles) and expected (shaded) CF. The blue shaded area was derived from the data shown in Figure 5B. The red shaded area was obtained by multiplying the blue shaded area with 0.96 = j(NO2)/(j(NO2)+k[Ox]).
![Figure 5. (a) Determination of the CF for ~21 ppbv NO2 as a function of NO at 420 Torr and a flow rate of 0.90 slpm. The yellow shaded region indicates times when the converter's LEDs were turned on. (b) CF expected from box model simulations of NO2 photolysis (yellow shaded region) and subsequent oxidation of NO by the O3 generated by NO2 photolysis. In these simulations, k[Ox] was set to 0 s-1. The area shown in gray brackets the time of observation by CRDS. (c) Comparison of experimental (black circles) and expected (shaded) CF. The blue shaded area was derived from the data shown in Figure 5B. The red shaded area was obtained by multiplying the blue shaded area with 0.96 = j(NO2)/(j(NO2)+k[Ox]).](/cms/asset/f962e4e4-e9ad-49a1-b044-de20d5583d8e/uawm_a_1769770_f0005_oc.jpg)
Photo-oxidation of NO to NO2 in the photolysis cell
The rate of NO oxidation by the unknown oxidant (k[Ox]) was measured directly by sampling a high mixing ratio of NO at low flow rates and long residence times (> 10 s) while the converter was turned on. A subset of the results is shown in . The amount of NO2 produced scales linearly (r2 > 0.99) with residence time with a slope of 7 × 10⁻⁴ s−1 (scatter plot not shown). This value is three orders of magnitude below that required to justify the CF shown in and the conversion of NO2 to NO (). This suggests that the unknown oxidant is a by-product of NO2 photolysis.
Figure 6. Oxidation of NO to NO2 at very long residence times (shown on top). The converter’s LEDs were on for the entire experiment, while the flow rate was reduced in a step wise fashion to increase the residence time. A constant amount of NO was periodically added to the sampled air and analyzed for its NO2 content. The observed NO2:NO ratio (right-hand side) is rationalized using k[Ox] = 7 ± 10−4 s−1, which is inconsistent with the k[Ox] value derived from eq.
![Figure 6. Oxidation of NO to NO2 at very long residence times (shown on top). The converter’s LEDs were on for the entire experiment, while the flow rate was reduced in a step wise fashion to increase the residence time. A constant amount of NO was periodically added to the sampled air and analyzed for its NO2 content. The observed NO2:NO ratio (right-hand side) is rationalized using k[Ox] = 7 ± 10−4 s−1, which is inconsistent with the k[Ox] value derived from eq.](/cms/asset/6caa5659-468f-4a23-84b7-2301a4ae9c03/uawm_a_1769770_f0006_oc.jpg)
UV-induced artifact
Most photolysis systems exhibit a UV-induced artifact, where a small amount of NO is photochemically produced when sampling NOx-free air. This converter is no exception, and an example is shown in Figure S2. Here, the CRDS sampled dry zero air from 19:41 to 19:49 through the converter, which was turned on from 19:43 to 19:46. The NOx signal increased to ~0.32 ppbv during this time and returned to its baseline as soon as the converter’s LEDs were turned off. The magnitude of the UV-induced artifact was variable and depended on sample history.
Interference from NOz species
There was no interference from IPN (Figure S2). At a converter residence time of ~3.3 s, 60% of HONO and 66% of PAN converted to NO (Figures S2 and S3). We also observed partial conversion (6%) of HNO3 to NO (Figure S5), though this conversion likely occurred via photo-dissociation of surface-adsorbed nitrate.
Discussion
In this work, potential interferences in a new photolytic NO2 converter have been evaluated. The converter is operated near the upper end of the wavelength region with unity NO2 quantum yield. This region is preferred for NO2 conversion since the conversion efficiency (per photon) is high, most of the LED light intensity falls between the absorption spectra of HONO and of the nitrate radical (NO3), and unwanted photolysis of, for example, HNO3, PAN, N2O5, HO2NO2, methyl nitrate (CH3ONO2), and chlorine nitrate (ClONO2) is avoided (Ryerson, Williams, and Fehsenfeld Citation2000).
The key distinguishing feature of this converter is its high CF of up to 96% (). The high CF and large j(NO2) are advantageous as they enable a large linear dynamic range, which is useful for on-stack CEMS, and allow the unit to be operated at low pressures and high flow rates, which is useful for suppression of artifacts and interferences. The artifacts and interferences elucidated and quantified during the photochemical conversion of NO2 to NO in this work likely also occur in other photolytic converters operated in the same wavelength region () to some degree, such as the widely used “blue light converter” (BLC), but are rarely investigated and disclosed, though there are notable exceptions (e.g., the work by Pollack, Lerner, and Ryerson Citation2010). Four distinct mechanisms that generate artifacts and interferences were identified (): direct photolysis, thermal decomposition, surface promoted photochemistry, and secondary chemistry in the connecting tubing. All of these can be remedied to a certain extent by lowering tres.
Table 3. Measurement artifacts. The extent of thermal dissociation was evaluated at temperatures of 75°C (estimated from the extent of PAN dissociation – see S.I.) and 45°C. obs. = observed. pred. = predicted.
Direct photolysis
Perhaps the least surprising of these is the direct interference from the photolysis of HONO to NO. From the overlap of the LED emission spectrum with the absorption spectrum of HONO, we calculated a photolysis frequency of 0.14 s−1; experimentally, a somewhat larger j(HONO) of ~0.25 s−1 was determined. The reason for the larger than predicted j(HONO) is unclear, though it may indicate a slightly higher than measured light intensity at lower wavelengths within the photolysis chamber.
With tres = 3.5 s as tested, a j(HONO) of ~0.25 s−1 implies a HONO to NO conversion rate of ~60%. We calculate that the conversion of HONO to NO is lower at the optimum flow rate (~22%) and could potentially be suppressed to <10% if a 10-fold larger flow rate were used (e.g., by adding a by-pass flow) and if the chamber is operated at a lower pressure yielding a shorter residence time ().
In ambient air, HONO/NO2 ratios are usually largest at night, driven by heterogeneous conversion of NO2 to HONO on surfaces. Actual ratios vary as a complex function of terrain, location, season, and relative humidity, amongst others. For example, Stutz et al. reported HONO/NO2 ratios of ~0.04:1 over grass in Milan, whereas Wojtal et al. reported average ratios of ~0.30:1 with peaks >1:1 in the marine boundary layer off Saturna Island, BC (Stutz, Alicke, and Neftel Citation2002; Wojtal, Halla, and McLaren Citation2011). Such abundances would constitute a significant interference, even at the optimal flow rates and operating pressures.
Interference from HONO has been investigated for other photolytic converters. Inherently, the HONO conversion is less with the 395 nm LEDs than with those at 365 nm (due to the reduced overlap of the HONO absorption cross-section with the emission spectrum); this wavelength is used in the National Oceanic and Atmospheric Administraiton (NOAA) instrument for which the HONO to NO conversion was reported at 37% (Pollack, Lerner, and Ryerson Citation2010). Sadanaga et al. (Citation2010) reported a 28% conversion efficiency in their converter which is of similar magnitude as what we observed at 1 s residence time. More recently, Reed et al. (Citation2016a) described a technique to quantify HONO by differential photolysis using 385 nm and 395 nm LEDs. The latter converted 18% of HONO at a chamber residence time of 0.96 s, a rate that is consistent with what was observed in this work.
Though not experimentally verified, NO3 is also expected to be partially converted to NO2 and NO. The largest NO3 mixing ratios reported are on the order of several 100 pptv, under the rare condition of large NO2 and O3 mixing ratios and small NO3 sinks (Brown and Stutz Citation2012). Furthermore, there are well-documented inlet line transmission issues with NO3 (Fuchs et al. Citation2008), such that it is unlikely that NO3 would constitute a significant interference during the measurement of NO2 in ambient air when measured at a ground site.
Another potential interference is the photolysis of carbonyls such as glyoxal or biacetyl. Photolysis of these molecules produces HOx (= HO + HO2) radicals that can feed into secondary chemistry cycles and reduce the CF (Villena et al. Citation2012). However, the mixing ratios required to achieve measurable effects are usually large (~ ppmv). Though not unrealistic for smog chamber experiments and certain environments such as road tunnels or street canyons, these mixing ratios are well above maximum abundances of glyoxal in ambient air which range from 200 pptv in forests to 1.85 ppbv in Mexico City (Huisman et al. Citation2008; Volkamer et al. Citation2005). Tropospheric abundances of biacetyl are less certain, though an abundance of 90 pptv was recently assumed to rationalize PAN mixing ratios in summertime Beijing, China (Zhang et al. Citation2015). The study by Villena et al. (Citation2012) is the only one which has investigated this chemistry, and more work will be needed to constrain this artifact when quantifying NO2 mixing ratios in ambient air.
Thermal decomposition
We observed positive interference from TD of PAN (Figure S3). This is qualitatively similar to what was observed by Reed et al. (Citation2016b) who reported that their BLC thermally dissociated PAN to NO2 caused by heat given off by their LEDs. There are many environments where PAN concentrations can approach or even exceed those of NO2 (an example is the higher Arctic, Ford et al. Citation2002), such that interference from TD of PAN can be significant. We observed that decomposition of PAN was effectively accelerated by NO, which is partially generated in the converter, titrating the PA radical and preventing its recombination with NO2. At 75°C, the lifetime of PAN with respect to thermal dissociation is ~3.2 s. If a 10× faster flow rate is used (i.e., under optimized conditions when coupled to a CL analyzer), ~10% of PAN is expected to dissociate (), which would constitute a negligible interference under most conditions.
There are other thermally labile components of NOy that can interfere. The most important one is the nocturnal species N2O5, which has been observed in mixing ratios up to 8 ppbv approximately equal to those of NO2 (Brown et al. Citation2016), although its abundance is usually insignificant at surface measurement stations (due to faster loss of NO3 and N2O5 at the surface) and during daytime (Osthoff et al. Citation2017). Its lifetime with respect to TD to NO2 and NO3 at 75°C is ~0.16 s, such that it is expected to efficiently decompose. Clearly, improved internal thermal management of the converter unit is desirable. To demonstrate the benefits of a lower chamber temperature, we calculated expected TD conversion rates for PAN and N2O5 at 45°C (). At this temperature and with a short residence time of 0.35 s, 11% of N2O5 and <1% of PAN are expected to dissociate.
One important consideration is that the photolysis cell in the prototype evaluated was cooled only by air-circulating fans. A relatively straightforward improvement would be the implementation of a thermoelectric cooling, i.e., active cooling to maintain a constant, near-ambient cell temperature.
Role of connecting tubing
A third type of interference results from secondary chemistry in the connecting tubing between the photolytic converter and NO detector. High mixing ratios of NO and, by inference, O3, were shown to negatively interfere (). Possible solutions are either to eliminate the connecting tubing altogether and integrate the photolytic converter as tightly as possible with the detector or to reduce the residence time by increasing the volumetric flow rate, i.e., lowering the operating pressure.
Surface photochemistry
Lastly, positive interference arises from surface photochemistry on the inner walls of the photolysis chamber. A so-called UV-induced offset has been reported for most photolytic converters when sampling NOx-free air (). Our results indicate that wall-adsorbed HNO3 is a likely culprit contributing to this artifact since it was enhanced after sampling HNO3 (Figure S5). Ryerson et al. (Ryerson, Williams, and Fehsenfeld Citation2000) reported that the interference could be reduced by washing the inner walls with liquid water, which is consistent with wall-adsorbed nitrate. In addition, HONO may also play a role in surface-promoted chemistry (Syomin and Finlayson-Pitts Citation2003). When the HONO source was placed inline (or taken offline), we observed fast rise and fall times (e.g., Figure S3) indicating that the adsorption and desorption kinetics of HONO on the inner walls of the photolysis cell were fast, which in turn suggests that wall-adsorbed HONO did not play a significant role.
The HNO3 interference test was particularly intriguing, as it hints at complex secondary chemistry. The temporary loss of NOy in these experiments (Figure S5, 23:01) implies that a component of NOy condensed on the inner surfaces of either the photolysis chamber or connecting tubing. It then appears that this surface passivated or saturated, as the NOy signal recovered. Potential molecules that could fit this behavior are NO3 and N2O5, for which wall losses are well documented and which readily convert to nitrate (Fuchs et al. Citation2008). It is unclear how NO3 would form in the cell (it is not predicted by kinetic model simulations). One potential pathway is reduction of surface-bound nitrate anion by an electron transfer reaction, though this is speculative, and more work would be needed to confirm this.
The ZA offset reported was larger than those reported in other recent converters (), though likely because of the sampling history of the particular converter investigated. A lower offset could have been achieved by washing the cell with deionized water (which was not done) and perhaps by lowering the surface to volume ratio of the photolysis cell.
Mystery oxidant
While EquationEquation (7)(7)
(7) has been used to phenomenologically describe the conversion of NO2 to NO in a photolytic converter, the “unknown” oxidant term, k[Ox], remains an enigma. The data presented in shows that an oxidant of the required magnitude does not exist in the converter per se but is a direct byproduct of NO2 photolysis. A plausible candidate for this oxidant is the hydroperoxyl radical (HO2), which oxidizes NO to NO2,
though it is not known how this molecule would be generated or what other compounds (perhaps excited state oxygen species) are involved.
There has been some speculation that electronically excited NO2 can act as a source of the hydroxyl (HO) and/or the hydroperoxyl radical (HO2), though this topic has remained controversial (Dillon and Crowley Citation2018; Li, Matthews, and Sinha Citation2008). Reactions that have not been fully explored are those between excited state NO2* and H2O:
Our data are not consistent with reaction (11) since we did not observe an RH dependence and the NOx budget is closed (), leaving no room for HONO production.
Any photolytic converter that is operated with ambient air would likely quickly build up an internal surface covered with some water and nitrate. A surface effect would be consistent with the variability of reported k[Ox] between photolysis cells (). On the other hand, a wall-driven process would have a finite oxidation capacity and likely not scale with NOx concentration as observed in . Clearly, more work is needed to identify the process or processes behind the k[Ox] phenomenon.
Outlook
This work has improved the understanding of interferences in photolytic converters. The high CF exhibited by this prototype, which is higher than other photolytic converters described to date (), allows the converter to be operated at low pressure and high flow rate to minimize interferences as well as to function when sampling high NO2 concentrations such as in stack emissions. Current efforts in our laboratories are focused on the construction of a device with improved thermal management and reduced photolytic conversion of HONO.
Supplemental Material
Download MS Word (1.1 MB)Disclosure statement
No potential conflict of interest was reported by the authors.
Supplementary material
Supplemental data for this article can be accessed on the publisher’s website.
Additional information
Funding
References
- Brown, S. S., W. P. Dubé, Y. J. Tham, Q. Zha, L. Xue, S. Poon, Z. Wang, D. R. Blake, W. Tsui, D. D. Parrish, et al. 2016. Nighttime chemistry at a high altitude site above Hong Kong. J. Geophys. Res.-Atmos. 121 (5):2457–75. doi:10.1002/2015JD024566.
- Brown, S. S., and J. Stutz. 2012. Nighttime radical observations and chemistry. Chem. Soc. Rev. 41 (19):6405–47.
- Burkholder, J. B., S. P. Sander, J. P. D. Abbatt, J. R. Barker, R. E. Huie, C. E. Kolb, M. J. Kurylo, V. L. Orkin, D. M. Wilmouth, and P. H. Wine. 2015. Chemical kinetics and photochemical data for use in atmospheric studies, evaluation number 18. Pasadena: National Aeronautics and Space Administration, Jet Propulsion Laboratory, California Institute of Technology.
- Clough, P. N., and B. A. Thrush. 1966. Mechanism of chemiluminescent reaction between ntiric oxide and ozone. Chem. Commun. (21):783–84. doi:10.1039/C19660000783
- Dillon, T. J., and J. N. Crowley. 2018. Reactive quenching of electronically excited NO2* and NO3* by H2O as potential sources of atmospheric HOx radical. Atmos. Chem. Phys. 18 (19):14005–15. doi:10.5194/acp-18-14005-2018.
- Dunlea, E. J., S. C. Herndon, D. D. Nelson, R. M. Volkamer, F. San Martini, P. M. Sheehy, M. S. Zahniser, J. H. Shorter, J. C. Wormhoudt, B. K. Lamb, et al. 2007. Evaluation of nitrogen dioxide chemiluminescence monitors in a polluted urban environment. Atmos. Chem. Phys. 7 (10):2691–704. doi:10.5194/acp-7-2691-2007.
- Fehsenfeld, F. C., R. R. Dickerson, G. Hübler, W. T. Luke, L. J. Nunnermacker, E. J. Williams, J. M. Roberts, J. G. Calvert, C. M. Curran, A. C. Delany, et al. 1987. A ground-based intercomparison of NO, NOx, and NOy measurement techniques. J. Geophys. Res.-Atmos. 92 (D12):14710–22. doi:10.1029/JD092iD12p14710.
- Fehsenfeld, F. C., J. W. Drummond, U. K. Roychowdhury, P. J. Galvin, E. J. Williams, M. Buhr, P. Parrish, D. D. Hübler, G. Langford, A. O. Calvert, et al. 1990. Intercomparison of NO2 measurement techniques. J. Geophys. Res.-Atmos. 95 (D4):3579–97. doi:10.1029/JD095iD04p03579.
- Fontijn, A., A. J. Sabadell, and R. J. Ronco. 1970. Homogeneous chemiluminescent measurement of nitric oxide with ozone. Implications for continuous selective monitoring of gaseous air pollutants. Anal. Chem. 42 (6):575–79. doi:10.1021/ac60288a034.
- Ford, K. M., B. M. Campbell, P. B. Shepson, S. B. Bertman, R. E. Honrath, M. Peterson, and J. E. Dibb. 2002. Studies of Peroxyacetyl nitrate (PAN) and its interaction with the snowpack at Summit, Greenland. J. Geophys. Res. 107 (D10):4102. doi:10.1029/2001JD000547.
- Frost, G. J., S. A. McKeen, M. Trainer, T. B. Ryerson, J. A. Neuman, J. M. Roberts, A. Swanson, J. S. Holloway, D. T. Sueper, T. Fortin, et al. 2006. Effects of changing power plant NOx emissions on ozone in the eastern United States: Proof of concept. J. Geophys. Res.-Atmos. 111 (D12):D12306. doi:10.1029/2005JD006354.
- Fuchs, H., S. M. Ball, B. Bohn, T. Brauers, R. C. Cohen, H. P. Dorn, W. P. Dubé, J. L. Fry, R. Häseler, U. Heitmann, et al. 2010. Intercomparison of measurements of NO2 concentrations in the atmosphere simulation chamber SAPHIR during the NO3Comp campaign. Atmos. Meas. Tech. 3 (1):21–37. doi:10.5194/amt-3-21-2010.
- Fuchs, H., W. P. Dubé, S. J. Cicioira, and S. S. Brown. 2008. Determination of inlet transmission and conversion efficiencies for in situ measurements of the nocturnal nitrogen oxides, NO3, N2O5 and NO2, via pulsed cavity ring-down spectroscopy. Anal. Chem. 80 (15):6010–17. doi:10.1021/ac8007253.
- Fuchs, H., W. P. Dubé, B. M. Lerner, N. L. Wagner, E. J. Williams, and S. S. Brown. 2009. A sensitive and versatile detector for atmospheric NO2 and NOx based on blue diode laser cavity ring-down spectroscopy. Environm. Sci. Technol. 43 (20):7831–36. doi:10.1021/es902067h.
- Gluck, S., C. Glenn, T. Logan, B. Vu, M. Walsh, and P. Williams. 2003. Evaluation of NOx flue gas analyzers for accuracy and their applicability for low-concentration measurements. J. Air Waste Manag. Assoc. 53 (6):749–58. doi:10.1080/10473289.2003.10466208.
- Huisman, A. J., J. R. Hottle, K. L. Coens, J. P. DiGangi, M. M. Galloway, A. Kammrath, and F. N. Keutsch. 2008. Laser-induced phosphorescence for the in situ detection of glyoxal at part per trillion mixing ratios. Anal. Chem. 80 (15):5884–91. doi:10.1021/ac800407b.
- Jahnke, J. A. 2000. Continuous emission monitoring. 2nd ed. New York: John Wiley & Sons.
- Jeansonne, M. S., and J. P. Foley. 1991. Review of the exponentially modified Gaussia (EMG) function since 1983. J. Chromatogr. Sci. 29 (6):258–66. doi:10.1093/chromsci/29.6.258.
- Jordan, N., and H. D. Osthoff. 2020. Quantification of nitrous acid (HONO) and nitrogen dioxide (NO2) in ambient air by broadband cavity-enhanced absorption spectroscopy (IBBCEAS) between 361 and 388 nm. Atmos. Meas. Tech. 13 (1):273–85. doi:10.5194/amt-13-273-2020.
- Kley, D., and M. McFarland. 1980. Chemiluminescence detector for NO and NO2. Atmos. Technol. 12:63–69.
- Li, S., J. Matthews, and A. Sinha. 2008. Atmospheric hydroxyl radical production from electronically excited NO2 and H2O. Science 319 (5870):1657–60. doi:10.1126/science.1151443.
- Meng, Z., D. Dabdub, and J. H. Seinfeld. 1997. Chemical coupling between atmospheric ozone and particulate matter. Science 277 (5322):116–19. doi:10.1126/science.277.5322.116.
- Odame-Ankrah, C. A. 2015. Improved detection instrument for nitrogen oxide species. Calgary: University of Calgary. http://hdl.handle.net/11023/2006.
- Odame-Ankrah, C. A., and H. D. Osthoff. 2011. A compact diode laser cavity ring-down spectrometer for atmospheric measurements of NO3 and N2O5 with automated zeroing and calibration. Appl. Spectrosc. 65 (11):1260–68. doi:10.1366/11-06384.
- Odame-Ankrah, C. A., and B. W. Rosentreter Photolytic converter, patent WO2017173552. WO2017/173552, 2017.
- Osthoff, H. D., C. A. Odame-Ankrah, Y. M. Taha, T. W. Tokarek, C. L. Schiller, D. Haga, K. Jones, and R. Vingarzan. 2017. Low levels of nitryl chloride at ground level: Nocturnal nitrogen oxides in the Lower Fraser Valley of British Columbia. Atmos. Chem. Phys. 18 (9):6293–315. doi:10.5194/acp-18-6293-2018.
- Paul, D., A. Furgeson, and H. D. Osthoff. 2009. Measurements of total peroxy and alkyl nitrate abundances in laboratory-generated gas samples by thermal dissociation cavity ring-down spectroscopy. Rev. Sci. Instrum. 80 (11):114101. doi:10.1063/1.3258204.
- Paul, D., and H. D. Osthoff. 2010. Absolute measurements of total peroxy nitrate mixing ratios by thermal dissociation blue diode laser cavity ring-down spectroscopy. Anal. Chem. 82 (15):6695–703. doi:10.1021/ac101441z.
- Penkett, S. A., S. Gilge, C. Plass-Duelmer, I. E. Galbally, N. Brough, J. W. Bottenheim, F. Flocke, H. Gerwig, J. Lee, M. Milton, et al. 2011. WMO/GAW expert workshop on global long-term measurements of nitrogen oxides and recommendations for GAW nitrogen oxides network, 195. Hohenpeissenberg: World Meteorological Organization.
- Pollack, I., B. Lerner, and T. Ryerson. 2010. Evaluation of ultraviolet light-emitting diodes for detection of atmospheric NO2 by photolysis - chemiluminescence. J. Atmos. Chem. 65 (2):111–25. doi:10.1007/s10874-011-9184-3.
- Reed, C., C. A. Brumby, L. R. Crilley, L. J. Kramer, W. J. Bloss, P. W. Seakins, J. D. Lee, and L. J. Carpenter. 2016a. HONO measurement by differential photolysis. Atmos. Meas. Tech. 9 (6):2483–95. doi:10.5194/amt-9-2483-2016.
- Reed, C., M. J. Evans, P. Di Carlo, J. D. Lee, and L. J. Carpenter. 2016b. Interferences in photolytic NO2 measurements: Explanation for an apparent missing oxidant? Atmos. Chem. Phys. 16 (7):4707–24. doi:10.5194/acp-16-4707-2016.
- Ryerson, T. B., E. J. Williams, and F. C. Fehsenfeld. 2000. An efficient photolysis system for fast-response NO2 measurements. J. Geophys. Res. 105 (D21):26447–61. doi:10.1029/2000JD900389.
- Sadanaga, Y., Y. Fukumori, T. Kobashi, M. Nagata, N. Takenaka, and H. Bandow. 2010. Development of a selective light-emitting diode photolytic NO2 converter for continuously measuring NO2 in the atmosphere. Anal. Chem. 82 (22):9234–39. doi:10.1021/ac101703z.
- Steinbacher, M., C. Zellweger, B. Schwarzenbach, S. Bugmann, B. Buchmann, C. Ordóñez, A. S. H. Prevot, and C. Hueglin. 2007. Nitrogen oxide measurements at rural sites in Switzerland: Bias of conventional measurement techniques. J. Geophys. Res.-Atmos. 112 (D11):D11307. doi:10.1029/2006JD007971.
- Stutz, J., B. Alicke, and A. Neftel. 2002. Nitrous acid formation in the urban atmosphere: Gradient measurements of NO2 and HONO over grass in Milan, Italy. J. Geophys. Res.-Atmos. 107 (D22):LOP 5-1-LOP 5–15. doi:10.1029/2001JD000390.
- Syomin, D. A., and B. J. Finlayson-Pitts. 2003. HONO decomposition on borosilicate glass surfaces: Implications for environmental chamber studies and field experiments. Phys. Chem. Chem. Phys. 5 (23):5236–42. doi:10.1039/b309851f.
- Taha, Y. M., C. A. Odame-Ankrah, and H. D. Osthoff. 2013. Real-time vapor detection of nitroaromatic explosives by catalytic thermal dissociation blue diode laser cavity ring-down spectroscopy. Chem. Phys. Lett. 582:15–20. doi:10.1016/j.cplett.2013.07.040.
- Villena, G., I. Bejan, R. Kurtenbach, P. Wiesen, and J. Kleffmann. 2012. Interferences of commercial NO2 instruments in the urban atmosphere and in a smog chamber. Atmos. Meas. Tech. 5 (1):149–59. doi:10.5194/amt-5-149-2012.
- Voigt, S., J. Orphal, and J. P. Burrows. 2002. The temperature and pressure dependence of the absorption cross-sections of NO2 in the 250–800 nm region measured by fourier-transform spectroscopy. J. Photochem. Photobiol. A-Chem. 149 (1–3):1–7. doi:10.1016/S1010-6030(01)00650-5.
- Volkamer, R., L. T. Molina, M. J. Molina, T. Shirley, and W. H. Brune. 2005. DOAS measurement of glyoxal as an indicator for fast VOC chemistry in urban air. Geophys. Res. Lett. 32 (8):L08806. doi:10.1029/2005GL022616.
- Wild, R. J., P. M. Edwards, W. P. Dube, K. Baumann, E. S. Edgerton, P. K. Quinn, J. M. Roberts, A. W. Rollins, P. R. Veres, C. Warneke, et al. 2014. A measurement of total reactive nitrogen, NOy, together with NO2, NO, and O3 via cavity ring-down spectroscopy. Environm. Sci. Technol. 48 (16):9609–15. doi:10.1021/es501896w.
- Williams, E. J., K. Baumann, J. M. Roberts, S. B. Bertman, R. B. Norton, F. C. Fehsenfeld, S. R. Springston, L. J. Nunnermacker, L. Newman, K. Olszyna, et al. 1998. Intercomparison of ground-based NOy measurement techniques. J. Geophys. Res. 103 (D17):22261–80. doi:10.1029/98JD00074.
- Winer, A. M., J. W. Peters, J. P. Smith, and J. N. Pitts. 1974. Response of commercial chemiluminescent NO-NO2 analyzers to other nitrogen-containing compounds. Environm. Sci. Technol. 8 (13):1118–21. doi:10.1021/es60098a004.
- Wojtal, P., J. D. Halla, and R. McLaren. 2011. Pseudo steady states of HONO measured in the nocturnal marine boundary layer: A conceptual model for HONO formation on aqueous surfaces. Atmos. Chem. Phys. 11 (7):3243–61. doi:10.5194/acp-11-3243-2011.
- Zhang, G., Y. J. Mu, L. X. Zhou, C. L. Zhang, Y. Y. Zhang, J. F. Liu, S. X. Fang, and B. Yao. 2015. Summertime distributions of peroxyacetyl nitrate (PAN) and peroxypropionyl nitrate (PPN) in Beijing: Understanding the sources and major sink of PAN. Atmos. Environm. 103:289–96. doi:10.1016/j.atmosenv.2014.12.035.