
 ?Mathematical formulae have been encoded as MathML and are displayed in this HTML version using MathJax in order to improve their display. Uncheck the box to turn MathJax off. This feature requires Javascript. Click on a formula to zoom.
ABSTRACT
Particulate matter (PM) pollution is associated with adverse effects on human health and the environment. There is no designated PM2.5 emission factor for horizontal grain conveyors. Instead, in Washington state, the air permitting agency uses an emission factor for headhouse and grain handling operations to issue permits. There is concern that this factor does not accurately represent the conveyor operations and limits the size and operation of wheat pile facilities. The primary goal of this work was to estimate the PM2.5 emission rate (which can further be converted to an emission factor) from wheat conveying operations at a large wheat pile storage facility in eastern Washington using an atmospheric tracer ratio method, with CO2 gas as the tracer. The field study results yield an emission rate of 5.21.7 grams of PM2.5 per hour and these emissions are due to the transfer point from an upper belt to a lower belt. This rate is approximately 320 times lower than the emission rate for headhouse operations which has been used previously to represent conveyor operations. The emission rate was in relatively good agreement with results of an inverse Gaussian plume model calculation of emissions using measured ambient PM2.5 levels at a very short distance downwind of the transfer point. A consistent PM2.5 to tracer gas ratio over the tests showed that PM2.5 and CO2 disperse in a similar manner and confirmed that the CO2 tracer release was a reliable simulation of the PM2.5 pollutant source over distances involved in the study (less than 10 meters). The results also indicate a need for the Environmental Protection Agency to develop a designated PM2.5 emission factor for wheat conveyance.
Implications
There are presently no emission factors available for large wheat pile storage facilities where wheat is transferred via long horizontal conveyor belts. As a result, local and state permitting agencies use emission factors for other types of grain handling systems. In this paper, we report the first measurements of PM2.5 emission rates (that can further be converted to emission factors using a known grain rate on the conveyor) for horizontal grain conveyors used at wheat pile storage facilities. The measured emission rate is much less than the emission rate derived from the surrogate emission factor currently used for permit purposes. This has implications for the size and operation of wheat pile storage facilities.
Introduction
Particulate matter (PM), also known as particulate pollution, refers to a mixture of solids and liquid droplets suspended in the air and is one of the “six criteria” air pollutants (U.S. EPA Citation2018a). Particulate size and chemical composition have shown a strong correlation with negative health and environmental effects. Over the last several decades, numerous health studies have linked PM exposure to both short-term (hospital visits, premature mortality) and long-term (morbidity, lung cancer, cardiovascular and cardiopulmonary diseases) health effects. It has been shown that inflammatory injury, oxidative damage and other biological effects are stronger for fine (diameters of < 2.5 μm, PM2.5) and ultrafine (diameters of < 0.1 μm, PM0.1) particles since they can penetrate deeper into the respiratory tract, reach the alveoli and be retained in the lung parenchyma (Valavanidis, Fiotakis, and Vlachogianni Citation2008).
In the Inland Pacific Northwest, there are large expanses of wheat production and there are many grain elevators and wheat pile storage facilities. Grain elevators are facilities where grains (e.g., wheat, corn, oats, rice, soybean, and sorghum) are received, stored and later distributed (U.S. EPA Citation1995). PM is a primary air pollutant at grain elevators (Mclouth and Paulus Citation1961). Depending on the type of the operation (e.g., unloading, loading, cleaning, storing, sizing, etc.), there can be several factors that contribute to grain dust generation (U.S. EPA Citation1995). They include (but are not limited to): wind speed and direction, dust generation when a falling grain stream hits the receiving pit (unloading) or the truck or railcar hopper (loading), and belt speed at transfer points (discharge points from one conveyor belt onto another) (U.S. EPA Citation1995). The document “Compilation of Air Pollutant Emissions Factors” (AP-42) (U.S. EPA Citation1995) developed by the Environmental Protection Agency (EPA) presents emission factors (EF) from grain elevators as well as general information on the grain processing plants.
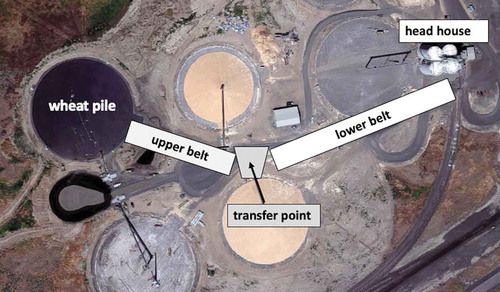
Wheat pile storage facilities include outdoor grain storage piles, a conveyor belt and a headhouse (). During harvest, grain arrives in trucks and is transferred to large outdoor piles for storage. The piles are covered with tarps for the winter and then in the spring, wheat is transferred to train cars. During pile unloading, grain is transferred by a front-end loader from the pile onto an open belt conveyor through a choke-flow hopper and conveyed to the headhouse. The conveyor has one or more transfer points where the wheat is dropped from an upper belt to a lower conveyor belt causing particle dust generation. From the headhouse the grain is loaded onto rail cars for further transportation. The loading of grain onto the belt conveyor and the transfer points are the main sources of PM during the transfer process. Since emission rates from choke-flow hoppers are well established, this work focuses on PM emissions from the wheat conveyance.
Figure 1. Aerial view of a large wheat pile storage facility (upper belt ~70 m long, lower belt ~100 m long).
Currently there are no designated EFs for grain conveyance emissions. Due to this absence, the Washington Department of Ecology presently employs an EF listed in the AP-42 under “Headhouse and grain handling” (the EF for PM2.5 is 0.0058 lb/ton) for emissions estimates for permitting purposes at wheat pile storage facilities. These factors are suspected to overestimate the actual PM emissions from grain conveyance. The objective of this work was to estimate PM2.5 emission rates from wheat conveyance at the conveyor transfer point at a grain elevator using an atmospheric tracer ratio method and compare these rates with the rates obtained from the EFs presented in the AP-42 (with a known grain transfer rate on the conveyor) and currently used by state and local environmental regulatory agencies. In addition, the estimated emission rates were compared with the emission rates obtained with an inverse Gaussian plume model.
Atmospheric tracer techniques have been widely used in a number of studies and were shown to be a powerful tool to estimate atmospheric emissions of both gaseous and particulate sources (Claiborn et al. Citation1995; Lamb et al. Citation2015). Sulfur hexafluoride (SF6) has been utilized as a tracer gas in many studies (Claiborn et al. Citation1995; Czepiel et al. Citation1996; Kantamaneni et al. Citation1996; Lamb et al. Citation2015, Citation1995) although nitrous oxide and acetylene have been used in more recent studies mainly focused on emissions from oil and gas facilities (Mitchell et al. Citation2015; Omara et al. Citation2016). Application of tracer techniques to emission rate estimation of atmospheric gases has been well studied and reported. The method has been applied to estimate gas emissions from line (Czepiel et al. Citation1996), point and area (Lamb et al. Citation1995) sources using both stationary (for example, Mollmann-Coers et al. Citation2002; Scholtens et al. Citation2004) and mobile (for example, CitationDaube et al. 2019; Foster-Wittig et al. Citation2015; Lamb et al. Citation1995) measurements. Claiborn et al. (Citation1995) were first to introduce the atmospheric tracer method to measure PM emissions (Kantamaneni et al. Citation1996). In their study SF6 was used as a tracer gas to simulate PM10 emissions from paved and unpaved roads. Both line source and point source tracer release experiments were performed.
The tracer ratio method has a number of advantages. The technique does not require meteorological measurements and does not involve dispersion modeling, as long as the tracer is released in a manner that closely simulates the source. The method also provides a built-in quality control check: if the pollutant/tracer ratios among several downwind tests with collocated samplers are consistent, then the pollutant and the tracer disperse in a similar manner so that the tracer release is a reliable simulation of the pollutant source, and there are no interfering sources (Lamb et al. Citation1995).
Experimental methods
Emission factors and emission rates
EFs have been used to develop emission inventories on national, state, regional and local levels as well as to design emission control strategies (U.S. EPA Citation2018b). Regulatory compliance of a source, area-wide dispersion modeling, as well as permitting, also call for the application of EFs (RTI International Citation2003). The EPA defines the emission factor as “a representative value that attempts to relate the quantity of a pollutant released to the atmosphere with an activity associated with the release of that pollutant.” As such emission factors are derived from a sufficient number of studies as to develop representative values. Because the work presented here is only the first such study of emissions from horizontal conveyors operations, we refrain from presenting the results as a definitive emissions factor. Emission factor differs from emission rate in a way that “emission rate” is an amount of a pollutant emitted per time (i.e. lb/hr), whereas “emission factor” is a quantity of a pollutant produced per “activity” (e.g, g/VKT = grams of pollutant emitted per vehicle traveled per kilometer, where “vehicle traveled per kilometer” is an activity). In this work the PM2.5 emission rate (g/hr) was obtained with the tracer ratio technique. For comparison purposes, the PM2.5 emission factor (lb/ton – pounds of dust generated per ton of wheat conveyed) presented in the AP-42 was converted to an emission rate using the average grain unloading conveyance rate (reported by the operators as 650 ton/hr).
Tracer ratio method
When the tracer ratio method is applied to estimation of PM emissions, the technique involves simulating a PM emission source with a tracer gas release at a known rate, measuring the PM and the tracer gas concentrations both upwind and downwind, and calculating the PM emission rate (QPM) from the PM/tracer concentrations ratio with the equation:
where and
are the “net” (above the background) PM and tracer concentrations, respectively, and
is the measured tracer release rate.
The PM/tracer ratio can be obtained using a number of methods. However, one approach has proven its effectiveness over other methods. This technique involves integration over the PM and the tracer concentrations (above background) separately and then finding the PM/tracer ratio of the integrals. This approach eliminates issues with matching the delay and response times of the PM and the tracer samplers. In addition, it reduces the errors related to offsets in the tracer release position relative to the PM source. Accumulated sums of PM and the tracer can be used as an approximation of the integrals to simplify PM/tracer ratio calculations (Lamb et al. Citation2015, Citation1995). In this case, the PM emission rate can be found using the formula:
where and
are the accumulated sums of the “net” PM and tracer concentrations, respectively.
Dispersion modeling
Air quality dispersion models use meteorological parameters at an emission source and pollutant emission rates to simulate horizontal and vertical atmospheric dispersion of the contaminant to calculate its concentration at some downwind distance from the source. These models are widely used by regulatory agencies to identify source contributions and design effective control strategies (U.S. EPA Citation2018c). Currently the US EPA (U.S. EPA Citation2018d) lists five refined computer dispersion models that are acceptable to be utilized in revisions of State Implementation Plans for existing sources and for New Source Review and Prevention of Significant Deterioration programs. All of these models are based on the Gaussian dispersion model or its variations. The general form of the Gaussian plume equation is described as (Abdel-Rahman Citation2008):
where is the pollutant concentration, Q is the emission rate of the pollutant emitted from the source, u is the wind speed in the direction x, y is the horizontal distance from plume centerline perpendicular to the wind direction, z is the vertical distance from ground level, H is the effective stack height, and σy and σz are the dispersion coefficients in y and z directions respectively.
Pasquill-Gifford dispersion coefficients are strong functions of atmospheric stability and downwind distance and are commonly used in the Gaussian plume model applications. The coefficients were developed based on the measurements taken in open rural areas and were made over 10-minute periods (Abdel-Rahman Citation2008; Cooper and Alley Citation2011). Due to these limitations it is often recommended to use on-site turbulence measurements. For near-source estimates, this involves application of the Taylor dispersion coefficients that are functions of wind velocity fluctuations and downwind transport time (or distance) (Arya Citation1999):
where and
are the standard deviations of the measured horizontal and vertical wind speed components in m/s that can be readily obtained from the site windspeed measurements, and t is the transport time in seconds, and is calculated as
.
In a study of instantaneous plume dispersion, Peterson and Lamb (Citation1992) proposed dispersion coefficients that represented a form of Taylor diffusion adjusted for instantaneous plume behavior in the near field:
where x is the downwind distance in m.
For the work presented here, Equationequations 6(6)
(6) and Equation7
(7)
(7) were used in the standard Gaussian plume equation for inverse modeling estimates of PM2.5 emission rates.
In the use of the Gaussian plume model the following assumptions were made: (1) the receptors are located on the centerline, such that the horizontal distance from the plume centerline perpendicular to the wind direction is zero (y = 0); and (2) maximum pollutant concentration (calculated as 99th percentile of the concentration values distribution over a test) corresponds to the centerline concentration. With the stated assumptions, the emission rate using the Gaussian plume model was found with the equation:
The inverse dispersion model used here is very similar to the EPA Method33a approach (Brantley et al. Citation2014). The only difference is that in the model used here, on-site turbulence data were used to calculate the dispersion coefficients while in Method33a, turbulence and wind data are used to estimate the atmospheric stability class and then Pasquill-Gifford dispersion coefficients are used, based on the estimated stability class. In related, unpublished work, we have found that using the on-site turbulence data directly to obtain the dispersion coefficients significantly improves the overall performance of the inverse model.
Experimental setup and site description
Stationary point tracer release experiments along with PM sampling were conducted on 06/22/2018 at the wheat pile facility located in eastern Washington from 11:30 am to 2:00 pm () during a normal wheat storage pile unloading. The facility includes outside grain storage piles, a conveyor belt and a headhouse and follows general operations described in the Introduction section. It is important to note here that grain arrives to the facility in trucks during the fall harvest. The railroad was located approximately 800 feet away from the conveyor and during the study period, the locomotive was even further away. As a result, there were no nearby interfering CO2 sources from either trucks or the train.
Figure 2. Tracer release schematic.
In recent years the wheat storage facility has undergone a series of extensions and currently has five outdoor grain storage piles. The Washington State Department of Ecology grants air emission permits for the facility. Presently, two piles have a throughput of 2.1 million bushels of grain per pile, and three piles have a capacity of 1.4 million bushels per pile. All five existing outdoor grain storage piles are handled in the same way: grain is conveyed to a center baffled pipe for pile generation and covered once built with geo-membrane tarps. The facility’s total grain throughput is 36 million bushels per year. The facility uses a baghouse and mineral oil to control PM emissions from grain handling.
The average wind speed over the sampling period was 2.7 m/s. The sky was clear and sunny. The average temperature was 29°C (302 K). The average atmospheric pressure was 0.95 atm. The average humidity was around 30%. The prevailing wind direction was from south by southwest (SSW). The pile unloading grain rate on the conveyor was 650 ton/hr and the dust plume was continuous. Moisture content of the grain was 10%.
A tank with pure CO2 gas was located near the conveyor’s transfer point, and the CO2 release tubing was collocated with the PM emission source as closely as possible at approximately 1.2 m from the ground. The tracer was released at a constant rate of 35 slpm and controlled by a gas mass flow controller (MCR series, Alicat Scientific). The pollutant and the tracer gas concentrations were monitored upwind and downwind of the emission source using identical PM2.5 (DustTrak II model 8530, TSI Inc.) and CO2 (LI-850A CO2/H2O gas analyzer, LI-COR Inc.) sensors. The DustTrak II is a light-scattering laser photometer that determines particle mass by measuring the light scattered by the particles. The LI-850A is a non-dispersive infrared (NDIR) gas analyzer that uses absorptive properties of a gas to determine its concentration. For both the upwind and downwind sampling locations, the inlet tubing for each analyzer were collocated at approximately 1 m above the ground. The upwind setup was located approximately 20 m from the source and also included a sonic anemometer (CSAT3B 3-D Sonic Anemometer, Campbell Scientific, Inc.) to monitor wind speed, direction and turbulence. Meteorological parameters were not required in the tracer ratio method calculations but were measured for use in the Gaussian plume model calculations. Since only one set of a PM sampler and a CO2 analyzer was available for downwind experiments, measurements were performed by moving the setup at different locations downwind from the emission source (5.7 m, 6.4 m and 10.4 m downwind, see ). The 10.4 m distance was chosen as the end point for measurements for two reasons. First, there was no dust visually transported past this distance. Second, tracer concentrations were not detectable above background levels beyond this point. The downwind setup also included a weather station (AIRMAR WeatherStation 150WX, Airmar Technology Corp.) positioned at a height of approximately 1.3 m to measure meteorological parameters. Two identical data loggers (NL115, Campbell Scientific, Inc.) were used on upwind and downwind sides to record measurements from all the instruments at 10 Hz frequency. Measurements from four sequential 15-min tests were obtained at 5.7 m. One 15-min test was performed each at the 6.4 m and 10.4 m locations. The PM2.5 analyzers were zero spanned three times during the upwind experiments and after each 15-min test during downwind measurements. The upwind setup was powered by the facility’s on-site power source, the downwind setup was powered by a generator located about 10 m downwind from the furthest measurement point so that the generator exhaust would not be an interfering source for the tracer measurements.
There were two major constraints associated with the use of CO2 as a tracer gas that were addressed during the experiments. The first was the presence of other CO2 sources (such as breathing and vehicle or power generator exhausts) in the vicinity of the experimental setup. The second was the difficulty of achieving a detectable concentration above background downwind from the source, since CO2 is abundant in the atmosphere. The tracer ratio method is sensitive to interfering sources, and therefore, the experiments were conducted with care to avoid their introduction: no vehicles were operated in proximity to the tests, the power generator was positioned 10 m downwind from the experimental setup, no grain unloading from trucks occurred during the tests, and precautions were made to avoid breathing next to the CO2 analyzer. The average CO2 concentration measured at 10 m from the release point was 415 ppm, which was approximately 18 ppm above the background level and was acceptable for the use in the tracer ratio method.
Results
provides estimated average PM2.5 emission rates during six tests as well as some basic statistics on obtained data for each test.
Table 1. Estimated average PM2.5 emission rates during six tests.
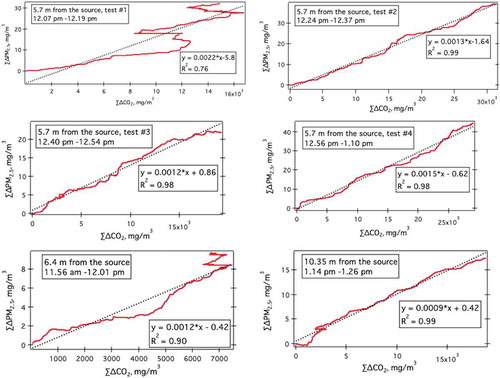
Results from six test periods are summarized in which shows PM2.5/CO2 ratio plots obtained with the accumulated sums approach. ΔPM2.5 and ΔCO2 in the graphs indicate “net” PM2.5 and CO2 concentrations. ΣΔPM2.5 and ΣΔCO2 denote accumulated PM2.5 and CO2 concentrations (approximation of integration) over the test. The slopes of the resulting regression lines (ΣΔPM2.5 versus ΣΔCO2) represent PM2.5/CO2 ratios. The estimated minimum and maximum PM2.5/CO2 ratios over the tests were 0.001 and 0.002, respectively, with an average ratio of 0.00140.0004 (with coefficient of variation of 29%). The average background PM2.5 and CO2 concentrations during the testing period were 0.005 ± 0.002 mg/m3 and 396 ± 5 ppm, respectively.
Figure 3. PM2.5/CO2 ratio plots. “accumulated sums” method.
shows the estimated PM2.5 emission rates and emission factors for grain conveyance obtained with the tracer ratio method and the inverse Gaussian plume model. The table also includes the PM2.5 EF (and the derived emission rate) referenced in AP-42 and currently used for permit purposes for northwestern wheat pile facility operations.
Table 2. Estimated PM2.5 emission rates and emission factors for grain conveyance.
The precision of the PM and CO2 analyzers used in the tracer experiments was verified by collocating the samplers and exposing them to the same PM2.5 and CO2 concentrations, respectively. The estimated mean bias for the particle analyzer was 0.0092 mg/m3. With the average concentration of 0.024 mg/m3 measured by the analyzers during a 5-minute test, the estimated uncertainty of the PM2.5 measurements was 38%. The mean bias between the measurements taken by the two CO2 analyzers was 4 ppm. With the average concentration of 402 ppm measured by the analyzers during a 1-hour test, the estimated uncertainty of the CO2 measurements was 1%. The estimated biases were used as correction factors to adjust PM2.5 and CO2 concentrations measured during tracer release experiments.
Error propagation was used to calculate uncertainty of the tracer ratio method in estimation of PM2.5 emission rate. The uncertainty of the method included uncertainties associated with the dust and the tracer measurements (found as precisions of the PM2.5 and CO2 instruments – 38% and 1%, respectively), accuracy of the mass flow controller (1%), and the absolute uncertainty of the PM analyzer (26%, found from a study that compared continuous DustTrak measurements with the integrated concentrations measured by filter-based samplers (Gertler et al. Citation2006)). The resulting uncertainty was 46%.
Discussion
The PM2.5/CO2 ratio plots obtained with the accumulated sums technique are presented in . They offer a good visual presentation of the correlation between pollutant and tracer concentrations. Average R-squared (R2) of the regression lines was 0.930.09. Results from the first test (12.07 pm – 12.19 pm) showed the highest variation (R2 = 0.76, PM2.5/CO2 ratio = 0.0022). A possible reason for that could be a change in PM concentration during the experiment (i.e., perhaps resulting from a change in the unloading grain rate on the conveyor or variation in the wind speed). A shorter duration of the 6.4 m test (5 min) could contribute to a lower R2 (0.90). However, a high average R2 over the tests indicates a strong correlation between PM2.5 and CO2 concentrations. A consistent PM2.5/tracer ratio over the tests supports the assumptions that PM2.5 and CO2 disperse in a similar manner, that the CO2 tracer release was a reliable simulation of the PM2.5 pollutant source over a 10-meter distance, and that there were no interfering sources present during the experiments. Coefficient of variation was 29% which shows a relatively narrow extent of variability in the estimated PM2.5/CO2 ratios.
The PM2.5 emission rate estimated with the dispersion model utilizing the corrected dispersion coefficients of the Taylor’s one-particle diffusion parameter was 3.21.4 g/hr which was within a factor of 2 of the emission rate estimated by the tracer ratio method (). Application of the Taylor diffusion parameters corrected by Peterson and Lamb for short term and near source conditions (instead of Pasquill-Gifford dispersion coefficients) is expected to improve the accuracy of the model. However, the model involves other assumptions (such as emission is continuous, pollutant does not diffuse in the direction of travel, pollutant has a negligible deposition rate, steady-state conditions apply, wind speed and wind direction are constant with time and elevation) that impose further limitations. At this time, there are no available data that would allow to evaluate the obtained estimations.
The emission rate derived from the EF currently used for permit purposes to describe PM2.5 emissions from grain conveyance was more than 320 times higher than the emission rate estimated with the tracer ratio method. The AP-42 EF was developed for headhouse and grain handling emissions and is used to estimate emissions at the conveyor transfer point in the absence of a designated EF for grain conveyance. There are other factors that need to be considered when applying the EF for headhouse and grain handling. (1) The PM2.5 EF was not obtained from direct measurements but was scaled from PM10 EF. Reference 61 (RTI International Citation2003) provides results of a field-testing program that was implemented to estimate PM emissions from the headhouse and grain handling. According to the document, tests were focused on PM10 emissions. The PM10 EF was further scaled to PM2.5 using the mean ratio of 17% (U.S. EPA Citation1995). The scaling (instead of using direct measurements) would likely result in an inaccuracy of the PM2.5 EF estimation. (2) EFs referenced in the AP-42 were developed regardless of the type of the grain and are thought to be suitable for all grain types. The document states that recent source tests using various grain types have shown no distinction in the results based on a grain type (RTI International Citation2003). However, some research suggests that the amount of PM released to the atmosphere and the particle size distribution in the dust depends on the type of the grain. For example, Boac et al. (Citation2009) investigated corn and wheat generated dust that was sampled from the ducts upstream of the cyclones. The study reported that corn handling generated more than twice as much total dust as wheat handling, but particles produced from corn were smaller than those generated from wheat. The percentages (of the total dust) of particulate matter PM2.5. PM4.0 and PM10 were 5.2%, 9.8% and 34.1% for wheat, and 7.5%, 10.0% and 28.8% for corn, respectively. Parnell et al (Citation1986) looked at physical properties (such as particles size distribution, bulk and particle density, etc.) of five grain dust types: soybean, rice, corn, wheat and sorghum. The study was focused on dust particles smaller than 100 μm. The mass mean diameter ranged from 10.7 μm to 14 μm. Bulk density varied from 0.150 g/cm3 to 0.308 g/cm3. Particle density was in the range of 1.43–1.69 g/cm3. Therefore, more studies should be conducted to investigate the difference in the amount of dust emitted from different grain types. The moisture content of the grain also affects the amount of emitted particulate matter (U.S. EPA Citation1995). Thus, appropriate local meteorological parameters should be taken into consideration when estimating PM emissions and developing EFs for grain handling. (3) The EF from headhouse and grain handling is rated “poor” making it barely applicable to be used in emission estimates (RTI International Citation2003).
In this study the tracer ratio method was demonstrated to be a simple and effective technique in estimating PM2.5 emission rates: the on-site experiments were straight forward, and the calculations took several hours to complete. The accumulated sums method that was used to estimate PM2.5/CO2 ratios offers some benefits: it eliminates issues with matching the delay and response times of the particle and the tracer analyzers and reduces the errors related to offsets in the analyzers’ positions. The PM2.5/tracer ratio over the six tests was consistent supporting the assumptions that PM2.5 and CO2 disperse in a similar way. It also verified that the CO2 tracer release was a reliable simulation of the PM2.5 pollutant source (at least over a 10-meter distance), and that there were no interfering sources present during the experiments.
Despite the advantages of the tracer ratio method discussed above, the technique has its limitations. As Czepiel et al. (Citation1996) mentioned, this technique is sensitive to interfering sources. Also, the method requires a significant signal to be detected above the background values. Moreover, a source should be sufficiently strong to be measured far enough downwind to provide a good mixing with the tracer gas. In addition, the atmospheric transport and dispersion, as well as removal and deposition, of the pollutant and the tracer must be similar (Claiborn et al. Citation1995; Scholtens et al. Citation2004). For PM2.5, the estimated settling velocities are less than 1 cm/s which is much less than typical vertical turbulent velocity fluctuations. The release experiments for this work were performed within 10 m of the source, making the effects of deposition rate of PM2.5 nearly negligible (the deposition distance under the distances involved would be less than 0.0015 m or 0.15 cm). Dry deposition due to near surface turbulent transport can be another source of particle deposition. However, deposition velocities for small particles are quite small and given the short transport distance, dry deposition would be negligible. As presented above, the ratio of PM2.5 concentration to CO2 concentration remained fairly constant during the experiments so that it can be assumed that PM2.5 and CO2 follow the same atmospheric transport, dispersion, removal and deposition over the distances involved in this study (< 10 m).
In this study the uncertainty of the tracer method was driven by the uncertainty associated with PM2.5 measurements. Therefore, it is crucial to achieve a strong agreement between measurements taken by the particle analyzers (located upwind and downwind from the emission source). Results from multiple tests, where both analyzers are exposed to the same PM source and show a good agreement in measured concentrations, can reduce the uncertainty of the method.
Conclusion and recommendations
This study was designed to provide estimates of a PM2.5 emission rates from horizontal wheat conveyance at the conveyor transfer point using the tracer ratio method.
The estimated emission rate was 320 times lower than the emission rate derived from the EF referenced in the AP-42 and currently used for permit purposes to estimate dust emissions from grain conveyance (specifically at the transfer point). The emission rate obtained with the Gaussian plume model and using the corrected Taylor’s dispersion coefficients was within a factor of 2 with the emission rate estimated by the tracer ratio method. Use of the Taylor’s one-particle diffusion parameters corrected by Peterson and Lamb for short term and near source conditions (in the place of Pasquill-Gifford dispersion coefficients) is expected to improve the accuracy of the model. However, since the model involves other assumptions that impose further limitations, at this time, there are no sufficient data to evaluate the obtained estimations. The results of this study suggest that: (1) more studies should be conducted to investigate the difference in the amount of dust emitted from different grain types, and (2) there is a need for the EPA to develop a designated PM2.5 EF for wheat conveyance.
Very few studies (Claiborn et al. Citation1995; Kantamaneni et al. Citation1996) have been done to apply atmospheric tracer methods to estimate PM emissions. This study aimed to verify the application of an atmospheric tracer technique to quantification of PM emissions and to broaden the number of studies investigating this application. However, more studies examining this application are necessary. It is suggested that further research involves the use of various tracer gases, engages simulation of an emission source with a tracer over different downwind distances and possibly proposes new techniques to estimate pollutant-to-tracer concentrations ratios.
Acknowledgment
This study was funded by the Ritzville Warehouse Company. The authors acknowledge Brian Gordon for the opportunity of conducting the experiments, David Kommes for arranging for the field experiments, and Scott Somers for coordination of the field experiments and providing comments on technical aspects of the study. The authors acknowledge the assistance of Patrick O’Keeffe in designing the experiments and providing necessary training. The authors also thank Adriana Carbon and Kristina Koh for their collaboration in conducting the experiments.
Disclosure statement
No potential conflict of interest was reported by the authors.
Additional information
Funding
Notes on contributors
Anna Potapova
Anna Potapova is a research assistant in the Department of Civil and Environmental Engineering at Washington State University, Pullman, WA.
Brian Lamb
Brian Lamb is Regents Professor Emeritus in the Laboratory for Atmospheric Research and Department of Civil and Environmental Engineering at Washington State University, Pullman, WA.
Candis Claiborn
Candis Claiborn is Professor and Dean Emeritus in the Voiland College of Engineering and Architecture at Washington State University, Pullman, WA.
References
- Abdel-Rahman, A. A. October 2008. On the atmospheric dispersion and Gaussian plume model. 2nd International Conference on waste management, water pollution, air pollution, indoor climate (WWAI’08), Corfu, Greece.
- Arya, S. P. 1999. Air pollution meteorology and dispersion. New York (NY): Oxford University Press.
- Boac, J. M., R. G. Maghirang, M. E. Casada, J. D. Wilson, and Y. S. Jung. 2009. Size distribution and rate of dust generated during grain elevator handling. Applied Engineering in Agriculture 25 (4):533‐541.
- Brantley, H. L., E. D. Thoma, W. C. Squier, B. B. Guven, and D. Lyon. 2014. Assessment of methane emissions from oil and gas production pads using mobile measurements. Environmental Science & Technology 48:14,508−14,515. doi:10.1021/es503070q.
- Claiborn, C., A. Mitra, G. Adams, L. Bamesberger, G. Allwine, R. Kantamaneni, B. Lamb, and H. Westberg. 1995. Evaluation of PM10 emission rates from paved and unpaved roads using tracer techniques. Atmospheric Environment 29 (10):1075–89. doi:10.1016/1352-2310(95)00046-2.
- Cooper, C. D., and F. C. Alley. 2011. Air pollution control, a design approach. 4th ed. Long Grove (IL): Waveland Press, Inc.
- Czepiel, P. M., B. Mosher, R. C. Harriss, J. H. Shorter, J. B. McManus, C. E. Kolb, E. Allwine, and B. K. Lamb. 1996. Landfill methane emissions measured by enclosure and atmospheric tracer methods. Journal of Geophysical Research 101 (D11):16,711–16,719. doi:10.1029/96JD00864.
- Daube, C., S. Conley, I. C. Faloona, C. Arndt, T. I. Yacovitch, J. R. Roscioli, and S. C. Herndon. 2019. Using the tracer flux ratio method with flight measurements to estimate dairy farm CH4 emissions in central California. Atmospheric Measurement Techniques 12 (4):2,085–2,095. doi:10.5194/amt-12-2085-2019.
- Foster-Wittig, T. A., E. D. Thoma, R. B. Green, G. R. Hater, N. D. Swan, and J. P. Chanton. 2015. Development of a mobile tracer correlation method for assessment of air emissions from landfills and other area sources. Atmospheric Environment 102 (2015):323–30. doi:10.1016/j.atmosenv.2014.12.008.
- Gertler, A., H. Kuhns, M. Abu-Allaban, C. Damm, J. Gillies, V. Etyemezian, R. Clayton, and D. Proffitt. 2006. A case study of the impact of winter road sand/salt and street sweeping on road dust re-entrainment. Atmospheric Environment 40:5976–85. doi:10.1016/j.atmosenv.2005.12.047.
- Kantamaneni, R., G. Adams, L. Bamesberger, E. Allwine, H. Westberg, B. Lamb, and C. Claiborn. 1996. The measurement of roadway PM10 emission rates using atmospheric tracer ratio techniques. Atmospheric Environment 30 (24):4209–23. doi:10.1016/1352-2310(96)00131-8.
- Lamb, B. K., J. B. McManus, J. H. Shorter, C. E. Kolb, B. Mosher, R. C. Harriss, E. Allwine, D. Blaha, T. Howard, A. Guenther, et al. 1995. Development of atmospheric tracer methods to measure methane emissions from natural gas facilities and urban areas. Environmental Science & Technology 29:1468–79. doi:10.1021/es00006a007.
- Lamb, B. K., S. L. Edburg, T. W. Ferrara, T. Howard, M. R. Harrison, C. E. Kolb, A. Townsend-Small, W. Dyck, A. Rossolo, and J. R. Whetstone. 2015. Direct measurements show decreasing methane emissions from natural gas local distribution systems in the United States. Environmental Science & Technology 49:5,161–5,169. doi:10.1021/es505116p.
- Mclouth, M. E., and H. J. Paulus. 1961. Air pollution from the grain industry. Journal of the Air Pollution Control Association 11 (7):313–17. doi:10.1080/00022470.1961.10468004.
- Mitchell, A. L., D. S. Tkacik, J. R. Roscioli, S. C. Herndon, T. I. Yacovitch, D. M. Martinez, T. L. Vaughn, L. L. Williams, M. R. Sullivan, C. Floerchinger, et al. 2015. Measurements of methane emissions from natural gas gathering facilities and processing plants: Measurement results. Environmental Science & Technology 49 (5):3219–27. doi:10.1021/es5052809.
- Mollmann-Coers, M., D. Klemp, K. Mannschreck, and F. Slemr. 2002. Determination of anthropogenic emissions in the Augsburg area by the source–tracer-ratio method. Atmospheric Environment 36:95–107. doi:10.1016/S1352-2310(02)00212-1.
- Omara, M., M. R. Sullivan, X. Li, R. Subramanian, A. L. Robinson, and A. A. Presto. 2016. Methane emissions from conventional and unconventional natural gas production sites in the marcellus shale basin. Environmental Science & Technology 50 (4):2099–107. doi:10.1021/acs.est.5b05503.
- Parnell, Jr., B. Calvin, D. D. Jones, R. D. Rutherford, and K. J. Goforth. 1986. Physical properties of five grain dust types. Environmental Heath Perspectives 66:183–88. doi:10.1289/ehp.8666183.
- Peterson, H., and B. Lamb. 1992. Comparison of results from meandering-plume model with measured atmospheric tracer concentration fluctuations. American Meteorology Society 31:553–64.
- RTI International. 2003. “Emission factor documentation for ap-42, section 9.9.1. grain elevators and grain procesing plants. Final Report. Prepared for U.S. environmental protection agency.” RTI International, Research Triangle Park, North Carolina.
- Scholtens, R., C. J. Dore, B. M. R. Jones, D. S. Lee, and V. R. Phillips. 2004. Measuring ammonia emission rates from livestock buildings and manure stores—part 1: Development and validation of external tracer ratio, internal tracer ratio and passive flux sampling methods. Atmospheric Environment 38:3,003–3,015. doi:10.1016/j.atmosenv.2004.02.030.
- U.S. Environmental Protection Agency. 1995. Compilation of air pollutant emission factors (AP-42), Vol.1: Stationary point and area sources. 5th Ed. Research Triangle Park, North Carolina: U.S. Environmental Protection Agency, Office of Air Quality Planning and Standards.
- U.S. Environmental Protection Agency. 2018a. Particulate matter (PM) Pollution. Accessed September 12,2018. https://www.epa.gov/pm-pollution.
- U.S. Environmental Protection Agency. 2018b. Air emissions factors and quantification. Accessed September 18, 2018. https://www.epa.gov/air-emissions-factors-and-quantification.
- U.S. Environmental Protection Agency. 2018c. Air quality models. Accessed October, 01, 2018. https://www.epa.gov/scram/air-quality-models.
- U.S. Environmental Protection Agency. 2018d. Air quality dispersion modeling - preferred and recommended models. Accessed October 02, 2018. https://www.epa.gov/scram/air-quality-dispersion-modeling-preferred-and-recommended-models.
- Valavanidis, A., K. Fiotakis, and T. Vlachogianni. 2008. Airborne particulate matter and human health: toxicological assessment and importance of size and composition of particles for oxidative damage and carcinogenic mechanisms. Journal Journal of Environmental Science and Health, Part C: Environmental Carcinogenesis and Ecotoxicology Reviews 26 (4):339–62. doi:10.1080/10590500802494538.