
 ?Mathematical formulae have been encoded as MathML and are displayed in this HTML version using MathJax in order to improve their display. Uncheck the box to turn MathJax off. This feature requires Javascript. Click on a formula to zoom.
ABSTRACT
In order to reveal multiscale dynamic distribution characteristics of dust collectors in a wet scrubber, a method for scale decomposition of dust collectors based on Wigner–Ville distribution (WVD), empirical mode decomposition (EMD) and Hurst analysis of grayscale signals is reported. The WVD features of grayscale signals were used to observe the energy distribution details of dust collectors at different frequency bands and time periods. Then, the scale decomposition of dust collectors based on EMD and Hurst analysis of the grayscale signals was carried out. These analysis results showed that the motion behaviors of micro-, meso- and macro-scale subsets of dust collectors were determined: specifically, the single fractal features of micro-scale subsets conform to the motion characteristics of individual dust collectors. The dual fractal characteristics of meso-scale subsets denote the interactions among dust collector aggregations. Additionally, the fractal features of the macro-scale subsets reflect persistent liquid surface fluctuation behavior in wet scrubbers. Finally, the relative contribution of dust collectors at different scales to the effectiveness of dust removal was represented. This is not only an important innovation in the study of micro mechanism of wet dust removal but provides powerful theoretical support for technological innovations in wet scrubbers.
Implications: The multiscale dynamic distribution characteristics of dust collectors in wet dust scrubber were explored, using a method for scale decomposition of dust collectors based on Wigner–Ville distribution, empirical mode decomposition and Hurst analysis of grayscale signals. The fractal characteristics of different scales of dust collectors are determined. Besides, the contribution of different scales of dust collectors to the effect of dust removal is quantized. Therefore, this research is very meaningful, which not only has important innovation in the study of micro mechanism of wet dust collectors but provides a powerful theoretical support for technological innovation of wet dust scrubbers.
Introduction
Wet scrubbers are critical equipment for purifying gas in high dust concentration location. In-depth insight into the movement behaviors of dust collectors in the gas–liquid two-phase flow in the dust removal chamber of wet scrubber significant for their structure design and operation. Such knowledge is also important in the dust removal mechanism of research through dust collectors.
The motion of dust collectors in dust removal chamber is closely related to the dust collection process, and it is an unsteady and complex dynamical evolution process that has been studied by many non-linear methods, including time-frequency analysis, power spectral density estimation, non-linear fitting (Li et al. Citation2019a, Citation2016, Citation2019b; Wei, Li, and Wang Citation2020). These studies have made momentous contributions to understand dust collector flow behavior in these gas–liquid two-phase flow systems. But it should be noticed that all of these studies were performed on a single scale.
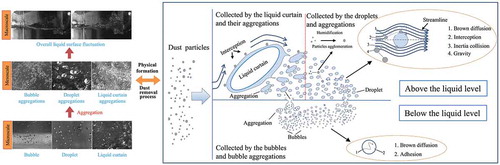
Dust collectors in a gas–liquid two-phase flow exist in several different states: as individual bubble, droplet and liquid curtain; bubble aggregations, droplet aggregations and liquid curtain aggregations (Cheng Citation1993; Li et al. Citation2019c; Liu, Jiang, and Jin Citation1998). It is of great help to study the performance of scrubber to connects these dust collectors states with features of their dynamic distribution together. Of note, individual dust collectors and their aggregations have dynamic movement behaviors, respectively, this cannot be revealed through investigations at only a single scale. Furthermore, in related fields, the dynamic distribution characteristics of gas–liquid two-phase flow are known to be multiscale (including micro-, meso- and macro-scale) (Bai and Chen Citation2004; Dong et al. Citation2008; Fan, Zhao, and Chen Citation2014; Fang et al. Citation2013; Zheng and Jin Citation2009). Sun, Xu, and Duan (Citation2011) divided gas–liquid two-phase bubbly flow in horizontal pipe into three basic scale behavior: micro-scale, which reflected the micro-scale interaction between bubbles and bubbles; meso-scale, which reflected the micro-scale interaction of the liquid phase and bubbles; macro-scale, which reflected the macro-scale interaction of the gas–liquid two-phase flow system. Based on the strength throttle process of the airflow in wet scrubber, the dust collectors’ generation is affected by many complicated factors, such as the fluid turbulence, the interphase interface interaction and partial relative motion. Thus, its flow behaviors are complex and include rich multiscale information. Accordingly, there are also dust collectors of three basic scales and corresponding collecting dust mechanism: micro-scale (representing motion behavior of individual dust collectors); meso-scale (representing dynamic characteristic of dust collector aggregations); and macro-scale (representing movement behavior of the global gas–liquid two-phase flow), as shown in .
Figure 1. Different scales of dust collectors and corresponding collecting dust mechanism.
Various analysis methods are used to reveal the multiscale characteristics of fluctuation signals of gas–liquid two-phase flow, reflected the multiscale dynamic distribution characteristics of dust collectors. Many studies have shown that multiscale flow behavior can be studied by digital image processing technology and EMD (Ding Citation2007; Li et al. Citation2017, Citation2010; Sun et al. Citation2006; Zhou and Zhao Citation2012). For images, they can record the real-time motion behavior of the gas–liquid two-phase flow, instead of recording the change characteristics of single-phase flow. In addition, gray value, which can be regarded as the image brightness value, is the most important among many features. The dynamic distribution of different types of dust collectors will cause the brightness of the image to change. The mean gray value of each frame of the video image is extracted and is combined into a grayscale time series, that is, a grayscale signal. The signal is comprised of micro-, meso- and macro-scale information of dust collector flow, EMD has therefore been used to decompose these grayscale signals, because it can adaptively decompose signals based on their intrinsic features and is more suitable for analyzing such signals.
In this research, a method based on WVD, EMD and Hurst analysis for the analysis of grayscale signals is proposed. WVD is used to reveal the rules of energy change of the grayscale signals in the time-frequency joint domain. EMD is used for the adaptive analysis of the grayscale signals of the images to obtain the different scale components of the dust collector flow. Hurst analysis then is applied to evaluate the fractal characteristics of the results from the different scale components. The standard scale division then is established, based on these analysis results. The Hurst exponents are calculated to reflect the long-range correlation of stochastic processes of the above-mentioned components. These scale components, which represent stochastic tendencies, fractal structures and persistent tendencies, then are divided into micro-, meso- and macro-scale tendencies, respectively. Finally, the parameters related to the dynamic distribution characteristics of dust collectors at different scales are extracted to further verify the results of the WVD.
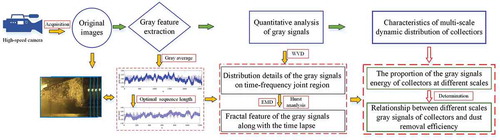
In this work, the authors used a high-speed camera to capture the dynamic image of different patterns of the gas–liquid two–phase flow in a wet scrubber and then extracted the mean gray value of each frame image to form the corresponding time series of different flow patterns, which were subjected to WVD, EMD and Hurst analysis to obtain the dynamic distribution characteristics of dust collectors in three scales in a wet scrubber, specifically, the micro-scale, the meso-scale and the macro-scale. Finally, the theoretical and experimental analysis was used to verify that the relative energy contributions of the micro-, meso- and macro-scale subsets could be taken as the respective eigenvalues to investigate the flow behaviors of single collectors and collector aggregations. Moreover, through the relationship between the energy ratio of the three scales and the collection efficiency, the proportion of the energies of the three scales was determined when the dust removal efficiency was more ideal. The analysis flowchart of this paper as shown in .
Figure 2. The analysis flowchart of this paper.
Methodology
The structure of a wet scrubber
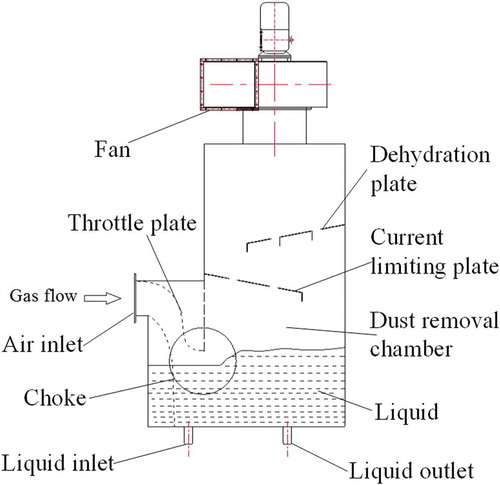
The structure of a typical wet scrubber for dust removal, which mainly comprises the throttle plate, dust removal chamber, current limiting plate, dehydration plate, exhaust fan and other structures, is shown in . The dusty air enters the scrubber through the air inlet under the suction force of the fan. Due to the effect of acceleration, which is caused by the sharp decrease in cross-section at the choke area, the airflow excites the purifying liquid (clean water) surface and this generates a large quantity of dust collectors, such as droplets, liquid curtains, bubbles and their aggregations, in the dust removal chamber, which generates different types of dust collectors in different flow patterns. These dust collectors capture solid dust by means of collision, interception, Brownian diffusion or other ways, and the cleaned air is discharged through the outlet fan.
Figure 3. Structure of the dust scrubber.
Test setup
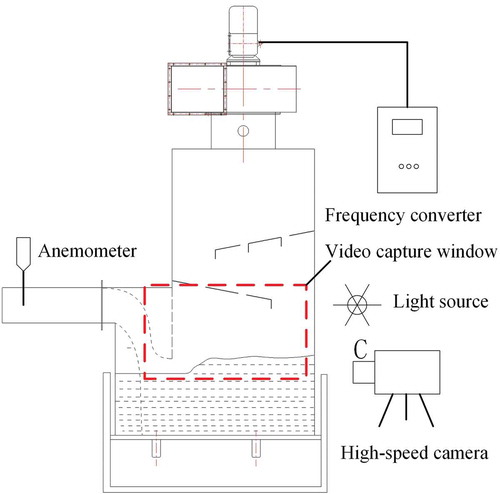
The measuring device and test element layout are shown in . The scrubber had a length of 1 m, a width of 0.3 m and a height of 1.2 m (excluding the holder). The wet scrubber inlet had a width of 0.3 m and a height of 0.12 m. The induced draft fan had a maximum flow capacity of 3843 m3/h and a total pressure of 1741 Pa. Moreover, rulers were installed to measure the liquid level in front and behind the throttle plate. A hot-wire anemometer (TES Electrical Electronic Corp., TES-1341) was used to measure the inlet gas velocity of the wet scrubber and a high-speed camera (Olympus Corporation, i-SPEED 3) recorded the process flow of the collectors, with an image resolution of 1280 × 1024 at a sampling rate of 2000 frames per second.
Figure 4. Measuring device and test element layout method.
The initial liquid level was set as 27, 10, 0, −10 and −23 mm, respectively, which is represented as b0. When the initial liquid level just touched the bottom of the throttle plate in the absence of airflow, the b0 value was recorded as 0 mm. When the initial liquid level was lower than the bottom of the throttle plate, b0 is positive. Conversely, when the initial liquid level is higher than the bottom of the throttle plate, b0 is negative. During operation, the inlet gas velocity of the scrubber was adjusted from low to high in sequence. Meanwhile, the high-speed camera was used to record simultaneously the flow distribution of collectors in the dust removal chamber at the different preset test parameters. Finally, the video images of gas–liquid two-phase flow under each condition were obtained for the next step of the analysis.
Macroscopic property description of the fluid flow in the wet scrubber
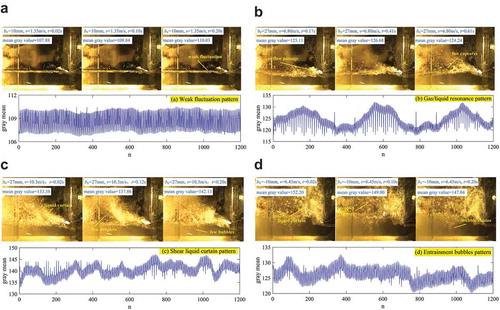
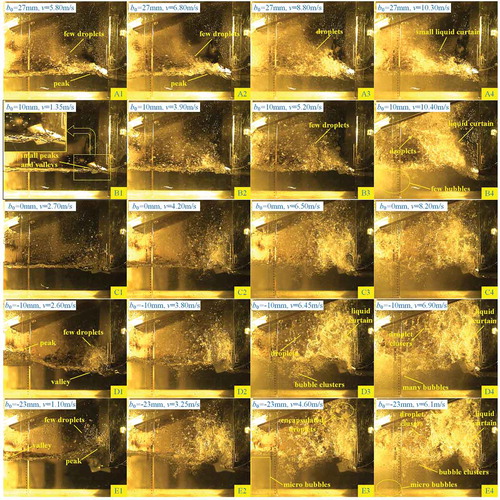
In this test, dynamic images of the gas–liquid two-phase flow in the dust removal chamber were captured at a sampling rate of 500 frames per second, under the different operating conditions. Four typical images of the gas–liquid two-phase flow patterns were selected for analysis, which were weak fluctuation pattern, gas/liquid resonance pattern, shear liquid curtain pattern and entrainment bubble pattern, respectively, as are shown in .
Weak fluctuation patterns were evident when the liquid level was below the throttle plate and the gas velocity was low. The purifying liquid surface in dust removal chamber showed only slight fluctuation, while stochastic pulsing of the liquid surface occurs at the interface between the gas and liquid phases, shown in )
When the fluctuation frequency of gas phase is equal to or close to the fluctuation frequency of liquid phase, the gas–liquid two-phase flow in the wet scrubber is in the gas/liquid resonance condition and generates a characteristic pattern. In this case, periodic and large-amplitude waves on the liquid surface give rise to the liquid level periodically being high or low at the choke, as shown in ).
When the liquid level is below the bottom of the throttle plate but the gas velocity is high, the liquid phase will be entrained by the high gas velocity into the dust removal chamber in the form of a sheared liquid curtain. This behavior also is known as shear flow. In the meanwhile, a liquid curtain may be formed, and a few droplets and bubbles will be scattered in the dust removal chamber, as shown in ).
When the liquid surface submerges the bottom of the throttle plate, and if the gas velocity is high, the airflow will have more opportunity to entrain the liquid droplets and transmit them into the dust removal chamber. The entrained liquid in the form of the dust collectors, which produces more dust collectors than does a shear liquid curtain pattern, as shown in ). The interaction between the gas and liquid phases is most complicated in these patterns and is also known as chaotic flow.
Figure 5. (a–d). Four typical patterns of collector flow (a).
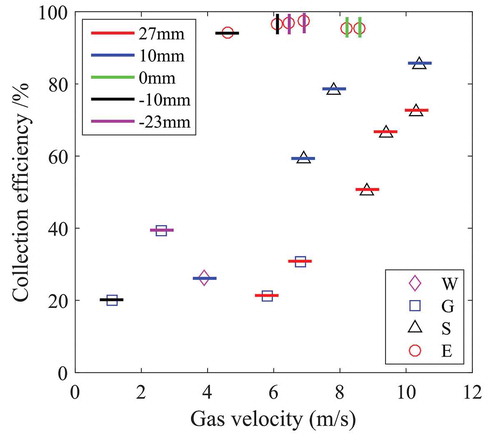
In practical application, the former two are the non-working mode and have poor dust removal efficiencies. Conversely, the latter two are typical of the normal working mode and have much better the dust removal efficiencies. Talcum powder (pulvis talci) of 3000 mesh was used to simulate industrial dust in these tests (Li et al. Citation2017). The dust removal efficiency distribution at different initial liquid levels and gas velocities is shown in , where W, G, S and E represent the weak fluctuation pattern, the gas/liquid resonance pattern, the shear liquid curtain pattern and the entrained bubble pattern, respectively. The different colored lines represent different initial liquid levels. It can be observed that the collection efficiencies of the weak fluctuation pattern and the gas/liquid resonance pattern were less than 40%. By comparison, the collection efficiency of the shear liquid curtain pattern was relatively high, i.e., nearly 90%, and for the entrainment bubble pattern, the collection efficiency can reach 97.5%.
Figure 6. The dust removal efficiency of different patterns.
Therefore, it is a great significance to realize fully the change rules for gas–liquid two-phase flow behaviors in wet scrubbers in order to better understand the dust removal mechanism and to facilitate the technical improvement of the dust removal process.
Grayscale signals acquisition method
It is the case that the mean gray value of the images can be described by the formula given in 2–1:
where the μ represents the mean gray value of images, L is the possible number of gray levels, Ci is a random variable of brightness and H(i) signifies a function of gray levels in an area.
In the air-flow tests, the dynamic image signal acquisitions were performed for each of the flow patterns and then the mean gray value for each frame image was extracted to form the corresponding gray time series. The gray time series of the four typical flow patterns and their corresponding flow pattern pictures are shown in . It can be observed that the grayscale signal of the gas/liquid resonance pattern exhibits strong periodicity, whereas the grayscale signals of the other flow patterns display no obvious regularity.
Next, the WVD combined with EMD and Hurst analysis was used to analyze the grayscale signals so as to obtain more detail on the behaviors of gas–liquid two-phase flow.
Wigner–Ville distribution (WVD)
The Wigner distribution was first proposed by the physicist Wigner in the study of quantum mechanics. Ville then introduced the Wigner distribution into the field of signal processing and proposed a new time-frequency representation method for non-stationary signals, which is the WVD (Hu Citation2015). The basic idea of the WVD is that it can be used to describe a joint function of time and frequency, which can represent the energy distribution in the time-frequency plane. It is a very powerful tool for analyzing non-stationary signals. It is assumed that the WVD of the actual signal s(t) is defined as follows:
where the * represents complex conjugate, and g(t) is the analytic signal of the actual signal s(t).
First of all, the real signal s(t) is described by the Hilbert equation:
The analytical signal g(t) is obtained:
However, the scattered WVD is defined as:
where J, k and c are discrete variables corresponding to continuous variables t, f and τ respectively.
EMD method
The essence of EMD is the process of adaptively decomposing signals to obtain an intrinsic mode function (IMF) satisfying the condition that is needed for further analysis. However, the general signals usually are more complicated and do not have conditions that satisfy direct decomposition of the IMF. In practice, the IMF values of signals could be screened using the EMD method (Huang et al. Citation1998), and the specific steps of EMD algorithm are as follows:
Determine all the local maximum points and minimum points of the original signal s(t). After that, cubic spline curve fitting is used to form the upper and lower envelopes. Then, the mean values m(t) of the upper and lower envelopes are found.
The difference between the original data series and the average of the upper and lower envelopes is obtained:
I(t) is taken as the new s(t) value to repeat the above operation until I(t) satisfies the IMF condition. At this moment, I(t) is the first order IMF, denoted by I1(t), which usually contains the highest frequency component of the signal.
Then, the residual sequence r(t) from the difference between the original signal s(t) and the I1(t) is achieved:
where the r1(t) is taken as a new s(t). After that, the above process is repeated to get the second IMF (I2(t)), the third IMF (I3(t)) …. etc., until the r(t) is basically monotonous or very small, and rn(t) cannot be sieved again.
Thus, the initial signal s(t) is decomposed into a sum of several IMF components and one residual term:
The EMD could decompose any complex signal adaptively into a set of IMF components, provided that the following two conditions are met:
In the whole-time data sequence, the number of extreme points (including the maximum value and the minimum value) differs from the number of zero-crossing points by at most one.
At any one time point, the average value of the envelope composed of local extreme points is 0, at which the local maximum point determines the upper envelope line and the local minimum point determines the lower envelope.
Hurst analysis and calculation method
Hurst analysis (Hurst’s rescaled range analysis, also known as R/S analysis) was first described by Hurst (Hurst Citation1951) and is usually applied to estimate the Hurst exponent H for measuring the statistical correlation of a time series. As an important indicator for describing the non-function long period, the Hurst exponent can be applied to analyze stochastic behaviors and chaotic fractal characteristics of signals. In this section, Hurst analysis was used for characterizing the behaviors of different IMF components after EMD. The data processed by the Hurst analysis are discrete-time data, and the Hurst exponent H can be calculated by the following steps: given a time series ξ(t), τ is a time interval, therefore, the mean of the time data of τ is given by the following:
The cumulative dispersion is then obtained:
and the difference between the maximum and minimum, that is, the range is given by:
The standard deviation, that is, the root square of the variation, is provided by:
and Hurst pointed out the following relationship between R(τ)/S(τ) and time delay τ:
where H is the Hurst component, which can be obtained by linear regression of the relation diagram: ln(R(τ)/S(τ))-ln(τ)
The Hurst exponent H is used for measuring the long-range correlation of the non-periodic behavior of the time series of grayscale signals. If H is equal to 0.5, it is shown that the time series are mutually independent and are completely random. That is to say that there is no correlation between before and after the change of the time series. If H is greater than 0 and less than 0.5, it indicates that the time series has anti-persistence. That is to say that the current changes are opposite to future changes. If H is larger than 0.5 and less than 1, it demonstrates that the time series has persistence. That is to say that the current changes are consistent with future changes. More specifically, if the sequence shows a trend of growth or decline is present it will continue to maintain growth or decline in the future.
Meanwhile, for a signal with similarity, the following relationship is satisfied between the self-similarity fractal dimension of a time series and the Hurst exponent H:
Results and discussion
Optimization of the sequence length of grayscale signals
In order to fully understand the dynamic distribution characteristics of the dust collectors in a wet scrubber, more dynamic image data were collected to ensure as far as possible that the time series length of the gray features in the tests was consistent. However, in the process of nonlinear signal analysis, the selection of time series length has a great influence on the scale parameters. If the time series length is too long, it will increase the calculation load and the calculative complexity and will reduce computational precision. On the other hand, if the time series length is too short, it will cause scale value deviation and will be unable to reflect correctly the dynamic characteristics of fluid flow. Consequently, the selection of a suitable time series length is important to the accuracy of the analysis results.
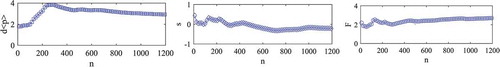
In this work, the three parameters were used as the indices to optimize the data volume, which were fluctuation intensity (σ/<p>), skewness factor (s) and flatness factor (F), respectively (Wu et al. Citation2009). The statistical variation relationships under different parameters are shown in . As is evident from this picture, when the data length reached 1000, the three parameters already tended to be stable, while when it reached 1200, they were all more stable. Therefore, the fluctuation sequence length was unified to 1200 for the present investigation.
Figure 7. Values of gray signal statistic parameter of different data lengths.
Time-frequency characteristic analysis of gas–liquid two-phase flow
Time-frequency characteristic analysis of gas–liquid two-phase flow
The WVD analysis results of the grayscale signals of the gas–liquid two-phase flow under the different operating parameters are depicted in . Based on the analysis result from , the time-frequency characteristics of the gas–liquid two-phase flow have distinct detail distinguishing features. With the change of the operating parameters, the energy distributions of the grayscale signals have corresponding changes.
Figure 8. The WVD analysis results of the gray signals of different operating parameters.
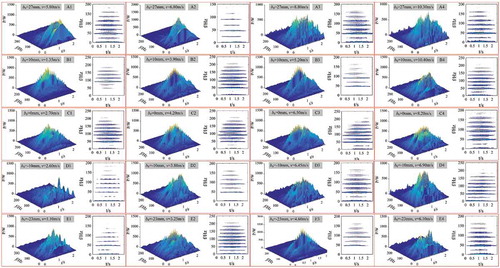
When the initial liquid level is larger than 0 mm and the gas velocity is low, the energy distribution of the grayscale signals is concentrated in the medium- and high-frequency ranges (approximately within the range of 80–150 Hz), such as is illustrated in B1). In this case, the status of the gas–liquid two-phase flow is a weak fluctuation pattern; the liquid surface at the throttle orifice area exhibits processes of spirited self-competition and coordination. There are many small peaks and valleys in the distribution of grayscale signals (B1)), their formation cycle is shorter, and the frequency is relatively high. The energy is weaker in other frequency regions, while the whole liquid surface shows slight fluctuation and its frequency is in the region of about 100 Hz.
Figure 9. Dust collectors’ distribution characteristics of different operating parameters.
With an increase in gas velocity, the gas–liquid two-phase flow begins to exhibit a gas/liquid resonance pattern. At this time, the energy distribution is predominantly in the low-frequency range (about 0–50 Hz), for instance, in A1) and (A2). This is due to the periodic and large-amplitude waves that appear in the liquid surface at the gas/liquid resonances, and only a small quantity of droplets is produced as the liquid surface fluctuation is at a peak in the choke area (A1) and (A2)). Therefore, the energy distribution in the higher frequency domain is less and with increasing speed of the airflow, the energy of the low-frequency region also increases. While the initial liquid level is less than or equal to 0 mm and the gas velocity is relatively low, with the rise in the liquid level, the energy distribution has a tendency to move toward the medium- and high-frequency regions, for instance, as illustrated in (D1) and (E1). In this condition, regardless of the liquid surface fluctuations at the crests or troughs in the choke area, small amounts of dust collectors are generated. Nevertheless, as the liquid level goes up, the amount of the dust collectors will increase because more liquid is carried by the airflow into the dust chamber ( (D1) and (E1)).
As the gas velocity is increased further, the gas–liquid two-phase flow becomes a shear liquid curtain pattern. The energy is distributed mainly in the medium- and low-frequency region (0–100 Hz) and appears more uniform. The energy value of the region is greater than that of the above patterns. In addition, the peak energy tends to increase with the rise in the liquid level, such as is illustrated in A3), (A4) and (B4). This is because the airflow has a stronger impact on the liquid surface, forming a continuous shear effect at a higher frequency, which will generate a small number of bubbles and a large quantity of droplets, and it will also generate a liquid curtain ( (A3), (A4) and (B4)).
The energy distribution is mainly in the medium- and low-frequency regions in the entrainment bubble pattern, which is even more uniform and stable as time goes by, as is illustrated in (C4), (D4) and (E4). This is because a large proportion of the energy is used to maintain the overall liquid surface wave. Moreover, lots of dust collectors are generated as the liquid level rises and the gas velocity is increased, including more droplet aggregations, bubble aggregations and a larger area of liquid curtain. The motion and deformation of these dust collectors produce an energy distribution in the medium- and high-frequency regions. At the same time, a large number of droplets are wrapped up in the large volume of liquid that is conveyed into the scrubber interior, falling back to the liquid surface, and leading to the further magnification of the turbulence in the liquid surface. This results in a large number of bubbles, and bubble aggregations are produced below the liquid surface. The mixture then between the gas and liquid phases is more uniform and complex ( (C4), (D4) and (E4)).
In summary, it can be concluded from the WVD analysis that different flow patterns can be evaluated for the time and frequency domains, and the overall dynamic evolution characteristics of the gas–liquid two-phase flow condition are accurately reflected. However, further analysis is necessary before the detailed characteristics of the dust collectors’ dynamic distribution are clearly understood. Thus, with the help of the EMD and Hurst analyses, more specific dynamic characteristics of the gas–liquid two-phase flow can be explored.
Multiscale fractal characteristics of the dust collectors
Fractal characteristic analysis of grayscale signals
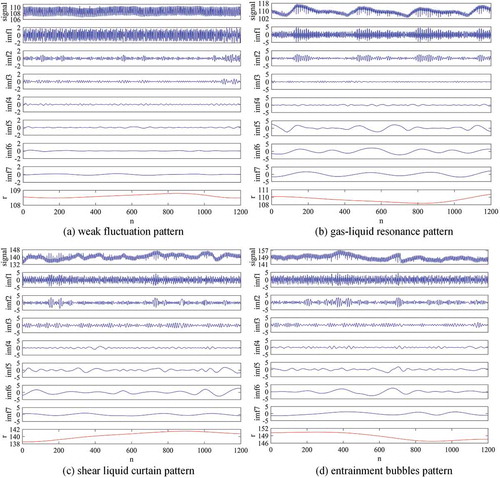
shows the original grayscale signals of four gas–liquid two-phase flow patterns, IMFs (imf1-imf7) and residual r obtained by EMD. The IMFs have different instantaneous frequencies, shifting from IMF1 with the highest frequency in the first row to IMF7 with the lowest frequency and the residual r in the last row. An analysis of each IMF and of r then is performed.
Figure 10. The EMD analysis results of the gray signals of different collector patterns.
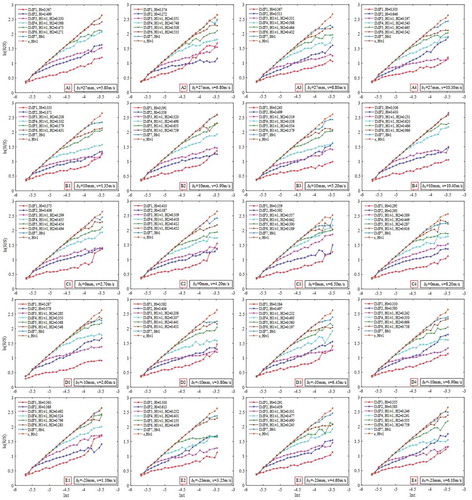
The Hurst analysis results of the IMF1-IMF7 and residual r for different liquid levels and gas velocity are shown in . From these, the Hurst exponent H, or in other words the relationship between and
after calculating
for a given time delay τ, could be obtained as a linear regression of the straight-line portion of the polylines. It can be seen that the relationship between
and
for grayscale signals of different scales has similar fractal features. There is only one clear Hurst exponent H (H < 0.5) for IMF1 and IMF2. Two distinct Hurst exponents H1 (H1 ≈ 1) and H2 are derived for IMF3–IMF6, reflecting the double fractal features on the IMF3–IMF6 scales. Only one Hurst exponent H (H ≈ 1) is obtained for the IMF7 and residual r. Thus, it can be perceived that using EMD to strip out the different scale signals can complete the separation of the dynamic signals with different characteristics. More directly, this shows that the system dynamic signals of different characteristics can be distinguished by Hurst analysis.
Figure 11. The Hurst analysis results of the gray signals of different operating parameters.
Therefore, the multiscale fractal characteristics of dust collectors in gas–liquid two-phase flow can be obtained from the Hurst analysis. As is shown in , under different liquid levels and gas velocities, the detail signals of 1–2 scales show single fractal features, for which they have only one Hurst exponent. These features signify that the signals under these two scales exhibit the micro-scale dynamic distribution characteristic of the dust collector flow, which reflects the interactions amongst the single dust collectors in the dust chamber, including single droplet motion, impact, secondary breakup; instantaneous rupture of liquid curtain, single bubble generation, breaking and coalescence, the liquid surface self-competition and coordination, and so on.
The detail signals of 3–6 scales manifest dual fractal characteristics. Amongst these, each scale has two distinct Hurst exponents, H1 and H2. The H1, at small τ, is much larger than 0.5, representing persistent dynamic behavior. The H2, at larger τ, represents more complex dynamic behavior. This indicates that the detail signals at the 3–6 scales reflect the interaction between the gas phase and the liquid phase. The H1 implies that the random behavior features of dust collector flow at these scales, including the behavior of droplet aggregations that are scattered to the liquid surface, along with the liquid curtain after instantaneous rupture and the decomposition, movement and amalgamation of bubble aggregations below the liquid surface. Furthermore, there are the processes of production and closure of the concave pit of the liquid surface, and so on, containing more random components of these processes. Therefore, persistent movement of gas–liquid two-phase flow is observed under smaller values of τ, while the H2 value denotes the dynamic behaviors of the dust collector aggregations, intermingling with persistent and non-persistent characteristics, which describes the complex coupling behavior of the trapping aggregates during their movement.
The 7 scale detail signal and the residual r profile signal are only one Hurst exponent of close to 1, indicating the macroscopic dynamic stability of the gas–liquid two-phase flow and the macro-scale effect between the collectors and the wall of the wet scrubber. Thus, it can be observed that these produce the motion of the different scales, during the interaction of dust collectors, which results in the generation of chaos signal.
Multiscale characteristic analysis of grayscale signals
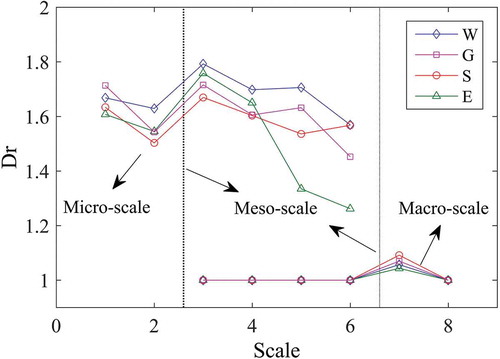
According to the change rule of Hurst exponents for different flow patterns, the change of the fractal dimensions of each scale under four typical flow patterns is shown in , where W, G, S and E represent weak fluctuation patterns, gas/liquid resonance patterns, shear liquid curtain patterns and entrainment bubble patterns, respectively. On the basis of the change rule of Hurst exponents for different flow patterns, the standard of scale division for the grayscale signals is established. The grayscale signals can be divided into micro-scale (1–2 scale), meso-scale (3–6 scale) and macro-scale (7–8 scale), which reflect the motion behaviors of single dust collectors, dust collector aggregations, and the whole flow trend behavior, respectively. It is not difficult then to establish that the variation trend of the fractal dimension in different flow patterns is essentially consistent. The difference between the fractal dimension and the Hurst exponents of detail signals under 1–2 scale indicates that the movement behavior characteristics of microscopic objects (such as single droplets or bubbles) at these scales are more often single and simple. While the fractal dimension and Hurst exponents of the detail signals under the 3–6 scale are very close, implying that there are many kinds of coupling process between the gas and the liquid at these scales, and the flow behavior of the gas–liquid two-phase flow is more complicated. At the same time, the fractal dimension and the Hurst exponents in 7–8 scale show a slowing trend, denoting that the flow of gas and liquid phase in these scales is more stable and has stronger determinacy. Self-evidently, under different flow patterns of the gas–liquid two-phase flow, the three scales share different proportions of energy.
Figure 12. Fractal dimension versus scale for different collector flow patterns.
Due to the intensity values representing the effect of the coupling between gas and liquid on different scales, test measurements can be taken, and these were carried out to verify the proportions of energy contributed by the micro-scale, meso-scale and macro-scale subsets, respectively.
For these seven groups of IMFs after EMD, the relative energy contributions under different collection efficiencies for the four flow patterns are shown in . It can be observed that the energy percentages of the three scales are inconsistent in their differing collection efficiencies. The energy percentages of the micro-scale dominate when the collection efficiency is about 20% in a weak fluctuation pattern ( (B1)), which is about 95%, indicating that liquid surface self-competition and coordination is the main flow state. Under the gas/liquid resonance pattern ( (A2) and (D1)), the collection efficiency was about 30%–40%. As the liquid level is larger than 0 mm, the energy contributions of the micro-scale and the macro-scale are greater, whose sum exceeds 90%, and the energy ratio of micro-scale and macro-scale is about 1:1, denoting that most of the dust collectors are single droplets or bubbles at this point. While the liquid level is less than 0 mm, the energy contribution of micro-scale and meso-scale phenomena is greater and is about 90%, and the energy ratio of micro-scale and meso-scale is approximately 1:1, implying that most of the dust collectors are single droplets or their aggregations in this case. This is because the gas phase could carry more liquid into the dust chamber and then form more dust collector aggregations as the liquid surface fluctuation reaches a peak in the choke area. When it is in the shear liquid curtain pattern ( (B4)) and entrainment bubble pattern ( (E4)), the collection efficiency is 85.36% and 97.51%, respectively. The proportion of micro-scale and meso-scale energy in these two patterns is about 90% of the total. Besides, the micro-, meso- and macro-scale energy ratio of the latter is about 6:3:1, implying that the energy of dust collector aggregation coupling occupies about half of that of corresponding single dust collectors’ motion.
Figure 13. The relative energy contributions rule of different scale dust collectors at different collection efficiency.
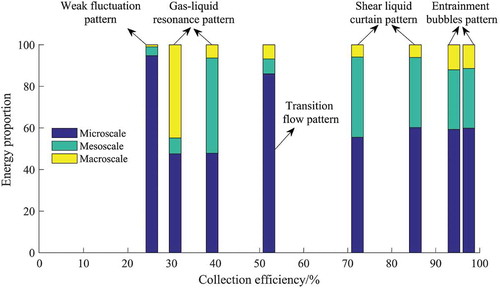
Based on the analysis described above, with the rise of the initial liquid levels and the increase of gas velocity, it can be seen that micro-scale and meso-scale dust collectors have a higher contribution to the effectiveness of dust removal. In addition, when the dust removal effect is closer to ideal, the energy percentages of these two scales nearly reach 90% and their energy ratio is about 2:1. The above analysis results are consistent with the WVD rule.
Conclusion
To better understand the multiscale dynamic distribution characteristics of dust collectors in a wet scrubber, a method for quantizing the relative contributions and exploring motion behaviors of the three main size scales of fluid flow is proposed, based on WVD analysis, EMD and Hurst analysis. The findings then can be summarized as follows.
The WVD analysis for grayscale signals of gas–liquid two-phase flow images from the high-speed camera can be used effectively to observe the energy distribution details of different flow patterns under the time and frequency scale, which is helpful to understand the transformation rules for gas–liquid two-phase flow at different frequency bands and time periods. Additionally, it provides a new effective analysis method for further exploring of the evolution characteristics of dust collectors from overall the point of view.
Hurst analysis is carried out on preprocessed signals, which come from the EMD results for the gray signal. The analysis results showed that the grayscale signals of the gas–liquid two-phase flow have clear fractal characteristics. Specifically, the single fractal features of the micro-scale subset of dust collectors conform to the dynamic distribution characteristics of single droplets and bubbles in the dust chamber. The dual fractal characteristics of the meso-scale subset of dust collectors denote the dynamic distribution characteristics among dust collector aggregations. In addition to the fractal feature of the macro-scale subset reflects the macroscopic stability of the gas–liquid two-phase flow.
The multiscale characteristics of dust collectors in gas–liquid two-phase flow could be investigated by determining the relative energy contributions of the micro-, meso- and macro-scale subsets for the grayscale signals, respectively. When the dust removal effectiveness is more ideal, the sum of the micro-scale and meso-scale energies accounts for about 90% of the total, and their energy ratio is about 2:1. This indicates that the relative contributions to the effectiveness of dust removal of the micro- and meso-scale subsets then are both at a maximum and that of the macro-scale subset is minimal.
The proposed multiscale analysis method based on image fields enables the dynamic distribution characteristics of dust collectors in a wet scrubber’s gas–solid two-phase flow to be extracted. This provides the necessary theoretical foundation for the next technological innovation through which to break through the bottleneck of removal efficiency of the fine dust.
Additional information
Funding
Notes on contributors
Tao Wei
Tao Wei and Dongxue Wang are Masters candidates at the School of Chemical Engineering and Technology in China University of Mining and Technology, People’s Republic of China.
Xiaochuan Li
Xiaochuan Li is an Associate Professor in the School of Chemical Engineering and Technology at China University of Mining and Technology, People’s Republic of China.
Yang Liu
Yang Liu is an Associate Professor in the School of Nuclear Science and Engineering, North China Electric Power University, People’s Republic of China.
References
- Bai, B., and J. Chen. 2004. Multiscale analysis of pressure fluctuation in vertical upward bubbly flow. J. Eng. Thermophysics. 25 (3):427–30.
- Cheng, W. 1993. The mechanism study of dust capture of self-impingement scrubber in heading face. J. China Univ. Min. Technol. 22 (3):67–73.
- Ding, H., Z. Huang, Z. Song, and Y. Yan. 2007. Hilbert–Huang transform based signal analysis for the characterization of gas-liquid two-phase flow. Flow. Meas. Instrum. 18 (1):37–46. doi:10.1016/j.flowmeasinst.2006.12.004.
- Dong, F., N. Jin, Y. Zong, and Z. Wang. 2008. Multiscale recurrence quantification analysis of the dynamic characteristics of two phase flow pattern. Acta. Phys. Sin. 57 (10):6145–54.
- Fan, C., H. Zhao, and X. Chen. 2014. Characterization of gas-liquid two phase flow regime based on EMD entropy. J. East China. Univ. Sci. Technol. 40 (1):81–85.
- Fang, L., Y. Liang, Q. Lu, X. Li, R. Liu, and X. Wang. 2013. Flow noise characterization of gas-liquid two-phase flow based on acoustic emission. Measurement 46 (10):3887–97. doi:10.1016/j.measurement.2013.07.032.
- Hu, G. 2015. Modern signal processing tutorials. Cham: Tsinghua university press.
- Huang, N., Z. Shen, S. Long, M. Wu, H. Shih, and Q. Zheng. 1998. The empirical mode decomposition and the Hilbert spectrum for nonlinear and non-stationary time series analysis. Proc. Math. Phys. Eng. Sci. 454:903–95. doi:10.1098/rspa.1998.0193.
- Hurst, H. E. 1951. Long-term storage capacity of reservoirs. Trans. Am. Soc. Civ. Eng. 116 (12):776–808.
- Li, H., Y. Zhou, B. Sun, and R. Yang. 2010. Multiscale chaotic analysis of the characteristics of gas-liquid two-phase flow patterns. Chin. J. Chem. Eng. 18 (5):880–88. doi:10.1016/S1004-9541(09)60143-9.
- Li, X., T. Wei, D. Wang, H. Hu, L. Kong, and W. Xiang. 2016. Study of gas-liquid two-phase flow patterns of self-excited dust scrubbers. Chem. Eng. Sci. 151:79–92. doi:10.1016/j.ces.2016.05.010.
- Li, X., W. Xiang, H. Hu, S. Jiang, T. Wei, and D. Wang. 2017. Mesoscale behavior study of collector aggregations in a dust scrubber. J. Air Waste Manage. Assoc. 68 (1):1–19.
- Li, X. C., H. B. Hu, D. Xiao, D. X. Wang, and S. G. Jiang. 2019a. Analysis of the spatial distribution of collectors in dust scrubber based on image processing. J. Air Waste Manage. Assoc. 69 (6):764–77. doi:10.1080/10962247.2019.1586012.
- Li, X. C., T. Wei, X. H. Xu, R. M. Knight, and J. H. Li. 2019b. Study of the pressure drop in dust scrubber affected by liquid flowability. Proc. Inst. Mech. Eng. Part E 233 (5):1066–73. doi:10.1177/0954408919836361.
- Li, X. C., X. H. Xu, M. R. Zhang, and Y. K. Jiao. 2019c. Column dust scrubber based on the orifice plate to intensify the gas-liquid mixing. Chem. Eng. Technol. 42 (11):2302–09. doi:10.1002/ceat.201800685.
- Liu, S., Z. Jiang, and L. Jin. 1998. Theoretical analysis of de-dust mechanism of wet scrubbers. J. Cent. South Univ. 27 (1):84–88.
- Sun, B., M. Xu, and X. Duan. 2011. Multiscale fractal characteristic analysis of gas-liquid two-phase bubbly flow in horizontal pipe. Proc. Chin. Soc. Electr. Eng. 31 (14):77–83.
- Sun, B., J. H. Zhang, L. Cheng, and Y. X. Zhao. 2006. Flow regime identification of gas-liquid two-phase flow based on HHT. Chin. J. Chem. Eng. 14 (1):24–30. doi:10.1016/S1004-9541(06)60033-5.
- Wei, T., X. Li, and D. Wang. 2020. Identification of gas-liquid two-phase flow patterns in dust scrubber based on wavelet energy entropy and recurrence analysis characteristics. Chem. Eng. Sci. 217:115504. doi:10.1016/j.ces.2020.115504.
- Wu, J., H. Meng, Y. Yu, and B. Gong. 2009. Multiscale and multi-fractal characteristics of tube-pressure signals in Kenics static mixer. J. Chem. Indu. Eng. Soc. China. 60 (8):1965–73.
- Zheng, G., and N. Jin. 2009. Multiscale entropy and dynamic characteristics of two phase flow patterns. Acta. Phys. Sin. 58 (7):4485–92.
- Zhou, Y., and P. Zhao. 2012. Vibration fault diagnosis method of centrifugal pump based on EMD complexity feature and least square support vector machine. Energy Procedia 17:939–45. doi:10.1016/j.egypro.2012.02.191.