
 ?Mathematical formulae have been encoded as MathML and are displayed in this HTML version using MathJax in order to improve their display. Uncheck the box to turn MathJax off. This feature requires Javascript. Click on a formula to zoom.
ABSTRACT
The increase in solid waste generation has been a major contributor to the amount of Greenhouse gases (GHGs) present in the atmosphere. To some extent, a great chunk of these GHGs in the atmosphere is from landfill. This study assesses two theoretical models (LandGEM and Afvalzorg models) to estimate the amount of landfill gas (LFG) emitted from Thohoyandou landfill site. Also, the LFGcost Web model was used to estimate the cost and benefits of the implementation of an LFG utilization technology. The Thohoyandou landfill started operations in the year 2005 and it is proposed to reach its peak at approximately in the year 2026. The LandGEM calculates the mass of landfill gas emission using methane generation capacity, mass of deposited waste, methane generation constant and methane generation rate. Meanwhile, the Afvalzorg model determines the LFG emissions using the Methane correction factor, yearly waste mass disposal, waste composition, Degradation Organic Carbon, methane generation rate constant, LFG recovery efficiency. The study findings indicate that the methane (CH4) and carbon dioxide (CO2) emitted from the landfill estimated from LandGEM will peak in the year 2026 with values of 3517 Mg/year and 9649 Mg/year, respectively. Results from the Afvalzorg model show that CH4 emission will peak in the year 2026 (3336 Mg/year). The LandGEM model showed that the total LFG, CH4 and CO2 emitted from the landfill between 2005 and 2040 are 293239.3 Mg/year, 78325.7 Mg/year and 214908.6 Mg/year, respectively. The simulation from the Afvalzorg model found that the CH4 emitted from the years 2005– 2040 is 74302 Mg/year. The implementation of an LFG utilization technology was economically feasible from consideration of the sales of electricity generated and Certified Emission Reductions (CER) (carbon credits).
Implications
The methane (CH4) and carbon dioxide (CO2) emitted from the Thohoyandou landfill estimated from LandGEM will peak in the year 2026 at 3517 Mg/year and 9649 Mg/year, respectively. The Afvalzorg model shows that CH4 emission will peak in the year 2026 (3336 Mg/year). The LandGEM model showed that total LFG, CH4 and CO2 emitted from the landfill between 2005 and 2040 (Mg/year) are 293,239, 78,325 and 214,908, respectively. The simulation from the Afvalzorg model found that CH4 emitted from years 2005– 2040 is 74,302 Mg/year. Therefore, implementation of LFG utilization is economically feasible from sales of electricity generated and Certified Emission Reductions.
Introduction
“The world’s Municipal Solid Waste (MSW) is about 1.3 billion tonnes/year with a projected increase to about 2.2 billion tons/year in 2025” (Hoornweg and Bhada-tata Citation2012). The proper management of these wastes is of utmost importance. In Africa, some cities and regions generate MSW at approximately 5 × 10⁻³ tonnes per person per day and could reach 8 × 10⁻³ tonnes per person per day in extreme cases (EGSSAA Citation2009). However, in developed countries, MSW generation is estimated to reach approximately 0.1–2 kg per person per day (EGSSAA Citation2009). South Africa generates approximately 100 million tonnes of general solid waste every year; an average person in South Africa generates about 8 × 10⁻⁴ tonnes of waste per day (3 × 10⁻⁴ tonnes in low-income households and 13 × 10−3 tonnes in high-income households); which is almost the average amount of waste/person generated in developed countries (Ogola, Chimuka, and Tshivhase Citation2011). Approximately 90% of these South African’s waste is deposited in landfills; meanwhile, 85% of the world’s municipal solid waste is deposited in landfills (WWF, Citation2017). These landfills are associated with pollution, which includes, litters, dust, odor, emissions of LFG, which constitutes mostly greenhouse gases like CH4, CO2, and non-methane organic compounds (NMOC) (Health Protection Agency Citation2011).
The processes involved in the formation of LFG in a landfill include; bacterial decomposition, chemical reactions and volatilization of organic waste present in a solid waste landfill (Heyer, Hupe, and Stegmann Citation2013). However, the main process of LFG production is the bacterial decomposition of the solid waste deposited in the landfill.
The decomposition of the waste deposited in the landfill emits different LFGs which are mainly methane (CH4) and carbon dioxide (CO2) and other trace gases (Njoku et al. Citation2018). The amount and flow rate of CH4 and CO2 emitted from a landfill site vary depending on the organic nature of the waste deposited in the landfill. However, Williams (Citation2001) gives a breakdown of the percentages of the components of an LFG emitted in a landfill site, which includes; CH4 (45–60%), CO2 (40–60%), nitrogen (2–5%), oxygen (0.1–1%), hydrogen (0–0.2%), carbon monoxide (0–0.2), ammonia (0.1–1%), NMOCs (Non-Methane Organic Substance) (0.01–0.6%) and sulfide (0–1%). Daura, Enaburekhan, and Rufai (Citation2014) indicate that the continuous emission of these LFG into the atmosphere can cause severe damage to the environmental media, unless proper management strategies are put in place to reduce the LFG emitted into the environmental media. LFG can be estimated using several methodologies including model simulations.
Taherian, Adl, and Sharghi (Citation2016) used the LandGEM and the Afvalzorg models to simulate the LFG potential generation in Halgheh-Darreh landfill (Iran). The results show that the LandGEM’s results, by the mean of practical value of methane potential was closer to a realistic situation than the Afvalzorg model. The results obtained from the run of the LandGEM model was 1426.94 m3/ton and 901.82 m3/ton (for theoretical and practical results of estimated methane generation potential (L0), respectively). While the results obtained from the Afvalzorg’s model simulations were 5200 m3/h and 4000 m3/h (theoretical and practical values of L0, respectively). Mou, Scheutz, and kjeldsen (Citation2015) used Afvalzorg, LandGem and IPCC models to estimate LFG from the Danish waste disposal site receiving low organic waste content. The results showed that the LandGem model estimates the largest amount of CH4 emitted from the landfill, the IPCC model estimates 25–33% of the LandGEM’s results. The Afvalzorg model estimated 10% of the LandGEM’s results. The Afvalzorg model was found to be more convenient in the estimation of LFG from landfills receiving low organic waste because of its multi-phase category abilities. Nonetheless, the Afvalzorg model requires a lot of data that are easily accessible from most landfills in developed countries from landfill operators (Mou, Scheutz, and Kjeldsen Citation2015). Although Mou, Scheutz, and kjeldsen (Citation2015) is a great resource, Krause, Chickering, and Townsend (Citation2016) showed how to translate L0 to DOC for LandGEM and Afvalzorg in a similar way as the authors are trying here. The main differences Mou, Scheutz, and kjeldsen (Citation2015) reported are due to the parameter values in the different models. If LandGEM L0 is 100 m3/Mg and DOC is 0.1 g C/g MSW then you will get different methane generation values. Krause, Chickering, and Townsend (Citation2016) clearly identify how to translate DOC to L0 using the other parameters DOCf, F, MCF, the CH4/C ratio, and methane density. Mou, Scheutz, and kjeldsen (Citation2015) results diverge mostly because of the difference of DOC and L0 used in the analysis.
Some other studies that over the years have used other landfill gas models like LandGem, IPCC, Afvalzorg, Erigh and GasSim model (Bella, Di Trapani, and Viviani Citation2011; Bhailall et al. Citation2010; Donovan et al. Citation2009; Larsson Citation2014). Although there are various models used in the estimation of LFG, as shown above, this study focused on the use of the Afvalzorg and LandGEM models for the estimation of LFG. However, the above examples were based on one or few landfills, different regions, different waste composition types and different landfill types. Hence, resulting in the uncertainty in the use of the different models (Scharff and Jacobs Citation2006). Therefore, for the validation of the models, a larger set of parameters were used (Oonk Citation2010). For the different models given above, parameters such as availability, ease of operation, required input, waste changes, climatic zone, scientific basis, transparency, accuracy and validation were used to validate the models (Oonk Citation2010).
It is also very beneficial to utilize the gases emitted from landfills. The proper management of landfill waste has great potential of reducing GHG and air pollution, produce fuel for motor vehicles, generate electricity, provide jobs, etc. Gases generated from landfill contain a lot of impurities than pipeline natural gas; therefore, many organizations (like eThekwini Municipality LFG project; New England LFG energy project; Environserv Chloorkop LFG recovery project (registered 27th April, 2012); Alton LFG project (registered 24thAugust, 2009) and Ekurhuleni LFG project) use LFG to produce electricity rather than for cooking (Njoku et al. Citation2018). Previous studies have used the use of LFGcost Web model to simulate the cost benefit and analysis for the potential implementation of an LFG utilization technology (Boodhan Citation2014; Jangikhatoonabad Citation2015).
Several methods have been reviewed for modeling the utilization of LFGs, some of which included: Long-range Energy Alternatives Planning system (LEAP), Technology and Environmental Database model (TED) and mixed linear programming model (LP) (Ahmed et al. Citation2015; Karapidakis et al. Citation2010; Shin et al. Citation2005). The most commonly used are LFGcost web model and LEAP. The other models estimate LFG emission and utilization for electricity generation only and do not consider other LFG utilization options and cost in implementation of an LFG utilization technology (Ahmed et al. Citation2015). In this study, we used the LFGcost model because it is comparable with the LandGEM. It is only and mainly developed for the evaluation of LFG technology, cost analysis and has several advantages such as its wide application than the other models. This study seeks to find out the amount of LFG generated from the Thohoyandou landfill site and to estimate the potential energy generation and cost-benefit analysis from the implementation of an LFG utilization technology.
Methodology
Study area
The landfill is located in the Thulamela Municipality. It is the main landfill that accepts and manages MSW in the municipality. Thulamela Municipality is located 180 km from Polokwane, it is the gateway to Kruger National Park. It is located on longitudes 23°00ʹ13.0ʹʹS and latitude 30°27ʹ55.3ʹʹE. The population of Thulamela Municipality is about 584,257 people and it is characterized mainly of rural settlements (Thulamela Local Municipality Citation2017), agriculture and peri-urban areas. Thohoyandou receives approximately 752 mm of rain every year, with most rainfall occurring during mid-summer (Saexplorer Citation2017). shows the map of Thohoyandou landfill.
Figure 1. Map of Thohoyandou landfill.
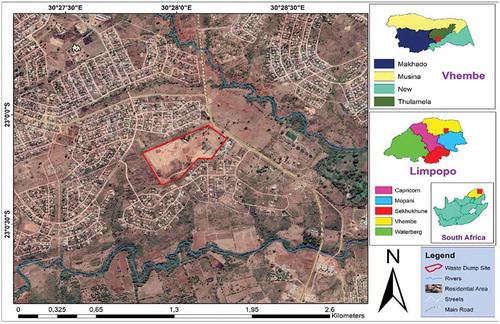
The landfill had its permit to commence operation in 2004 by the then Minister of Water Affairs and Forestry. When visited during the study, the landfill only received general MSW. Wastes that were inorganic or organic which could have definite acute chronic effects on human’s health and the environment because of its physical, chemical and toxic features and which corresponds to the United Nations Development Program’s (UNDP) definition of hazardous waste was not allowed to be deposited in the landfill. The landfill currently accepts the majority of its MSW generated in the Thulamela Municipality area and it is currently the only landfill accepting MSW in the area. The landfill has about four cells that have been closed up and a current functioning cell that is still receiving waste. The management of the landfill is constructing a proper weighing bridge for proper calculation of waste deposited. Wastes like nappies and tyres are basic challenges faced by the landfill operators because of their inability to degrade quickly, these wastes can stay for years before degradation. The garden waste is separated for composting and permitted reclaimers sort for plastic bottles and aluminum cans for recycling. The landfill is majorly faced with challenges like poor technology and inadequate machineries, loose particles of dust in the atmosphere and air pollution/odor.
Landfill gas emission model (LandGEM) (Version 3.02)
This model was developed by the U.S. Environmental Protection Agency (USEPA) in September 1998. It is a programmed tool for the calculation of emissions of total LFG, CO2, CH4, NMOCs and other air pollutants emitted from a landfill. The model is based on first-order decomposition reaction rate for the estimation of LFG. It is a comparatively simple means of estimating LFG. Default empirical data are found from the model; however,; field test data are used in place of the default data. The U.S. EPA provides an explicit users’ guide at their website. LandGEM model is accessed from USEPA website http://www.epa.gov/ttn/catc/. EquationEquation (1)(1)
(1) shows the mathematical calculations for the LandGEM model (Wang et al. Citation2013).
QCH4 = annual methane generation in the year of the calculation (m3/year)
i = increment in one year time
n = (year of the calculation) – (initial year of waste acceptance)
j = increment in 0.1 year time
k = methane generation rate (year −1)
Lo = potential methane generation capacity (m3/Mg)
Mi = mass of waste accepted in the ith year (Mg)
tij = age of the jth section of waste mass Mi accepted in the ith year.
The input data for the LandGem model include
The total amount of the MSW deposited in the landfill annually.
The year the landfill commenced operation and closing year of landfill.
The design capacity of the landfill – the total amount of waste that will be disposed in the landfill.
Potential methane generation capacity Lo.
The methane generation rate k.
The concentration of the total nonmetallic Organic Compounds NMOC.
Methane content by volume in percentage.
The model output comprises the annual emission rate of CH4, carbon dioxide, NMOC and some trace gases during the period of the lifetime of the landfill and even after closure of the landfill site. However, some of the LFG simulated from the landfill site by LandGEM considered in this study include; methane (CH4), carbon dioxide (CO2), NMOC, etc.
Multi-phase Afvalzorg model
The model was developed by R. Gronert and H. Scharff (NV Afvalzorg Holdings) in 1996 with the support of the Dutch Environmental Agency. The model is based on a first-order decay. The model simulates the total LFG and CH4 recovery and emission from landfills for which limited data of waste composition is available. The IPCC 2006 guideline for solid waste disposal sites is used and the IPCC default values are used for running the model. It is advised to use default values provided by the model unless the value can be derived by experts with an understanding of anaerobic degradation process in a landfill. Therefore, it is recommended that a comparison of result be done with the default values provided by the model. The model has eight waste categories and three fractions are distinguished when calculating LFG generation (Jacobs and Scharff Citation2001). The model is characterized by EquationEquation (2)(2)
(2) :
where αt is the landfill gas formation at a certain time (m3.y−1); ζ is the dissemination factor; i is the waste fraction with degradation waste k1,i (kgi.kgwaste−1); A is the amount of waste in place (tons); C0 is the amount of organic carbon in waste (kg.tonnewaste−1); k1,i is the degradation rate constant of fraction i (y−1); and t is the time elapsed during deposition (y). Scheutz et al. (Citation2011) used the Afvalzorg model in the estimation of LFG at a landfill receiving waste with low organic content. Data inputs necessary to run the Afvalzorg model include:
Start year of waste disposal
Waste mass deposal every year
Methane Correction Factor MCF
Waste composition of the landfill in percentage
Degradable Organic Carbon DOC in MSW
Methane generation rate constant
LFG recovery efficiency
The data for the simulation of the LFG were collected from the (waste management sector) Thohoyandou Municipality and the South African Waste Information Center (SAWIC) website for the LandGEM and Afvalzorg models. The LandGEM assumed that all gases generated are assumed to be emitted. shows the input data required for the simulation of LFG to run the LandGEM and the Afvalzorg models.
The total amount of the waste deposited in the landfill annually – Kalantarifard and Yang (Citation2012), showed that there is a positive correlation with population and socioeconomic level with waste generation. The study used population size to estimate the amount of future waste generation. However, certain factors can lead to the reduction of waste in a landfill as population increases. Factors like government policies on waste deposition in a landfill; increase in recycling; increase in incineration and increase in waste composting.
Table 3. Economic and financial results for the implementation of an LFG technology in Thohoyandou landfill site.
Table 1. Input data for the simulation of LFG to run the LandGEM and Afvalzorg models.
Therefore, to estimate waste deposition rate from 2005 to 2008 and 2020 to 2025 EquationEquation (3)(3)
(3) is used;
Pastg = past waste generation; Presentg = present waste generation; i = rate of growth which is 0.62%; n = period of year; using the population census of 2011 for Thulamela Municipality 618,462 people. The amount of waste deposited in the Thohoyandou landfill is shown in the supplementary file ().
The general waste composition in percentage – data were obtained from the SAWIC website, Thulamela Municipalities. shows the waste composition in Thohoyandou landfills.
Figure 2. Pie chart showing the average annual composition of waste present in the Thohoyandou landfill (Source: Thulamela Municipality and SAWIC website).
Ten percent of the total composition of solid waste deposited in the Thohoyandou landfill is considered to be inert waste and includes; sand, ceramics, tiles, gravels, bricks, etc. So, only 90% of total waste deposited in the landfill was input to the LandGEM model.
Degradable Organic Compound (DOC) – the Afvalzorg model gives different default values for different regions in the world. The default value of DOC for the Southern African region is shown in .
Table 2. Value of DOC in Southern African region.
Sensitivity analysis
Also, k value was calculated from
where x is the average annual rainfall of the area (Daura, Enaburekhan, and Rufai Citation2014)
However, the average rainfall in Thulamela Municipality is 500 mm according to the IDP 2016/2017 financial report for Thulamela. Therefore, k = 0.026 year−1 for Thohoyandou landfill. Therefore, the sensitivity analysis was carried out to check the sensitivity of the modeled result derived from the model. The model checked for the degradable constant k at 0.03 year−1 for both models.
Estimation of the cost analysis and benefit for the implementation of the LFG utilization project
LFGcost web model
The landfill gas energy cost model (version 3.3) was used to determine economic analysis and the feasibility of implementing the LFG utilization technology. The software was created in Microsoft Excel to make the computations transparent and determine the initial economic feasibility in the conversion of LFG to energy project (LFGcost Web user manual). The model is grounded on default characteristics of a landfill, as well as additional user input data which produces outputs in various proportions for the LFG utilization project.
The model is implemented on four types of electricity-generating technologies, which are internal combustion engines (15-year lifetime), gas turbines (15-year lifetime), microturbines (10-year lifetime) and small engine. The main tools for determining the feasibility of the LFG to energy project are the net present value (NPV) and the internal rate of return (IRR), which are the main criterion used for either accepting or rejecting projects in cost-benefit analysis. The NPV is the present value of net cash flow and the project is executed if the NPV is equal to zero or greater than zero, and rejected if the NPV is less than zero. Also, IRR value can also be used to determine the viability of an LFG utilization project. If the IRR is greater than the discount rate the project is viable.
The input data to run the LFGcost Web model for the Thohoyandou landfill include:
Landfills open and closure years – refer to
Area of Landfill wellfield to supply project (acres) – 20 or 40
The total amount of the municipal solid waste deposited in the landfill annually – refer .
Landfill energy project type – this study looks at three LFG project types including standard turbine, standard engine, microturbine and combined heat and power system CHP. To evaluate the most appropriate engine type for the project.
Year LFG project began operation – 2024 for Thohoyandou landfill.
Distance of landfill to end user – 5 km
Methane generation rate constant k (year−1) – refer .
Potential methane generation capacity L0 (ft3/ton) – 3,204.
Methane content of LFG in % – 50%
Average depth of landfill (ft) – 65 ft
LFG collection efficiency (capped with plastic liners) – 85%
Expected LFG energy project time (years) – 15 years but 10 years for microturbine engines
Loan lifetime (years) – 10
Interest rate (%) – 6.75
Inflation rate (%) – 4.1
Equipment inflation rate (%) – 4.1
Marginal tax rate (%) – assuming a 35
Discount rate (%) – 8
Down payment for the project – 50% and 100% for decreasing the amount of years to pay back for the project.
Annual product price escalation rate (%)- 2.2
Equipment escalation rate (%) – 2.9
Electricity purchase price for projects not generating electricity (R/kWh) – 0.08 kWh USD at a rate of 1 USD to 14.21 rand.
Annual electricity purchase price escalation rate (%) – 2.2%
Results and discussion
Results derived from the LandGEM model simulation
The LandGEM simulated the total LFG emissions for Thohoyandou landfills. The components of LFG simulated by the LandGEM include total LFG, CH4, CO2 (which are the most dominant gases emitted from the landfill) and NMOC. In supplementary file () shows the results obtained from the LandGEM model.
The LandGem model simulated the total LFG emission over a period of about 120 years after the closure of landfill. The results obtained from the model after processing includes;
Total LFG, CH4, CO2 and NMOC generated from the Thohoyandou landfill site until 2145.
The graph shows () the rate of emissions over the years for different LFG.
Figure 3. Graphical representation of the CH4 and CO2 emitted from Thohoyandou landfill site using the LandGEM model.
The LandGem model shows that CH4 and CO2 are the major gases found in the landfill. The LFG emitted from the Thohoyandou landfill increases with an increase in waste deposition over time and it peaks with the closure of the landfill. gives the results of the LFG generated by the LandGem model. The maximum projected emission of CH4 and CO2 was in 2026 with values of 3517 Mg/year (5.271 × 10⁶ m3/year) and 9649 Mg/year (5.271 × 10⁶ m3/year), respectively. This is because in 2025, the Thohoyandou landfill is expected to be closed; therefore, the deposition of solid waste in the landfill will cease. The LFG production starts to decline until all degradable waste buried in the landfill is degraded as shown in . This inference is in line with results obtained from Liphoto (Citation2001); Bhailall et al. (Citation2010); Kalantarifard and Yang (Citation2012); Aydi (Citation2012). However, Aydi (Citation2012) conducted a subsurface estimation of LFG using the LandGEM model; the result shows that the total LFG emitted from the landfill peaked 1 year after the closure of landfill site. This study agrees with the results derived from Aydi (Citation2012). Aydi (Citation2012) showed that the peak LFG generation took place 1 year after the landfill closure (2011) with a rate estimated to be 2.61 × 10⁷ m3/year.
Gardner, Manley, and Pearson (Citation1993) show that the total rate of emission of CH4 is usually less than CO2 emissions from a landfill due to the difference in masses of both gases. Hence, this supports the results from the LandGEM model derived from this study, also large quantities of CH4 oxidize microbiologically to CO2 within the landfill cover soil before reaching the atmospheric environment. This, however, leads to the loss of CH4. The total CO2 and CH4 emitted from the Thohoyandou landfill between the years 2005 to 2040 is 214908.6 Mg and 78325.7 Mg, respectively. The factors contributing to CH4 oxidation capacity of the soil include; soil moisture content (optimum oxidation occurs at 15–20% moisture content), soil temperature (optimum oxidation occurs at 30–35°C in soil), presence of methanogen bacteria in the landfill, soil type and thickness of cover.
During the post-closure years of the landfill, the LFG generated declined over a period of 120 years and the LFG became insignificant at around 80 to 100 years. Therefore, it shows that from the landfill site, traces of LFG still evolve over the years after closure. The drop of LFG generation is due to the insufficient or no degradable waste deposited in the landfill. The continuous emission of LFG from the landfill after closure is due to the slow bio gasification of biodegradable waste. shows the graphical representation of the LFG generated from the Thohoyandou landfill site and the LFG generated was estimated to continue emission up to 2145 using the LandGem model. This result agrees with Rezaee (Citation2014) who estimated the LFG from the year 2000–2143. Also, Bhailall et al. (Citation2010) and Liphoto (Citation2001) estimated the total LFG emissions up to 200 years after the opening of landfill.
Results derived from the Afvalzorg model simulation
The Afvalzorg model simulated the total LFG emission over a period of about 60 years from the opening of landfill. The results obtained from the model after processing include
The graph showing the rate of emission of total LFG and CH4 over the year.
Total CH4 generated from the Thohoyandou landfill site until 2060.
The Afvalzorg model simulates only the total LFG and CH4 unlike the LandGEM model. The model shows that as LFG emitted from the Thohoyandou landfill increases with the increase in waste deposition over time and the LFG peaks as the landfill closes. As shown in the supplementary file (), the maximum projected emission of the total LFG and CH4 will be in 2026 with values of 1,067 m3 STP/h and 3,336 Mg/year, respectively. After the closure of the landfill, the total LFG emitted began to reduce over a period of about 50 years and the LFG became insignificant. The drop of LFG generation can be attributed to the lack of MSW deposition in the landfill, resulting in the reduction of biodegradable substances present in the landfill. The continuous emission of LFG from the landfill after closure is due to the slow bio gasification of biodegradable waste. shows the graphical representation of the LFG generated from the Thohoyandou landfill site and the LFG generated was estimated to continue emission up to 2060 using the Afvalzorg model.
Figure 4. Graphical representation of CH4 emitted from Thohoyandou landfill site using the Afvalzorg model (k value = 0.05).
Comparison of results from the LandGEM and Afvalzorg simulations for Thohoyandou landfill
The comparison of the two results of the models is based on the ability to get a more precise and exact simulation of the LFG. The two most dominant gases simulated by the LandGEM are CH4 and CO2, which are also very strong GHG present in the atmosphere. Since the Afvalzorg model only simulates the total LFG and the CH4 emissions, the comparison was based on the CH4 emitted using the two models. The models show for Thohoyandou landfill that the CH4 peaked in the year 2026 with the LandGEM reaching a peak CH4 emission of 3517 Mg/year and Afvalzorg model reaching 3,336 Mg/year. However, the total potential emission of CH4 from the year 2005–2040 recorded by the LandGEM and the Afvalzorg models are 78325.7 Mg/year and 74302 Mg/year, respectively. The two models generated nearly similar results from the simulations. However, the results derived from the LandGEM model are estimated to be higher than the results from the Afvalzorg model. gives the graphical representation of the CH4 emitted using the Afvalzorg and LandGEM models. The figure also illustrates a gradual emission of these LFG from the time of landfill opening for the Thohoyandou landfill until the LFG emitted becomes insignificant over time.
Figure 5. Comparison of the simulation of CH4 using the Afvalzorg and LandGEM models for the Thohoyandou landfill site.
Sensitivity analysis
Sensitivity analysis was done in order to understand the model's reactivity to different input parameters. Furthermore, the sensitivity analysis is also important to acquire different possible results based on different possible potential parameters. The sensitivity of these models was conducted based on the k value. The two scenarios for the k value are 0.05 year−1 (IPCC default value) and 0.03 year−1 using EquationEquation (4)(4)
(4) (Daura, Enaburekhan, and Rufai Citation2014).
The graphical results of the LandGEM and Afvalzorg model are shown in and , respectively.
Figure 6. Graphical representation CH4 emitted from Thohoyandou landfill site using the LandGEM model at k = 0.03 and 0.05.
Figure 7. Graphical representation of CH4 emitted from Thohoyandou landfill site using the Afvalzorg model at k = 0.03 and 0.05.
The average annual rainfall and temperature are key determining factors to derive the k value; therefore, the lower the k value the lower the amount of LFG emitted from the landfill. shows the CH4 simulation for the landfill using the LandGEM model at K = 0.03 and 0.05. The CH4 emissions peaked in the year 2026 and the maximum emission of CH4 was 2520 Mg/year at K = 0.03. However, shows the result derived from the Afvalzorg model using k = 0.03 year−1, which shows the LFG peaked in the year 2026 and the maximum emission of CH4 from the landfill was 2,393 Mg/year. The results derived from the models are lower than the results derived when k = 0.05 year−1. This sensitivity analysis shows that the models are very sensitive to the input parameters.
Afvalzorg model
Limitations of the models
The models used in the study had some limitations that were encountered during the study. It is paramount we highlight these limitations.
The LandGEM model simulates about 51 gases out of approximately 300 LFG emitted from a landfill; however, the Afvalzorg model is only able to simulate the total LFG and CH4 emitted from the landfill. This was a challenge using the Afvalzorg model as we were not able to simulate the CO2 and other trace gases in the landfill using the Afvalzorg model.
The LandGEM model does not estimate the percentage by volume of the NMOC, it only allows for the estimation by volume of CH4 and CO2. However, the Afvalzorg model only recognizes the CH4 gas from the total LFG and does not give room for the computation of percentage by volume.
The Afvalzorg model in its simulation of the LFG only simulates the consecutive 60 years after the opening of landfill. However, the LandGEM model can simulate up to 200 years of LFG emission after landfill opening.
The LandGEM model does not allow for the estimation of the waste composition of the waste deposited, though this is a very important factor in LFG simulation. This is because not all waste has the same biodegradable ability, some wastes take 5 to 10 years before it decays. Afvalzorg model allows for the estimation to show the different compositions of waste, which helps to assume a better degradable ability of the waste deposited and Total LFG emission.
Some characteristics that are very important in the degradation process of waste are not fully represented in the LandGEM model, e.g. the oxidation factor, temperature, moisture content, DOC, DOCf.
The models did not take into account the seasonal variation of the landfill site, which is very important in the estimation of LFG. In Thohoyandou landfill during summer, the landfill tends to be very hot; however, when rainfall occurs, the landfill area is wet and this brings about more LFG emission and also increases the smell emitted from the landfill.
Results and discussions of the cost analysis and benefits for the implementation of the LFG utilization technology in Thohoyandou landfill
The cost analysis, benefits, electricity generated, environmental and economic viability of LFG utilization technology in Thohoyandou landfill site were estimated. The LFGcost web model was used to carefully determine the cost and economic benefits of an LFG utilization technology. shows the results derived from the LFGcost model for the Thohoyandou landfill.
The results derived from the Thohoyandou’s LFG utilization project, assuming the area of landfill to supply project is 20 wells to 50% and 100% down payment shows that all the conventional engines are negative and none for the Internal Rate of Return (IRR) and years of breakeven values, respectively. Therefore, results confirm that if an LFG utilization project is implemented in the Thohoyandou landfill site, the microturbine will be the cheapest engines for the LFG project, based on the current posed scenarios. However, based on the above scenario, no engine showed to be economically feasible to conduct the LFG project. In Ghana, the LFG cost model was used to investigate the economic feasibility, environmental and social impacts of an LFG utilization project in Tema and Tamale landfills. The study revealed that the Tamale landfill will not be environmentally feasible for an LFG utilization project installment. However, the Tema landfill will be economically feasible only for the installation of a microturbine engine in the landfill. Other engines showed not to be economically feasible.
For the LFG utilization project of LFG well field to supply project of 40 wells. The results from , show that at 50% and 100% down payment for the LFG utilization technology in Thohoyandou landfill site shows that all engines are expensive and not economically feasible for implementing an LFG utilization plant. This is based on the NPV and high negative IRR values. However, microturbine engine is considered the cheapest technology LFG utilization project.
Table 4. The conversion of methane to tonnes of CO2e for Thohoyandou landfill.
Table 5. Annual electricity generated in kWh for the different LFG engines for Thohoyandou landfill.
Table 6. Average electricity per year generated and the number of household beneficiaries from the Thohoyandou landfill site project.
Environmental and economic benefits of an LFG utilization project in Thohoyandou landfill
The implementation of an LFG utilization technology is not usually an economically viable venture to embark on, considering the cost of implementation and the rate of returns on sales of electricity. However, the sales of carbon credits in the international market can be profitable for the LFG utilization project to be considered. For example, the Durban LFG utilization project, component one (Mariannhill and La Mercy landfill sites) sold a 700,000 Certified Emission Reduction (CER) in 2005 for 14 years to the Prototype Carbon funds of the World bank for 3.95 USD (56.1 Rands) per tonne of CO2 (Couth et al. Citation2011). However, component 2 (Bisasar landfill) produced 3.1 million CER, the eThekwini Municipality signed a deal with Trading Emission PLC till 2012, which sold to the international market. In 2009 the price of CO2 emission increased in the international carbon market which ranged from 11 USD (156.31 Rands) – 16.3 USD (231.623 Rands) per tonne of CO2 equivalent (CO2e), but the price is determined based on the highest bidder (Couth et al. Citation2011).
This study calculates the tonnes in CO2e destroyed by the implementation of an LFG utilization technology to determine the environmental benefits and calculate the potential price of the CER sale of the CO2 emitted from the landfill. According to Couth et al. (Citation2011) the conversion of CH4 (m3) is explicitly explained, the LandGEM model’s simulation is used to estimate the total CH4 emitted from the landfill. However, shows the CH4 emitted tonnes of CO2e and potential CER price for the Thohoyandou LFG utilization technology.
Total CO2 destroyed from the LFG utilization project is 929,000 tCO2e and the price of CER assuming 16.3 USD (231.623 Rands) per CER is 15,100,000 USD. The potential amount that can result from the sale of carbon emission is 15,100,000 USD (219,000,000 rand) assuming 1 USD to 14.5 rand. From this result and comparing with the total capital cost in , all proposed engines in this study, will be economically feasible for the implementation of an LFG utilization technology.
Electricity generated from the Thohoyandou landfill
Assuming a household in South Africa uses 2268 KWh per year (Eskom) based on the use of household electrical appliances such as fridge, freezer, dishwasher, tumble dryer, television, washing machine and household lighting. Therefore, the total household to benefit from the LFG utilization technology is shown below. shows the total yearly electricity generated from the Thohoyandou landfill using the different LFG engines.
shows the total amount of electricity (kWh) generated by the engines during the lifetime of the LFG utilization project. Standard reciprocating engines produced the highest amount of electricity, although the engine is not economically feasible to implement as an LFG utilization technology in Thohoyandou landfill based on the scenarios used in this study. Unless with the sale of Certified Emission Reduction.
Taking into consideration the fact that a South African household uses 2,267.97 KWh of electricity per year, the households that will directly benefit from the LFG utilization technology were calculated. shows the average annual electricity generated from each conventional engine in thousand ft3 and the average amount of households to benefit from the electricity generated in Thohoyandou. As stated earlier, the standard reciprocating engine produced the most and also has the highest amount of household usage. The standard reciprocating engine generates an average electricity of approximately 8174000 KWh/year and will supply an average household of approximately 4130 households. Microturbine engine generates electricity to approximately 3605 households per year and the small engine will supply electricity to approximately 2202 households every year which is the least amount of household to benefit.
However, shows the graphical representation of the total LFG generated, LFG collected and LFG utilized during the lifetime of the LFG utilization project year for Thohoyandou landfill. The graph shows that although the LFG utilization project will stop in 2038, there is still a continuous emission of LFG from the landfill site until 2043. This is because this study shows a simulation of a maximum of 15 years, and 10-year period for the microturbine engine. However, Liphoto (Citation2001) has shown that LFG can continue to be emitted from a landfill as long as 100 years after the closure of landfill site.
Figure 8. A graphical representation of the LFG generated, collected and utilized from the implementation of an LFG utilization technology in Thohoyandou landfill site.
Conclusion
The LandGEM and Afvalzorg models were used to simulate the total LFG and some of its components from the Thohoyandou landfill site. The simulation by the models shows that Thohoyandou landfill has the potential to emit LFG up to 100 years after the closure of the landfill sites. However, the LFG emissions will continue to decrease with respect to increase in years after closure. Also, it was observed that the LFG emissions will continue to increase as the waste deposited in the landfills increased. The LFG emissions will peak at the closure of the landfill site, which is when the deposition of MSW in the landfills will cease.
The LandGEM, apart from the simulations of the total LFG, can also simulate up to 60 other components of the LFG. However, this study focused on the simulations of the total LFG, CH4 and CO2. The Afvalzorg model could simulate only the total LFG and CH4 emissions for a period of 60 years after the closure of the landfill sites. The comparison of results derived from the simulation of CH4 using both models for the Thohoyandou landfill was comparable. The models were sensitive to the variation of degradability constant k from 0.05 to 0.03 yr−1. We conclude that as the value of k decreases, the total LFG emitted also decreases. The k value is a function of the average precipitation and temperature of the landfill environment.
The cost analysis and benefits for the implementation of an LFG utilization technology for Thohoyandou landfill were simulated using the LFGcost Web model. It was concluded that most of the LFG utilization engines used for this study were not economically feasible to implement an LFG utilization technology, with respect to the sales of electricity generated from the project alone. However, the sale of Carbon equivalent emitted from the landfill makes all engines in this study for the LFG utilization project to be economically feasible.
Supplemental Material
Download MS Word (20.9 KB)Disclosure statement
No potential conflict of interest was reported by the authors.
Supplementary data
Supplemental data for this article can be accessed on the publisher’s website.
Additional information
Funding
Notes on contributors
Prince Obinna Njoku
Prince Obinna Njoku is currently a Ph.D. student in the Department of Ecology and Resource Management, University of Venda. His research focus is on remediation of Environmental pollution especially on its effects on human health. He is currently focused on the possible reduction of gaseous emissions from landfills and potential reduction of its emissions on human health.
Joshua Nosa Edokpayi
Joshua Nosa Edokpayi, has a doctoral degree from the University of Venda, South Africa and a postdoctoral training from the University of Virginia, USA. He is currently a senior lecturer in the School of Environmental Sciences in the University of Venda. He is recognized and rated researcher by the National Research Foundation (NRF) of South Africa. He is basically into teaching and postgraduate training of students. His research interest include pollution assessment, impact and mitigation strategies of the environmental media including soil, air and water.
John Ogony Odiyo
John Ogony Odiyo holds a Ph.D. in Civil Engineering from the University of the Witwatersrand in South Africa. He has done extensive research in Environmental media including hydrology and water resources, soils, wastewater and air both qualitatively and quantitatively. He currently serves as the Dean of the School of Environmental Sciences at the University of Venda.
References
- Ahmed, S. I., A. Johari, H. Hashim, R. Mat, J. S. Lim, N. Ngadi, and A. Ali. 2015. Optimal landfill gas utilization for renewable energy production. Environ. Prog. Sustain. Energy 34 (1):289–96. doi:10.1002/ep.11964.
- Aydi, A. 2012. Energy recovery from a municipal solid waste (MSW) landfill gas: A Tunisian case study. Hydrol. Curr. Res. 3 (4):1–3. doi:10.4172/2157-7587.1000137.
- Bella, G., D. Di Trapani, and G. Viviani. 2011. Evaluation of methane emissions from Palermo municipal landfill: Comparison between field measurements and models. Waste Manage. 31 (8):1820–26. doi:10.1016/j.wasman.2011.03.013.
- Bhailall, S., S. Piketh, N. Smith, and J. Bogner. 2010. Subsurface gas generation at a landfill in johannesburg. Clean Air J. 18:10–13.
- Boodhan, G. 2014. An economic analysis of landfill gas to energy projects in the Island State of Trinidad and Tobago. global interdisciplinary business-economics advancement conference (giba) conference proceedings, Clearwater beach, Tampa, Florida, FL, USA, 652.
- Couth, R., C. Trois, J. Parkin, L. J. Strachan, A. Gilder, and M. Wright. 2011. Delivery and viability of landfill gas CDM projects in Africa—A South African experience. Renewable Sustainable Energy Rev. 15 (1):392–403. doi:10.1016/j.rser.2010.08.004.
- Daura, L. A., J. Enaburekhan, and I. A. Rufai. 2014. Estimation of methane gas emission from solid waste disposal sites in Kano, Nigeria. Int. J. Sci. Eng. Res. 5 (10):590–93.
- Donovan, S. M., T. Bateson, G. R. Gronow, and N. Voulvoulis. 2009. Modelling the behaviour of mechanical biological treatment outputs in landfills using GasSim model. Sci. Total Environ. 8 (408):1979–84.
- EGSSAA. 2009. US aid from the American people. Accessed September 1, 2018. http://www.encapafrica.org/egssaa/solidwaste.pdf.
- Gardner, N., B. J. W. Manley, and J. M. Pearson. 1993. Gas emissions from landfills and their contributions to global warming. Appl. Energy 44:165–74. doi:10.1016/0306-2619(93)90059-X.
- Health Protection Agency. 2011. Impact on health of emissions from landfill site, advice from the health protection agency. Accessed July 7, 2018. https://www.gov.uk/government/uploads/system/uploads/attachment_data/file/334356/RCE-18_for_website_with_security.pdf.
- Heyer, K. U., K. Hupe, and R. Stegmann. 2013. Methane emissions from MBT landfills. Waste Manage. 33 (9):1853–60. doi:10.1016/j.wasman.2013.05.012.
- Hoornweg, D., and P. Bhada-tata. 2012. What a waste, A global review of solid waste. Urban Dev. Ser. Knowl. Pap. 15:1–98.
- Jacobs, J., and H. Scharff. 2001. Comparison of methane emission models and methane emission measurements. Netherlands: NV Avalzorg.
- Jangikhatoonabad, N. 2015. Feasibility studies to support landfill gas recovery in Ghana.
- Kalantarifard, A., and G. S. Yang. 2012. Estimation of methane production by LANDGEM simulation model from Tanjung Langsat municipal solid waste landfill, Malaysia. Int. J.Sci. Tech. 1 (9):481–87.
- Karapidakis, E. S., A. A. Tsave, P. M. Soupios, and Y. A. Katsigiannis. 2010. Energy efficiency and environmental impact of biogas utilization in landfills. Int. J. Environ. Sci. Tech. 7 (3):599–608. doi:10.1007/BF03326169.
- Krause, M. J., G. W. Chickering, and T. G. Townsend. 2016. Translating landfill methane generation parameters among first-order decay models. J. Air Waste Manage. Assoc. 66 (11):1084–97. doi:10.1080/10962247.2016.1200158.
- Larsson, J. 2014. A case study of landfill gas potential at KIkas landfill. Assessment of environmental impacts and alternatives for mitigation. Msc Thesis, Department of energy and environment.
- Liphoto, L. 2001. The estimation of landfill gas emissions in the Durban Metropolitan Area (DMA) using the landgem model. MSc Thesis (Environmental Sciences), School of life and environmental Sciences.
- Mou, Z., C. Scheutz, and P. kjeldsen. 2015. Landfill gas generation and emission at danish waste disposal sites receiving waste with a low organic waste content. Proceedings Sardinia 2015: CISA publisher, Forte Village Resort at S. Margherita di Pula (Cagliari, Italy).
- Njoku, P. O., J. O. Odiyo, O. S. Durowoju, and J. N. Edokpayi. 2018. A review of landfill gas generation and utilisation in Africa. Open Environ. Sci. 10 (1):1–15. doi:10.2174/1876325101810010001.
- Ogola, J. S., L. Chimuka, and S. Tshivhase. 2011. Management of municipal solid wastes: A case study in Limpopo Province, South Africa. In Integrated waste management. volume 1, ed. K. Sunil. London: IntechOpen. https://doi.org/10.5772/18655
- Oonk, H. 2010. Literature review: Methane from landfills. Methods to quantify generation, oxidation and emission. OonKay, Apeldoorn: Oonkay Innovations in Environmental Technology .
- Rezaee, R. 2014. Estimation of gas emission released from a municipal solid waste landfill site through a modeling approach: A case study, Sanandaj, Iran. J. Adv. Environ. Health Res. 2 (1):13–21.
- Saexplorer. 2017. Thohoyandou climate. Accessed 3 November, 2017. http://www.saexplorer.co.za/south-africa/climate/thohoyandou_climate.asp.
- Scharff, H., and J. Jacobs. 2006. Applying guidance for methane emission estimation for landfills. Waste Manage. 26 (4):417–29. doi:10.1016/j.wasman.2005.11.015.
- Scheutz, C., A. M. Fredenslund, J. Nedenskov, J. Samuelsson, and P. Kjeldsen. 2011. Gas production, composition and emission at a modern disposal site receiving waste with a low-organic content. Waste Manage. 31 (5):94yy6–955. doi:10.1016/j.wasman.2010.10.021.
- Shin, H. C., J. W. Park, H. S. Kim, and E. S. Shin. 2005. Environmental and economic assessment of landfill gas electricity generation in Korea using LEAP model. Energy Policy 33 (10):1261–70. doi:10.1016/j.enpol.2003.12.002.
- Taherian, S., M. Adl, and E. A. Sharghi. 2016. Estimation of biogas generation by the use of first-order kinetic models for a landfill site in Karaj, Iran. Int. J. Innovative Res. Dev. 5 (10):2278–0211.
- Thulamela Local Municipality. 2017. Accessed March 3, 2017. http://www.thulamela.gov.za/index.php?page=background.
- Wang, X., A. S. Nagpure, J. F. DeCarolis, and M. A. Barlaz. 2013. Using observed data to improve estimated methane collection from select US landfills. Environ. Sci. Technol. 47 (7):3251–57. doi:10.1021/es304565m.
- Williams, R. R. C. 2001. Landfill gas primer an overview for environmental health professionals. USA: The Agency for Toxic Substances and Disease Registry (ATSDR) USA.
- Worldwide funds for nature (WWF). 2017. The truth about our food waste problem. Accessed December 5, 2017. http://www.wwf.org.za/what_we_do/food_energy_water_nexus/?21962/The-truth-about-our-food-waste-problem.