
 ?Mathematical formulae have been encoded as MathML and are displayed in this HTML version using MathJax in order to improve their display. Uncheck the box to turn MathJax off. This feature requires Javascript. Click on a formula to zoom.
ABSTRACT
A series of experiments was designed to assess the relative efficacy of various dust suppressants to suppress PM10 emissions from nepheline syenite tailings. The experiments were conducted in the Trent University Environmental Wind Tunnel, Peterborough, Ontario, and on the tailings ponds at a mine near Havelock, Ontario. Treated surfaces were subjected to particle-free airflow, abrasion with blown sand particles, and particle-free airflow after physical disturbance. Emission rates in the wind tunnel tests were calculated from dust concentration measurements obtained in vertical profile with DustTrak™ II aerosol monitors (model 8530); rates in the field were measured using a Portable In-Situ Wind Erosion Laboratory (PI-SWERL). In the particle-free wind tunnel tests, three of the surface treatments performed well, and PM10 emission scaled inversely with crust strength. Light bombardment of each surface by saltating sand grains increased PM10 emission rates by two orders of magnitude. All treated surfaces emitted significantly more PM10 after physical disturbance. In the field study, plots treated with a commercial dust suppressant were found to release more PM10 than either the control or irrigated plots, although it should be noted that the emission rates were similar in magnitude. As in the wind tunnel experiments, all of the field plots became significantly more emissive after physical disturbance. The field results suggest that the site conditions, inclusive of the potential for dust advection and resuspension, must be taken into account when considering the use of a commercial dust suppressant.
Implications: Fugitive dust (PM10) emissions from mining and industrial operations worldwide present significant environmental and human health risks, leaving mine operators challenged to find reliable, durable, and cost-effective mitigation options. Commercial dust suppressants boast unique chemical compositions and commensurate particle binding capabilities, although few side-by-side comparisons exist in the literature. The efficacy of four commercial products to suppress PM10 emissions from mine tailings, before and after physical disturbance, was assessed using robust field and wind tunnel experiments. All surfaces emitted significantly more PM10 after physical disturbance but with considerable variability amongst products. Possible reasons for the differences in relative performance are explored.
Introduction
Airborne particulate matter (PM) can be formed in the atmosphere through photochemical reactions (secondary PM) or emitted directly to the atmosphere from either natural (e.g., wind erosion, volcanic emissions, forest fires) or anthropogenic (e.g., fossil fuel combustion, excavating, material handling) activities. Emissions are further defined as being released either from point-specific (e.g., emissions from chimneys or stacks) or fugitive (e.g., material stockpiles, tailings lagoons, open pits) sources. PM is often described by its aerodynamic diameter based in part on how particles behave once airborne, and by the associated health effects attributed to particles of different diameters. Within this paper we refer to fugitive dust as particles less than 10 microns in diameter, or PM10, emitted directly to the air from open sources, and more specifically, mineral extraction and mining facilities.
Emissions of fugitive dust are often initiated by the abrasion of grains traveling in ballistic trajectories (saltation) over an open surface (Kok et al. Citation2012). Earlier wind tunnel studies conducted on both physical and biological soil crusts demonstrate that even relatively strong surfaces can be vulnerable to rupture under saltation conditions (Langston and McKenna Neuman Citation2005; McKenna Neuman, Boulton, and Sanderson Citation2009; McKenna Neuman and Maxwell Citation1999, Citation2002). Unsurprisingly, mineral extraction, mining, and material handling activities can produce significant emissions of fugitive dust. Throughout the industry, a number of techniques are deployed to mitigate dust emissions, with varying degrees of success. Techniques often involve either: a) reducing wind-induced shear forces and hence abrasion potential acting upon open surfaces through the installation of wind fences (Grant and Nickling Citation1998; Skidmore and Hagen Citation1977), vegetation cover (Okin Citation2008; Wolfe and Nickling Citation1993), or increasing the surface roughness by adding non-erodable roughness elements such as boulders or straw bales (Gillies and Lancaster Citation2013); or, b) by stabilizing the surface with water (Fitz and Bumiller Citation2000; Wang et al. Citation2015), biological (Leys and Eldridge Citation1998; McKenna Neuman and Maxwell Citation1999, Citation2002), or chemical crusts (Langston and McKenna Neuman Citation2005; Rice, Willetts, and McEwan Citation1996). In many cases, multiple strategies are employed in combination.
Many of these practices are similar to natural processes which have been well studied in arid regions using a range of approaches in the field and laboratory (Houser and Nickling Citation2001a; McKenna Neuman, Maxwell, and Rutledge Citation2005; Rice and McEwan Citation2001; Wang et al. Citation2010). One of the most common treatments in the mining industry involves the topical application of a dust suppressant on a potentially erosive surface, such as a tailings pond. Dust suppressants typically form a protective crust that isolates the underlying particulate matter from wind erosion (Fan, Zhou, and Wang Citation2018; Gillies et al. Citation1999). There exist a number of commercial dust suppressants on the market. Those applied topically in liquid form may be placed into four broad categories: salts, organic petroleum and oil-based products, pulp process co-products, and acrylic polymers.
The paper pulping process results in two groups of co-products: i) sugar-based products, such as lignosulfonates; and, ii) gum-based products, inclusive of tall oil pitch (Stantec Consulting Inc Citation2005). Lignosulfonates derive from the sulfite paper pulping process and are composed primarily of lignin, a natural polymer that creates strength in a woody plant by binding the cellulose fibers together (Midwest Industrial Supply Citation2017). When formulated as an ammonium ligninsulfonate, for example Dust Fyghter® LN100, the product coats soil particles to act as a dispersant, interfering with their tendency to aggregate and allowing for better compaction and vertical water flow through the substrate (Midwest Industrial Supply Citation2017). It is reported by the manufacturer that water evaporation from Dust Fyghter® LN100 produces a highly viscous material that may be rejuvenated when rewetted, usually during precipitation events, and is also freeze-thaw stable. It is commonly used to suppress dust emission from haul road surfaces, but is sometimes applied on areas where mine tailings are stored (Midwest Industrial Supply Citation2017).
Tall oil pitch, its name derived from the Swedish term for pine, is a co-product of the sulfate pulp process. It initially is rendered as a dark brown, sticky substance that is extremely viscous and insoluble in water. The pitch can be heated and emulsified to create a product such as Entac that can coat granular surfaces and penetrate through inter-particle voids with the intent of hardening or curing to bind the particles within the surface together (Enssolutions Citation2017).
Acrylic polymers are engineered using nanotechnology (EP&A Envirotac, Inc Citation2017). The molecules form very long straight chains that link to other chains, ultimately creating a mesh-like grid over the soil surface (Midwest Industrial Supply Citation2017). EcoAnchor forms a three-dimensional network structure in the upper 1– 2 cm of the soil, increasing the interconnection between the soil particles and creating a relatively homogeneous surface material. Treated areas exhibit an increase in tensile and compressive strength, remaining hard when wet and during freeze-thaw conditions. Following repeated applications, this product is reported to form a surface that is strong enough to resist heavy machinery traffic (Landloc Environmental Citation2017). Soil Sement® is a widely used product that is capable of forming chains of up to a million molecules in length. This is considerably longer than most naturally occurring lignin polymers (102 to 104 molecules). Soil Sement forms a strong protective grid that is water- and weather-resistant, and is advertised to be as strong as steel and as resilient as rubber (Midwest Industrial Supply Citation2017).
Objectives
This study compares the efficacy of four commercial dust suppressants as assessed in a series of laboratory and field based experiments; products tested include: Dust Fyghter® LN100 (LN); Entac (EN); EcoAnchor (EA); and, Soil Sement® (SS). Tests conducted in the Trent Environmental Wind Tunnel (TEWT) allowed for a high degree of control over the environmental conditions and for high precision in measuring PM10 emission rates. The field research, conducted on the tailings ponds operated by Unimin Ltd. in Nephton, Ontario, Canada, subjected the dust suppressants to a wide range of naturally varying weather conditions over the span of six months. This study had the following specific objectives:
To compare in wind tunnel tests, under constant humidity and temperature, the emission of PM10 from surfaces treated with one of the four commercial dust suppression products under particle-free (i.e., no abrasion) wind shear conditions.
To compare the efficacy of the four dust suppressants when treated surfaces are subjected to abrasion from the impacts of sand particles blown across them.
To evaluate the altered emissivity of treated surfaces following a mechanical disturbance (most surfaces in industrial settings will experience some degree of disruption due to foot and/or vehicular traffic associated with routine operations and maintenance).
To evaluate and compare the performance of the four dust suppressants under varied weather conditions when applied to mine tailings in a field setting.
Methods
Wind tunnel experiments
The laboratory experiments were conducted in a suction-type, boundary-layer wind tunnel at Trent University (TEWT). The working section is 70 cm (wide) by 77 cm (high), and 13.8 m long. The tunnel intake consists of a honeycomb straw filter that straightens the airflow and minimizes turbulence. An array of 2 cm diameter wooden dowels located at the opening of the tunnel promotes the development of a boundary-layer flow. Detailed descriptions of the TEWT are provided in Nickling and McKenna Neuman (Citation1997) and McKenna Neuman (Citation2003).
The TEWT laboratory has an environmental system which controls the humidity and temperature. All of the laboratory tests were conducted with the environmental controls in the tunnel set to 20°C and 20% relative humidity (RH). Because the wind tunnel runs were conducted in December and January, it was necessary to use baseboard heaters to supplement the environmental system, which resulted in temperature variances of approximately ±2°C; RH was generally more consistent, with a variability of approximately ±0.5%.
Wind tunnel instrumentation and configuration
The instrumentation and configuration of the TEWT used in the laboratory research are shown in . The TEWT is equipped with a sediment feed located near the entrance of the tunnel above the array of wooden dowels. In this study, quartz sand of a median diameter of 334 µm (Horiba laser particle size analyzer) was released to initiate abrasion of the test surfaces. The rate of sediment feed was measured using a vertically integrating, wedge-shaped passive sediment trap located near the tunnel outlet, 3.92 m downstream from the leading edge of the test tray. The sand trap has a 2 cm wide opening with a height of 23.1 cm and a downstream width of 13.1 cm. The sediment feed rate, q (kg m−1 sec−1), was determined from the equation:
Figure 1. Schematic of the trent environmental wind tunnel configuration and instrumentation used in the laboratory research.
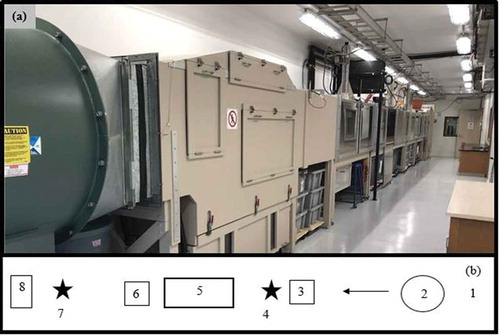
where m is the total sediment mass (kg), w is the width of the sand trap opening (m), and t is the duration of sampling time in seconds. A detailed evaluation of the sediment trap is provided in Nickling and McKenna Neuman (Citation1997).
Four TSI DustTrak™ II Aerosol Monitors 8530 (DTs) were used to measure the PM10 concentration in the airstream. PM10 inlet impactors were attached and the DTs were set to record concentrations in mg m−3 every second. The DTs were connected with approximately 20 cm of Tygon® tubing to copper intake tubes with an outer diameter of 8 mm and a length of 1 m. Two DTs were located 2.13 m upwind of the leading edge of the test surface to determine the background dust concentration in the tunnel (). The wind tunnel was thoroughly cleaned before each run and no run was started until a background PM10 level of less than 0.02 mg m−3 was attained. Typically, most of the runs were conducted with an initial background level of less than 0.01 mg m−3. Two more DTs were located 1.15 m downwind from the leading edge of the test tray to measure dust emissions from the test tray surface (). The intake tubes both upwind and downwind were positioned 5 cm and 10 cm above the tunnel floor. These heights were chosen based on previous research conducted in the TEWT (Ogungbemide Citation2017; Sanderson, McKenna Neuman, and Boulton Citation2014), as well as a series of pilot tests conducted prior to the commencement of the tunnel runs. The main concerns in setting the DT intake nozzle heights were to ensure that i) the lower DT intake was capturing a high level of PM10 without being too close to the tunnel floor such that the airflow was perturbed by flow acceleration beneath the tube, and ii) the upper DT intake remained within the dust plume released by the test tray and was not simply recording background dust concentrations. Background PM10 measurements from the two upwind DTs were averaged over ten seconds and then subtracted from the downwind PM10 readings. The resulting values were used to determine the PM10 emission rate, F (µg m−2 sec−1), for each test surface from the following relation (Gillette Citation1978):
where k is the von Kármán constant (0.41), u* is the friction velocity (m sec−1) and c1 and c2 are the PM10 concentrations (µg m−3) at heights z1 (0.05 m) and z2 (0.10 m). The average emission rate for an entire wind tunnel test, , was calculated from the emission fluxes determined for each second of the test duration. The values for
from the three replicate test trays were also averaged to determine the overall emission rate,
, for a given dust suppressant.
Wind velocity profiles
Vertical profiles of the horizontal wind speed were measured to determine the friction velocity (u*, m sec−1) and aerodynamic roughness (zo, m) based on the Prandtl equation:
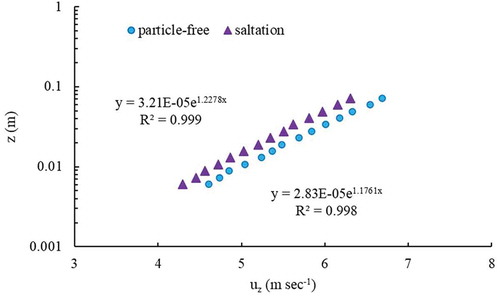
Wind velocity, uz, at height z was sampled with micro-pitot tubes with an outer diameter of 3 mm and an inner diameter of 1 mm, beginning at z = 0.005 m above the surface and traversing vertically through the boundary layer to a height of z = 0.4 m in the freestream. Velocity profiles were measured simultaneously at two locations in the tunnel, with upwind and downwind pitot tubes located 5.5 m and 9.1 m, respectively, from the entrance of the tunnel (). The results from five clean air profiles using both pitot tubes were averaged to determine the friction velocity, u* = 0.35 m sec−1, and aerodynamic roughness, zo = 2.83 * 10−5 m, for a target freestream velocity of 7 m sec−1 (). Five more profiles measured in the presence of a saltation cloud were averaged to give u* = 0.33 m sec−1 and zo = 3.21 * 10−5 m for a requested freestream velocity of 7 m sec−1 (). It should be noted that the continuous introduction of sand particles from the sand feed located at the entrance of the tunnel creates a consistent level of saltation and, therefore, a consistent velocity profile.
Figure 2. Wind velocity profiles obtained at u∞ = 7 m s−1 under particle-free conditions and saltation conditions (q = 0.0077 kg m−1 sec−1), corresponding to friction velocities (u*) of 0.35 m sec−1 and 0.33 m sec−1, respectively, and aerodynamic roughness values (z0) of 2.83 * 10−5 m and 3.21 * 10−5 m, respectively.
Wind tunnel test tray preparation
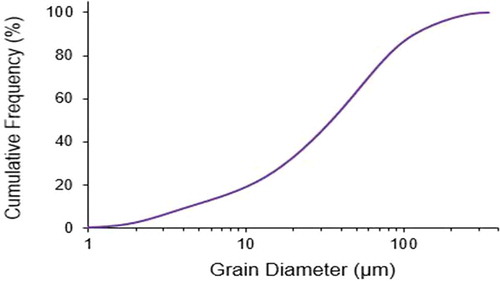
Nepheline syenite tailings obtained from tailings pond #4 at the Nephton field site were first broken up by hand. Prior to drying them in an oven at 105°C, any visible organic matter was removed. The tailings then were manually crumbled, while any small aggregate clumps that formed during the drying process were discarded. The tailings had a median particle diameter of 35 µm, but ranged between 1 µm and 344 µm, with 19% of the particles consisting of PM10 ().
Figure 3. The particle size cumulative frequency distribution of the tailings used in the laboratory experiments. This was determined using the Horiba LA-950V2 laser particle size analyzer which measures volume distribution based on volume equivalent sphere diameter.
The tailings were placed in aluminum trays measuring 35 cm wide, 100 cm long, and 2.5 cm deep. For each dust suppressant, three replicate trays were filled with the tailings and leveled. Each surface was then treated with the product following the supplier specifications (), with EN being applied in two coats, 20 minutes apart, and the other three suppressants applied in a single coat. The dust suppressants were applied using a 1 L plastic bottle with a small, hand-operated lever spray nozzle. The direction of the spray angle was regularly changed so that the tailings were as thoroughly and evenly coated as practical. Each tray was then placed in the TEWT laboratory, at 20°C and 20% relative humidity, and allowed to dry/cure for a minimum of seven days before the wind tunnel tests were conducted.
Table 1. Dust suppressant application rates as recommended by the respective manufacturer or supplier.
Wind tunnel experimental procedure
The test trays were placed so that the leading edge of the tray was located 6.68 m from the tunnel entrance (). Each one was inserted into the tunnel floor, so that the test surface was flush with the surrounding bed surface. The edges of the trays were taped to eliminate gaps between the tray and the tunnel floor. Each test surface then was subjected to a set of pre-determined experimental conditions as outlined below.
Particle-free run
This was a step-wise, ramped velocity run during which PM10 concentrations were measured to determine the emission rate in response to gradually increasing wind speeds without abrasion (i.e., fluid shear forces alone). Beginning with a speed of 5 m sec−1, the wind speed was increased by 1 m sec−1 every 90 seconds to a maximum wind speed of 12 m sec−1. These wind speeds corresponded to a range in friction velocity, starting at 0.26 m sec−1 and ramping up to 0.63 m sec−1; encompassing the range in u* measured at the Nephton field site in 2014 and 2015 (D. Ogungbemide, personal communication, October 20, 2016).
Saltation run
This was an hour long run during which the surfaces were abraded with sand (median diameter of 334 µm). The lengthy test duration was chosen because the test surfaces were expected to be strong enough to withstand significant abrasion, based on manufacturer claims and results from previous studies conducted in the TEWT (Langston and McKenna Neuman Citation2005; McKenna Neuman, Boulton, and Sanderson Citation2009; McKenna Neuman and Maxwell Citation1999, Citation2002). For each test, the pre-selected temporal pattern for the freestream wind velocity was: 6, 8, 7, 10, 7, 9, 6, 10, 8, 9, 7, 8 m sec−1, each increment in u∞ lasting for five minutes. The variable wind speeds were chosen to approximate natural fluctuations in a field setting. After every second wind speed setting, an additional minute of run time was added so that the intake tubes could be detached from the DTs and cleared of sand particles using an air compressor. The PM10 measurements during these cleaning intervals were not included in the resultant data series.
Physical disturbance particle-free run
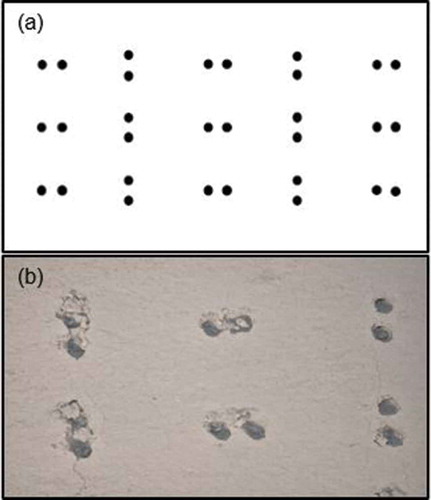
Herein, the goal was simply to initiate a replicable event in which each surface treated with a dust suppressant was loaded to the point of rupture. Owing to scaling constraints in the laboratory, it was not possible to simulate a convincing disturbance as might occur in a mine setting, e.g. traffic, trampling, or material handling, As such, the surface of each tray was physically disturbed by pushing an array of nail heads through the crust formed by application of the dust suppressant. A 50 cm by 30 cm board, approximately half the size of the tray area, was installed with 30 nails, each with a head diameter of 1 cm and a stem diameter of 0.33 cm. Nails were placed in pairs at regular intervals, protruding 3 cm from the board so that the surface of the board would not make contact with the surface of the tray (). The board was pushed as far as possible into each half of the tray taking care to avoid removing any sections of crust that cracked due to the disturbance. This approach ensured that each test tray was disturbed as consistently as possible, although the amount of force used to fully penetrate each crust was not consistent. The nails were placed to ensure variation in the orientation of the pairs of nail heads. Once the crusts were disturbed, a ramped velocity run with the same specifications as the initial particle-free run was performed.
Figure 4. Physical disturbance of the test trays. (a) A schematic of the board embedded with nails used to physically disturb the test trays. (b) A close-up of an LN tray after physical disturbance.
Field experiments
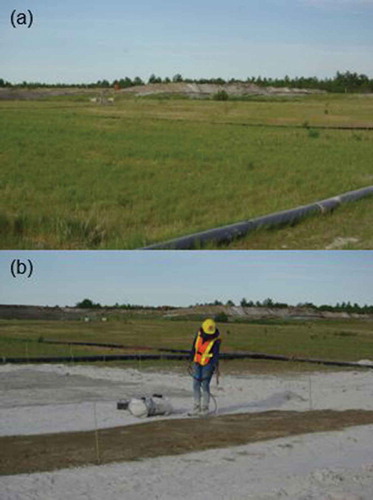
The field study took place on tailings pond #4 at the Unimin Ltd Nephton Mine in Southern Ontario, Canada (). On June 1, 2016 a small section of the tailings pond near the berm road at the western edge of the pond was scraped clear of vegetation by Unimin personnel. Tailings pond #4 has a permanent irrigation system in place as part of their dust mitigation strategy. A test plot using water as a dust suppressant (W) was placed within range of two of the berm sprinklers which were activated by the mine on dry days as part of standard operating procedures at the facility. The other five test plots, including the untreated control plot (C) and four commercial dust suppressant plots, were located perpendicular to the berm road out of range of the sprinklers. The area was leveled with rakes and the plots were measured and outlined with bamboo stakes and synthetic twine. The irrigated test plot measured 3 m by 15 m, while the other five test plots measured 2.5 m by 16 m. The slight differences in plot size were necessary due to the size and shape of the area cleared for this project. The commercial dust suppressants were then applied with a “Workhorse” 25 gallon economy sprayer powered by a 12 volt pump according to the manufacturers specifications (; ). Entac was applied in three coats approximately 20 minutes apart, while the other three products were applied in single applications. The fifth and remaining plot was left untreated to serve as a control plot (C).
Figure 5. The field research site at the Unimin Ltd Nephton mine. (a) Tailings pond #4 with established vegetation before being cleared. (b) The application of Entac, June 1, 2016.
Field PM10 emission measurements
PM10 emission rates from the test plots were measured with a Portable In-Situ Wind Erosion Laboratory (PI-SWERL). Each PI-SWERL test was preceded by the operation of the clean air blower for 90 seconds to ensure that there was no dust in the chamber. Each ramped test run consisted of five target RPMs: 400, 1400, 2400, 3400, and 4400, lasting for 90 seconds each. Four replicate measurements were made on each plot on each of seven site visits ().
Table 2. Field measurement dates.
The PI-SWERL output includes the PM10 concentration (mg m−3) measured by the DT each second, the PM10 mass for each target revolution per minute (RPM; µg), the instantaneous emission rate E (µg sec−1), and the total mass emitted during the test (µg). The instantaneous emission rate is calculated from:
where C is the PM10 concentration (µg m−3) sampled each second, and Qf is the clean air flow rate (m3 sec−1). From this the average emission flux, Fi, is given for each ramp as:
where is the sample rate, Aeff (0.035 m2) is the effective area under the PI-SWERL ring (Etyemezian et al. Citation2014) and
is the duration of the ramp in seconds. The average PM10 emission flux,
, over the full length of each of the four replicate PI-SWERL tests was calculated by:
where n is the number of concentrations sampled. was calculated as the average PM10 emission flux for all four replicates for a given dust suppressant.
Five samples were scraped with a trowel from each test surface and oven-dried at 105°C for 24 hours to determine gravimetric moisture content (GMC). GMC samples were collected on all measurement dates except for the first measurement date, M1.
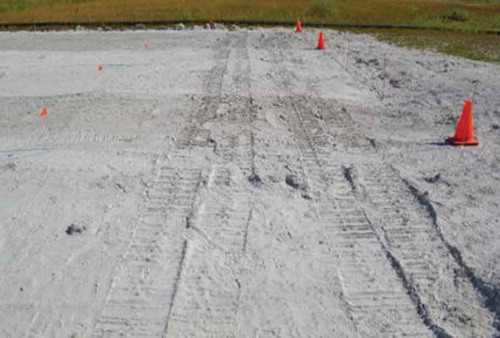
Field physical disturbance tests
On August 2, 2016, two months after the dust suppressants were applied, a Caterpillar 257B3 skid steer track loader was driven over the distal ends of the research plots, once forward, and once in reverse (). Emissions from the disturbed area were then measured immediately with the PI-SWERL, as well as four and ten weeks after disturbance, on August 29th and October 11th. Due to very high emission rates on the day of the disturbance, it was necessary to reduce the target RPMs for the PI-SWERL tests, and all but one test still had to be terminated before completion, due to excessively high DT readings. The decision to terminate the PI-SWERL tests early was made because the DT tubing becomes clogged when a large amount of dust is drawn through the instrument. Therefore, even though the DT is capable of measuring PM10 concentrations of up to 300 mg m−3, the PI-SWERL was shut down when the DT concentrations exceeded 110 mg m−3, and no data were included in the analysis when DT values exceeded this PM10 concentration. The subsequent measurements, carried out four and ten weeks after the disturbance of the plots, followed the target RPMs of the undisturbed PI-SWERL tests, although about 33% of the tests conducted four weeks after disturbance also had to be terminated due to high PM10 concentrations. The PI-SWERL test data from the runs on the disturbed sections of the test plots were treated in the same manner as the measurements on the undisturbed sections of the plots.
Figure 6. The tracks caused by the physical disturbance of the research plots with a Caterpillar 257B3 skid steer loader, August 2, 2016.
Results and discussion
Wind tunnel tests with clean air intake
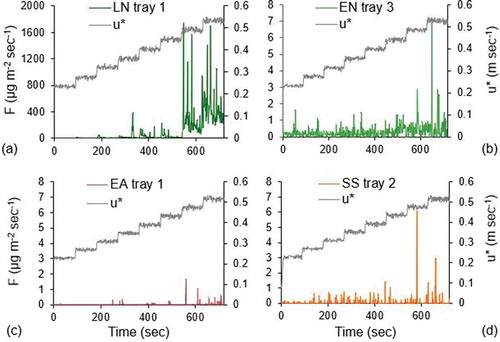
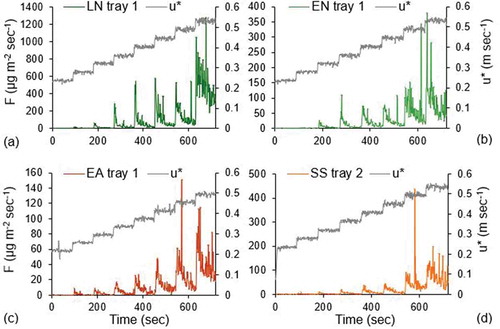
During the particle-free runs, the EN, EA, and SS emitted very low levels of PM10, all with peak emission fluxes of less than 10 µg m−2 sec−1 (). In addition, these three dust suppressants exhibited similarities in the magnitude and pattern of their PM10 emissions. Dust emissions were very low in the initial stages, less than 1 µg m−2 sec−1, and only began to spike at the highest two wind speeds. The LN test trays were much more emissive, exhibiting peak PM10 emissions several orders of magnitude higher than the other three dust suppressants (). The average PM10 emission rate of LN during the particle-free runs was also at least two orders of magnitude higher than the other three dust suppressants. Despite small differences, the average emission rate of the other three dust suppressants, EA, EN, and SS, was low and of a similar magnitude ().
Table 3. Average emission flux values, (µg m−2 s−1), for the initial particle-free runs, the saltation runs, and the post-disturbance particle-free runs in the wind tunnel tests. Data also include the mean emission flux,
, the standard deviation (σ), and the Coefficient of Variation (
*100, CV, %) for each dust suppressant.
Figure 7. Time series of the emission fluxes and friction velocities measured in the particle-free wind tunnel runs for the intermediate test run of each dust suppressant. (a) LN tray 1. (b) EN tray 3. (c) EA tray 1. (d) SS tray 2.
These results indicate that EA, EN, and SS afforded excellent protection against entrainment through fluid drag in particle-free air, since the underlying tailings were protected by the crusts created by the dust suppressants. However, the fact that the LN surfaces emitted two orders of magnitude higher during these low-stress, particle-free tests was unexpected, since many previous wind tunnel and field studies have found that both physical and biological crusts are able to withstand particle-free winds without eroding and/or emitting PM10. Indeed, studies conducted in the TEWT suggest that many different types of biological crusts are stable under winds as high as 19 m sec−1 (McKenna Neuman and Maxwell Citation1999, Citation2002; McKenna Neuman, Maxwell, and Boulton Citation1996). In a field wind tunnel study, after an initial PM10 peak upon initiation of the airflow, dust emissions remained low over playa soils bearing a physical crust (Houser and Nickling Citation2001b).
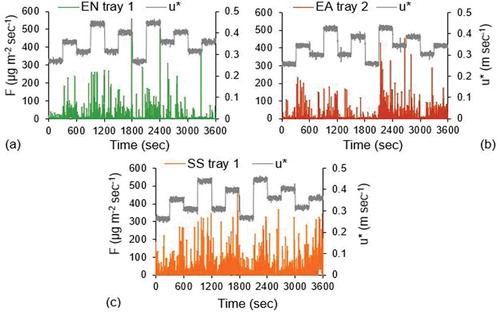
Wind tunnel tests with an upwind particle feed
As anticipated, abrading the surfaces with saltating sand caused all of the test trays to emit substantially more PM10 compared to the particle-free runs (). In addition, the EN, EA, and SS test trays emitted PM10 consistently throughout the hour-long test (). In the intermediate run of each of these three dust suppressants, the test surfaces emitted PM10 at levels two orders of magnitude higher than during the clean air runs. However, when considering the mean PM10 emission flux for the three replicates () for each dust suppressant, SS emitted three orders of magnitude more PM10 than the particle-free runs (). This was due to the fact that the second replicate SS tray emitted between 2.5 and 4 times more PM10 than the other two SS trays. The reasons for this are unclear, since the tray was subjected to the same experimental conditions as all of the test trays and was similar in appearance to the other two SS trays.
Figure 8. Time series of the emission fluxes and friction velocities measured in the saltation runs for the intermediate test run of three of the dust suppressants. (a) EN tray 1 – mean sand transport rate 0.00804 kg m−1 sec−1. (b) EA tray 2 – mean sand transport rate 0.00728 kg m−1 sec−1. (c) EN tray 1 – mean sand transport rate 0.00886 kg m−1 sec−1.
The LN test trays were not able to withstand sand abrasion without emitting extreme amounts of dust, and are therefore not included in the results presented in this section. Upon initiation of the sand feed in the tunnel, the DTs downstream of the test trays immediately reached PM10 concentrations considered sufficiently large to overload the nephlometers. As a result, all three attempts to subject the LN trays to sand abrasion had to be terminated within seconds of initiating the sand feed in the wind tunnel.
It was expected that all of the dust suppressants would be vulnerable to sand abrasion, but the fact that the LN test trays were unable to withstand any abrasion by saltating sand particles without saturating the DTs with PM10 was surprising. The other three test surfaces remained intact during the saltation runs, exhibiting no substantial changes in surface roughness or visual evidence of erosion (i.e., pitting). However, contrary to expectation, they all emitted PM10 continuously and consistently throughout the hour-long test rather than exhibiting a gradual increase in PM10 emissions over the duration of the test (). This result is in good agreement with the findings of Houser and Nickling (Citation2001b) where crusted playa soils emitted PM10 continuously throughout ten minute saltation tests in a field wind tunnel. These authors suggest that each impact from a saltating sand particle was able to cause the release of dust particles, and that the erosion of the surface was not dependent on repeated impacts of sand particles which might be expected to gradually break down the crust. This result contradicts laboratory wind tunnel experiments in which both biological and physical crusts were found to gradually break down over time under sand abrasion (McKenna Neuman and Maxwell Citation1999, Citation2002; McKenna Neuman, Maxwell, and Rutledge Citation2005; O’Brien and McKenna Neuman Citation2012; Rice, Willetts, and McEwan Citation1996). However, it should be noted that these laboratory studies measured wind erosion by mass loss and/or crust deterioration and did not measure emissions of PM10. Also, the biological crusts were cultured, and the salt crusts formed, on medium grained sand which did not contain significant amounts of PM10, whereas the tailings used in the test trays in this study had a particle size distribution comprised of 19% PM10. In a study conducted in the TEWT on a mine tailings slurry consisting of approximately 30% PM10 by volume, the test surfaces also emitted PM10 throughout sand abrasion runs lasting 110 minutes (McKenna Neuman, Boulton, and Sanderson Citation2009). The tailings tested in that research were wetted to a gravimetric water content of 65%, oven-dried, and then pulverized before the commencement of wind tunnel testing. Dust emissions remained well above background levels for the duration of the saltation runs, and the researchers concluded that abrasion by sand of the crusted tailings produced a renewable source of PM10. Therefore, the results from the current study are in agreement with the McKenna Neuman, Boulton, and Sanderson (Citation2009) and Houser and Nickling (Citation2001b) studies, and suggest that crusted surfaces containing PM10 are likely to release PM10 immediately and continuously when abraded by sand particles. This also suggests that much of the literature describing crust resilience to wind shear and sand abrasion may not be as relevant when considering PM10 emission rates, rather than crust erosion through mass loss and, ultimately, crust failure.
It should be noted that the sand transport rate established in the wind tunnel saltation runs was likely more sustained than might be expected to occur in nature. However, the fact that all of the treated surfaces instantaneously released PM10 from the onset of sand abrasion would suggest that they may also be vulnerable to either low intensity or sporadic sand transport events associated with a limited supply of particles that may enter saltation. At mine sites where there are haul and berm roads, sand-sized particles are inevitably plentiful. The nepheline syenite tailings used in this study contained particles larger than 70 µm in diameter (), and in a recent field study also conducted on Nephton tailings pond #4, saltating sand particles were captured in Fryrear sand traps (Ogungbemide Citation2017). In areas that were well-vegetated, the amount of sand captured in the traps was low. However, in areas of largely unprotected tailings, the traps captured ten times more sand (i.e. 2 kg m−2 wk−1 over a six-week period in July and August 2014). As a consequence, the results from this study would suggest that saltation of these sand particles over surfaces treated with a dust suppressant is likely to result in higher than expected levels of dust emission.
Wind tunnel tests after mechanical disturbance
The PM10 emission curves for tests conducted after the surfaces were physically disturbed generally exhibit a more “typical” form than the particle-free wind tunnel runs (). That is, in the ramped tests each increase in wind speed generated a higher peak emission rate than for the previous step. This rate then gradually decayed through the 90 second period, as the supply of dust from the surface was exhausted, until the wind velocity was stepped up once again. Similar to the runs with sand abrasion, the post-disturbance tests resulted in significantly higher levels of PM10 emission as compared to the results obtained for all surfaces in the initial particle-free runs (). Of the four treated surfaces, LN was again by far the most emissive. Relative to the other treatments, the LN emission rate after disturbance was 250%, 1063% and 97% higher than EN, EA and SS, respectively.
Figure 9. Time series of the emission fluxes and friction velocities measured in the particle-free wind tunnel runs after physical disturbance of the test tray crusts for the intermediate test run of each of the four dust suppressants. (a) LN tray1. (b) EN tray 1. (c) EA tray 1. (d) SS tray 2.
These results suggest that physical disturbance of the test surfaces exposed particles to wind drag that were initially protected by the surface crust that was formed by application of the dust suppressant (). Indeed, many laboratory and field studies involving both physical (Cahill et al. Citation1996; Houser and Nickling Citation2001a; McKenna Neuman, Boulton, and Sanderson Citation2009) and biological crusts (Belnap and Gillette Citation1997; Leys and Eldridge Citation1998; Williams et al. Citation1995) found that such surfaces are significantly more erosive after disturbance. In a mine setting, this would suggest that physical disturbance of a surface treated with a commercial dust suppressant will increase the likelihood of PM10 emission considerably. The magnitude of the emission event is likely to scale with the degree of disturbance, taking into account the area, depth and frequency of crust rupture.
Field tests: PI-SWERL PM10 emission rate measurements for treated tailings
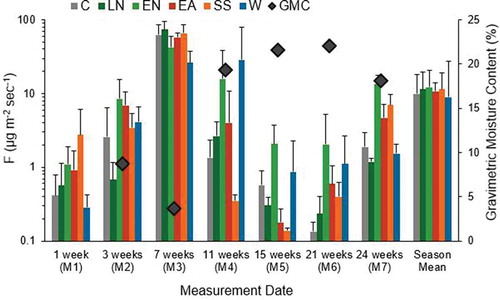
The PI-SWERL tests also produced “typical” emission curves for treated surfaces within the field plots (), although a high degree of variability was observed within replicate measurements carried out on the same dust suppressant plot, between dust suppressant plots on a single measurement date, and throughout the field season. Certainly a high level of variability is common in many PI-SWERL studies, reflecting the challenges of accurately measuring dust emission in field settings (Bacon et al. Citation2011; Kavouras et al. Citation2009; King et al. Citation2011; Sweeney et al. Citation2008). The mean PM10 emission rates () calculated over the course of the present field study provide an indication of the temporal variability (). In this regard, the treated surfaces are ranked from least to most emissive as follows: W, C, EA, LN, SS, EN. This result is particularly interesting since it would suggest that, on average, none of the commercial products afforded better dust suppression than the control or irrigated plots. Given the seven measurement dates, LN was more emissive than the control plot on four occasions, as compared to EN – six, EA and SS – five, and W – also four. However, the seasonally averaged emission rates were all of a similar magnitude, ranging from 8.97 µg m−2 sec−1 for the irrigated test surface to 12.15 µg m−2 sec−1 for the EN test surface.
Figure 10. A typical PM10 concentration curve from a PI-SWERL test for the first replicate measurement on the EN plot, 1 week after application (M1).
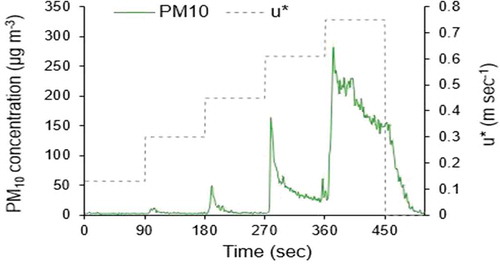
Figure 11. Comparison of the average PM10 emission fluxes, , measured during PI-SWERL tests for each measurement date with average gravimetric moisture content levels. GMC data are not normally distributed, and all pairings are significant except M5 – M7 and M6 – M7 (Kruskal-Wallis, p = .048).
The inclusion of control and irrigated plots in the field experiment allows other factors to be considered when evaluating the performance of the four commercial dust suppressants, specifically the natural formation of crusts under variable moisture conditions in field settings. In a previous study that compared varied application rates of a tall oil pitch emulsion, Kavouras et al. (Citation2009) discovered that dust emissions from an untreated control plot decreased over time as a result of physical compaction attributed to precipitation events. Previous studies (Preston Citation2015a, Citation2015b) conducted on tailings pond #4 at the Nephton site found that the tailings naturally compact and stabilize, allowing for the development of algal and subsequently moss crusts, provided a gravimetric moisture content of at least 10% is maintained. On the final four measurement dates of the present study, GMC exceeded 15%, suggesting there was sufficient moisture within the research plots to support the development of biological crusts. In a parallel study, Gilbert-Parkes (Citation2017) confirmed that algae were present within the test plots throughout the entire field season. Preston (Citation2015a) also discovered that algae are present in water sourced from the clarification pond and, as such, widespread inoculation of the tailings occurs each time water sprinkling is in effect for dust control. Indeed, widespread moss cover was observed on the test plots by July 2017, one year following the completion of the present dust suppressant study.
It is interesting to note that the irrigated plot tended to be either considerably more or less emissive than the control on varied measurement dates (). While recent water sprinkling likely accounted for the irrigated plot being less emissive than the control on M1, M3, and M7, precipitation/sprinkling rates were not measured in this study. From qualitative observations at the site, these rates are recognized to be highly variable through space and time. Ogungbemide (Citation2017) reports that under windy conditions, low levels of water sprinkling on the Nephton tailings can correlate with a spurious increase in dust emission arising from the detachment of dust particles with water droplet impact. Van Duk and Stroosnijder (Citation1996) also found that in the early stages of rainfall, before the surface is sufficiently wet to lock down the particles, dust emission sometimes increases. The ejection of fine particles can be triggered by the impacts of either water droplets or sand particles in saltation. This implies that if water is used as a dust suppressant, it is important that the surface be consistently wet. After a comprehensive investigation of wind erosion and site conditions on the Nephton tailings ponds, Ogungbemide (Citation2017) recommends that 10 mm of water be applied on hot summer days with RH less than 60%.
Temporary increases in PM10 emission may also arise from weathering of crusts formed using a dust suppressant. For instance, Kavouras et al. (Citation2009) found that crusts formed from three separate concentrations of tall oil pitch gradually eroded over time, experiencing temporal increases in spalling and PM10 emission. Likewise, a study of dust suppressant efficacy on unpaved roads found that within four and a half months following application, the treated surfaces deteriorated to a point where they exhibited rates of emission similar to the untreated control surface (Sanders et al. Citation1997). Over the course of the 24-week experiment at Nephton, however, PM10 emission rates appear to scale inversely with GMC but do not demonstrate a definitive increase through time. For example, the highest PM10 emission fluxes observed seven weeks after application (M3) correspond to the lowest water contents measured (GMC< 5%; ).
A final factor to be considered is the resuspension of dust deposited onto the test plots treated with the four commercial dust suppressants. External dust inputs onto the experimental plots may have originated as emissions originating from/with:
bare patches of ground within the vegetation bordering the test plots. These were created by the passage of heavy equipment required for preparation of the test plots.
traffic on the berm roads bordering the tailings ponds and along the main haul road from the mine entrance to the mill.
saltation of sand particles throughout the field site (Ogungbemide Citation2017).
wildlife activity/trampling.
Field tests: PI-SWERL PM10 emission rate measurements after physical disturbance
Once disturbed by two passes of a skid steer track loader, the visibly brittle crusts on the EN, EA, and SS plots fractured, exposing large areas of the under-lying tailings. The LN, W, and C plots did not appear to have a sufficient level of crusting to fracture into segments but displayed track marks after disturbance (). All of the field plots emitted substantially more PM10 than from the undisturbed sections of the plots (). As a result, the target RPMs for the PI-SWERL tests on the day of the disturbance (D) had to be lowered by ~ 50% to avoid saturating the nephlometers (DT). When using to compare the emission rates from the initial measurements (M1) with those on the day of disturbance (D1), it is important to note that the friction velocities generated by the PI-SWERL are not directly comparable. Indeed, the D1 tests, conducted at much lower RPMs, still resulted in PM10 emissions one to two orders of magnitude higher than those measured on the undisturbed sections of the research plots on M1. All of the surfaces treated with a commercial dust suppressant were more emissive than the control plot, whereas the irrigated plot was least emissive.
Figure 12. Comparison of the emission fluxes, , for each test surface on the initial measurement date, M1, and on the day the surfaces were physically disturbed, D1.
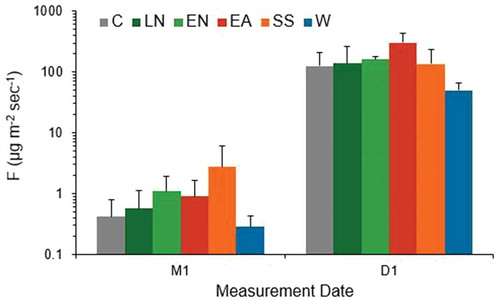
Figure 13. Comparison of the average PM10 emission fluxes, , for each test surface from the disturbed sections of the research plots. Note that the initial tests conducted on the day of disturbance were conducted at PI-SWERL RPMs reduced by more than 50%.
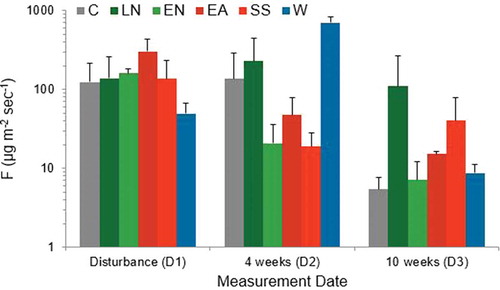
Fours weeks after physical disturbance, the three plots with no visible crusting (LN, W, and C) exhibited a marked decrease in the size of the ridges created by the loader’s tracks. On the other hand, the more noticeably crusted surfaces (EN, EA, and SS) retained a higher degree of roughness arising from crust fragmentation. Indeed, it is possible that the crust fragments created by the physical disturbance of the plots did afford some sheltering during subsequent emissions measurements. On D2 the three visibly crusted plots, EN, EA, and SS, were all less emissive than the control, whereas the LN and W plots were more emissive than the control (). After 10 weeks (D3), the dust emission rates had decreased further, except for the LN test plot which remained an order of magnitude higher (). The reasons for this are uncertain, although it should be noted that similar to the laboratory test trays, LN did not form a visible crust on the surface in the same manner as EN, EA, and SS. Therefore, there were no visible LN crust fragments overlying the tailings after disturbance. The post disturbance, temporal reduction in PM10 emissions from most of the plots could be due to several factors: wet weather conditions; aerodynamic sheltering by large sections of crust that remained intact; and most likely, gradual winnowing of the finest particles creating a supply limitation.
The results for the disturbed test plots are consistent with those from other field studies. In a comparison of four commercial dust suppressants carried out on unpaved roads in California, the surfaces that were found to have the most brittle crusts tended to break up and emit higher levels of PM10 (Gillies et al. Citation1999). The authors conclude that repeated disturbance caused reduction of these crusts into small aggregates of particles, which during transport, further contributed to dust emission. Research concerning biological crusts also has shown them to be vulnerable to disturbance, such that they experience significant wind erosion afterward (Belnap and Gillette Citation1998; Eldridge and Leys Citation2003; Houser and Nickling Citation2001a). In the current study, it is clear that all of the test plots became immediately vulnerable to wind erosion post disturbance, regardless of the dust suppressant applied. This would suggest that treatment of mine tailings with a commercial dust suppressant is not likely to be successful if the site is disturbed within a short period of time afterward, particularly in the case of a disturbance that is repetitive (e.g., truck traffic). Where water is available and can be applied immediately before a physical disturbance, sprinkling would appear to be the most effective form of dust suppression treatment, provided that suitable GMC levels can be attained.
Conclusion
In the wind tunnel study,
1. Three of the four commercial dust suppressants, Entac, EcoAnchor, and Soil Sement, protected the tailings from particle-free wind drag. Dust Fyghter LN100 was least effective, with PM10 emission fluxes two orders of magnitude higher than the other three products. The efficacy of the dust suppressants ranked from most effective to least effective as: EcoAnchor, Soil Sement, Entac, and Dust Fyghter LN100.
2. Dust Fyghter LN100 proved unable to withstand any abrasion by sand particles. The other test surfaces remained visibly unchanged after saltation; however, all three emitted 200–300 times more dust than during the particle-free tests and ranked from least emissive to most emissive as: EcoAnchor, Entac, and Soil Sement. In an industrial application, it would be advisable to assess the specific site conditions to determine the availability of sand-sized particles that may act as abraders during wind transport (saltation).
3. As compared to the initial particle-free experiments, all treated surfaces emitted substantially more fugitive dust after they were fractured through consistent application of a load transmitted through a pin array.
In the field experiment,
1. The average PM10 emission fluxes measured on the treated field plots suggest the following ranking, from most effective to least effective, in preventing dust emission: Water, Control, EcoAnchor, Dust Fyghter LN100, Soil Sement, Entac. This result is particularly interesting since it suggests that as compared to either the control or irrigated plots, none of the commercial dust suppressants improved on the mitigation of fugitive dust emission at the site. However, it should be noted that when averaged over the entire four-month duration of the field study, the mean emission rates obtained for all test plots were similar in magnitude. In addition, there was no temporal pattern detected in the dust emission rates and the results exhibit a high degree of variability. This would suggest that they were influenced more by field site conditions that could not be controlled, particularly precipitation and dust advection/resuspension, than dust suppressant efficacy.
2. All of the treatment plots were highly vulnerable to physical disturbance, and as a consequence, became much more emissive.
3. The field experiments comparing dust suppressant performance using a PI-SWERL turned out to be confounded by numerous natural geophysical processes operating at the site (e.g. dust advection and deposition, dust resuspension, raindrop impact during precipitation, weathering phenomena, biotic crust development, disturbance by wildlife). While these cannot be controlled, as in a laboratory experiment, this study points to the pivotal importance of continually monitoring such processes in future field studies so that their relative influence may be isolated and evaluated in rigorous statistical analyses.
Acknowledgments
The authors especially wish to thank the distributors of Dust Fyghter® LN100, EcoAnchor, Entac, and Soil Sement® for products donated for the experiments, and UNIMIN Ltd. (now Covia) for supporting the field experiments. Three anonymous reviewers provided very helpful comments on the initial draft of the manuscript.
Disclosure statement
No potential conflict of interest was reported by the authors.
Additional information
Funding
Notes on contributors
Colette Alexia Preston
Colette Alexia Preston is a Ph.D. candidate in the Environmental and Life Sciences Program at Trent University in Peterborough, Ontario, Canada.
Cheryl McKenna Neuman
Cheryl McKenna Neuman is a full professor in the School of the Environment at Trent University and is the director of the Trent Environmental Wind Tunnel.
J. Wayne Boulton
J. Wayne Boulton is a Technical Director specializing in windblown sand and dust with RWDI, headquartered in Guelph, Ontario, Canada.
References
- Bacon, S. N., E. V. McDonald, R. Amit, Y. Enzel, and O. Crouvi. 2011. Total suspended particulate matter emissions at high friction velocities from desert landforms. J. Geophys. Res.- Earth 116 (F3). doi: 10.1029/2011JF001965.
- Belnap, J., and D. A. Gillette. 1997. Disturbance of biological soil crusts: Impacts on potential wind erodibility of sandy desert soils in southeastern Utah. Land Degrad. Dev. 8 (4):355–62. doi:10.1002/(SICI)1099-145X(199712)8:4<355::AID-LDR266>3.0.CO;2-H.
- Belnap, J., and D. A. Gillette. 1998. Vulnerability of desert biological soil crusts to wind erosion: The influences of crust development, soil texture, and disturbance. J. Arid Environ. 39 (2):133–42. doi:10.1006/jare.1998.0388.
- Cahill, T. A., T. E. Gill, J. S. Reid, E. A. Gearhart, and D. A. Gillette. 1996. Saltating particles, playa crusts and dust aerosols at Owens (dry) Lake, California. Earth Surf. Proc. Land. 21 (7):621–39. doi:10.1002/(SICI)1096-9837(199607)21:7<621::AID-ESP661>3.0.CO;2-E.
- Eldridge, D. J., and J. F. Leys. 2003. Exploring some relationships between biological soil crusts, soil aggregation and wind erosion. J. Arid Environ. 53 (4):457–66. doi:10.1006/jare.2002.1068.
- Enssolutions. 2017. www.enssolutions.com.
- EP&A Envirotac, Inc. 2017. www.envirotac.com.
- Etyemezian, V., J. A. Gillies, M. Shinoda, G. Nikolich, J. King, and A. R. Bardis. 2014. Accounting for surface roughness on measurements conducted with PI-SWERL: Evaluation of a subjective visual approach and a photogrammetric technique. Aeolian Res. 13 (2014):35–50. doi:10.1016/j.aeolia.2014.03.002.
- Fan, T., G. Zhou, and J. Wang. 2018. Preparation and characterization of a wetting-agglomeration-based hybrid coal dust suppressant. Process Saf. Environ. 113:282–91. doi:10.1016/j.psep.2017.10.023.
- Fitz, D. R., and K. Bumiller. 2000. Evaluation of watering to control dust in high winds. J. Air Waste Manage. 50 (4):570–77. doi:10.1080/10473289.2000.10464037.
- Gilbert-Parkes, S. 2017. Fugitive dust management and revegetation strategies: The implications of dust suppressants on algal crust development on mine wastes. Unpublished honours thesis, Nephton, ON.
- Gillette, D. A. 1978. A wind tunnel simulation of the erosion of soil: Effect of soil texture, sandblasting, wind speed, and soil consolidation on dust production. Atmos. Environ. 12 (8):1735–43. doi:10.1016/0004-6981(78)90322-0.
- Gillies, J. A., and N. Lancaster. 2013. Large roughness element effects on sand transport, Oceano Dunes, California. Earth Surf. Proc. Land. 38 (8):785–92. doi:10.1002/esp.3317.
- Gillies, J. A., J. G. Watson, C. F. Rogers, D. DuBois, J. C. Chow, R. Langston, and J. Sweet. 1999. Long-term efficiencies of dust suppressants to reduce PM10 emissions from unpaved roads. J. Air Waste Manage. 49 (1):3–16. doi:10.1080/10473289.1999.10463779.
- Grant, P. F., and W. G. Nickling. 1998. Direct field measurement of wind drag on vegetation for application to windbreak design and modelling. Land Degrad. Dev. 9 (1):57–66. doi:10.1002/(SICI)1099-145X(199801/02)9:1<57::AID-LDR288>3.0.CO;2-7.
- Houser, C. A., and W. G. Nickling. 2001a. The factors influencing the abrasion efficiency of saltating grains on a clay‐crusted playa. Earth Surf. Proc. Land. 26 (5):491–505. doi:10.1002/esp.193.
- Houser, C. A., and W. G. Nickling. 2001b. The emission and vertical flux of particulate matter <10 μm from a disturbed clay‐crusted surface. Sedimentology 48 (2):255–67. doi:10.1046/j.1365-3091.2001.00359.x.
- Kavouras, I. G., V. Etyemezian, G. Nikolich, J. Gillies, M. Sweeney, M. Young, and D. Shafer. 2009. A new technique for characterizing the efficacy of fugitive dust suppressants. J. Air Waste Manage. 59 (5):603–12. doi:10.3155/1047-3289.59.5.603.
- King, J., V. Etyemezian, M. Sweeney, B. Buck, and G. Nikolich. 2011. Dust emission variability at the Salton Sea, California, USA. Aeolian Res. 3 (1):67–79. doi:10.1016/j.aeolia.2011.03.005.
- Kok, J. F., E. J. Parteli, T. I. Michaels, and D. B. Karam. 2012. The physics of wind-blown sand and dust. Rep. Prog. Phys. 75 (10):106901.
- Landloc Environmental. 2017. www.landloc.ca.
- Langston, G., and C. McKenna Neuman. 2005. An experimental study on the susceptibility of crusted surfaces to wind erosion: A comparison of the strength properties of biotic and salt crusts. Geomorphology 72 (1):40–53. doi:10.1016/j.geomorph.2005.05.003.
- Leys, J. F., and D. J. Eldridge. 1998. Influence of cryptogamic crust disturbance to wind erosion on sand and loam rangeland soils. Earth Surf. Proc. Land. 23 (11):963–74. doi:10.1002/(SICI)1096-9837(1998110)23:11<963::AID-ESP914>3.0.
- McKenna Neuman, C. 2003. Effects of temperature and humidity upon the entrainment of sedimentary particles by wind. Bound.-Lay. Meteorol. 108 (1):61–89. doi:10.1023/A:1023035201953.
- McKenna Neuman, C., J. W. Boulton, and S. Sanderson. 2009. Wind tunnel simulation of environmental controls on fugitive dust emissions from mine tailings. Atmos. Environ. 43 (3):520–29. doi:10.1016/j.atmosenv.2008.10.011.
- McKenna Neuman, C., and C. Maxwell. 1999. A wind tunnel study of the resilience of three fungal crusts to particle abrasion during aeolian sediment transport. Catena 38 (2):151–73. doi:10.1016/S0341-8162(99)00043-0.
- McKenna Neuman, C., and C. Maxwell. 2002. Temporal aspects of the abrasion of microphytic crusts under grain impact. Earth Surf. Proc. Land. 27 (8):891–908. doi:10.1002/esp.360.
- McKenna Neuman, C., C. Maxwell, and C. Rutledge. 2005. Spatial and temporal analysis of crust deterioration under particle impact. J. Arid Environ. 60 (2):321–42. doi:10.1016/j.jaridenv.2004.04.007.
- McKenna Neuman, C., C. D. Maxwell, and J. W. Boulton. 1996. Wind transport of sand surfaces crusted with photoautotrophic microorganisms. Catena 27 (3):229–47. doi:10.1016/0341-8162(96)00023-9.
- Midwest Industrial Supply. 2017. http://midwestind.com.
- Nickling, W. G., and C. McKenna Neuman. 1997. Wind tunnel evaluation of a wedge-shaped aeolian sediment trap. Geomorphology 18 (3):333–45. doi:10.1016/S0169-555X(96)00040-2.
- O’Brien, P., and C. McKenna Neuman. 2012. A wind tunnel study of particle kinematics during crust rupture and erosion. Geomorphology 173:149–60. doi:10.1016/j.geomorph.2012.06.005.
- Ogungbemide, D. I. 2017. Investigation of fugitive dust emission from nepheline syenite mine tailings near. Unpublished Ph.D. thesis, Nephton, Ontario.
- Okin, G. S. 2008. A new model of wind erosion in the presence of vegetation. J. Geophys. Res-Earth 113 (F2).
- Preston, C. A. 2015a. The effectiveness of vegetation in controlling dust emissions from the tailings ponds at the Unimin Ltd Nephton Mine. Unpublished honours thesis.
- Preston, C. A. 2015b. An assessment of the vegetation cover on the tailings ponds at the Unimin Ltd Nephton Site. Unpublished technical report commissioned by Unimin Ltd.
- Rice, M. A., and I. K. McEwan. 2001. Crust strength: A wind tunnel study of the effect of impact by saltating particles on cohesive soil surfaces. Earth Surf. Proc. Land. 26 (7):721–33. doi:10.1002/esp.217.
- Rice, M. A., B. B. Willetts, and I. K. McEwan. 1996. Wind erosion of crusted soil sediments. Earth Surf. Proc. Land. 21 (3):279–93. doi:10.1002/(SICI)1096-9837(199603)21:3<279::AID-ESP633>3.0.CO;2-A.
- Sanders, T. G., J. Q. Addo, A. Ariniello, and W. F. Heiden. 1997. Relative effectiveness of road dust suppressants. J. Transp. Eng. 123 (5):393–97. doi:10.1061/(ASCE)0733-947X(1997)123:5(393).
- Sanderson, R. S., C. McKenna Neuman, and J. W. Boulton. 2014. Windblown fugitive dust emissions from smelter slag. Aeolian Res. 13:19–29. doi:10.1016/j.aeolia.2014.02.005.
- Skidmore, E. L., and L. J. Hagen. 1977. Reducing wind erosion with barriers. T. Asae 20 (5):911–15. doi:10.13031/2013.35674.
- Stantec Consulting Inc. 2005. Entac emulsions: Information Brief for the environmental choice™ program. www.enssolutions.com.
- Sweeney, M., V. Etyemezian, T. Macpherson, W. G. Nickling, J. Gillies, G. Nikolich, and E. McDonald. 2008. Comparison of PI‐SWERL with dust emission measurements from a straight‐line field wind tunnel. J. Geophys. Res.-Earth 113 (F1). doi: 10.1029/2007JF000830.
- Van Duk, P. M., and L. Stroosnijder. 1996. The influence of rainfall on transport of beach sand by wind. Earth Surf. Proc. Land 21:352. doi:10.1002/(SICI)1096-9837(199604)21:4<341::AID-ESP542>3.0.
- Wang, X., J. C. Chow, S. D. Kohl, L. N. R. Yatavelli, K. E. Percy, A. H. Legge, and J. G. Watson. 2015. Wind erosion potential for fugitive dust sources in the Athabasca oil sands region. Aeolian Res. 18:121–34. doi:10.1016/j.aeolia.2015.07.004.
- Wang, X. M., C. X. Zhang, E. Hasi, and Z. B. Dong. 2010. Has the Three Norths forest shelterbelt program solved the desertification and dust storm problems in arid and semiarid China? J. Arid Environ. 74 (1):13–22. doi:10.1016/j.jaridenv.2009.08.001.
- Williams, J. D., J. P. Dobrowolski, N. E. West, and D. A. Gillette. 1995. Microphytic crust influence on wind erosion. T. Asae 38 (1):131–37. doi:10.13031/2013.27821.
- Wolfe, S. A., and W. G. Nickling. 1993. The protective role of sparse vegetation in wind erosion. Prog. Phys. Geog. 17 (1):50–68. doi:10.1177/030913339301700104.