
ABSTRACT
Smoke from burning biomass is an important source of fine particulate matter (PM2.5), but the health risks may not be fully captured by the Canadian Air Quality Health Index (AQHI). In May 2018, the province of British Columbia launched an evidence-based amendment (AQHI-Plus) to improve AQHI performance for wildfire smoke, but the AQHI-Plus was not developed or tested on data from the residential woodsmoke season. This study assesses how the AQHI and AQHI-Plus are associated with acute health outcomes during the cooler seasons of 2010–2017 in British Columbia, Canada. Monthly and daily patterns of temperature and PM2.5 concentrations were used to identify Local Health Areas (LHAs) that were impacted by residential woodsmoke. The effects of the AQHI and AQHI-Plus on five acute health outcomes (including non-accidental mortality, outpatient physician visits, and medical dispensations for cardiopulmonary conditions) were estimated using generalized linear mixed effect models with Poisson distributions adjusted for long- and short-term temperature trends. Values of the Akaike information criterion (AIC) were compared to evaluate whether the AQHI or AQHI-Plus was better fitted to each health outcome. Eleven LHAs were categorized as woodsmoke-impacted. In these LHAs, the AQHI and AQHI-Plus associations with acute health outcomes were sensitive to temperature adjustments. After temperature adjustments, the most consistent associations were observed for the two asthma-specific outcomes where the AQHI-Plus was better fitted than the AQHI. The improved performance of the AQHI-Plus for susceptible populations with asthma is consistent between communities impacted by residential woodsmoke and wildfire smoke.
Implications: Canada’s Air Quality Health Index (AQHI) is a three pollutant index used to communicate the short term health impact of degraded air quality. As fine particulate matter (PM2.5) is the lowest weighted pollutant in the AQHI, the index is poorly reflective of woodsmoke impacts. The present analysis found that an AQHI amendment developed for improved sensitivity to PM2.5 during wildfire seasons (AQHI-Plus) is also more predictive of acute asthma-related health outcomes in communities impacted by residential woodsmoke. The BC Ministry of Environment and Climate Change Strategy has piloted the AQHI-Plus year-round. Other jurisdictions should consider whether their air quality indices are reflective of the risks posed by woodsmoke.
Introduction
Residential wood burning for domestic heating, cooking, and recreation is still common in many high-income countries, leading to increased wintertime concentrations of fine particulate matter (PM2.5) in communities with otherwise excellent air quality (Glasius et al. Citation2006; Jeong et al. Citation2008; Meng et al. Citation2019; Tunno et al. Citation2019; Ward, Rinehart, and Lange Citation2006; Yli-Tuomi et al. Citation2015). The health risks associated with exposure to residential woodsmoke have been well-documented. Observational studies have consistently found links with respiratory symptoms and increased respiratory-related physician and hospital visits, particularly in children (Boman, Forsberg, and Jarvholm Citation2003; Naeher et al. Citation2007; Rokoff et al. Citation2017). These findings are supported by experimental studies evaluating the short-term impacts of controlled exposures to woodsmoke (Barregard et al. Citation2006; Ghio et al. Citation2012; Riddervold et al. Citation2011; Unosson et al. Citation2013).
In British Columbia, Canada, residential wood burning is a common practice. Approximately 30% of homes outside of Metro Vancouver continue to use wood burning appliances for an average of five days per week in the winter (Mustel Group Citation2012). While the air quality impacts of residential wood burning can be quantified by woodsmoke markers such as levoglucosan (Simoneit et al. Citation1999), this information is not routinely collected on a province-wide scale. Therefore, different models and algorithms have been developed to assess woodsmoke impacts using combinations of regulatory air quality measurements, mobile monitoring, remote sensing, levoglucosan concentrations, and other relevant meteorological data (Hong et al. Citation2017; Larson et al. Citation2007; MacIntyre et al. Citation2011; Weichenthal et al. Citation2017). Epidemiologic studies in the province have used these methods to associate long-term woodsmoke exposure with increased otitis media in children (MacIntyre et al. Citation2011) and acute woodsmoke exposure with increased risk of myocardial infarction in older adults (Weichenthal et al. Citation2017). Such studies have made residential woodsmoke a priority target for local air quality improvements and for continued dialogue about the health effects of air pollution.
The Air Quality Health Index (AQHI) was developed in Canada as a tool for communicating the acute health risks of current and forecasted air quality conditions (Government of Canada Citation2017). The AQHI is expressed on a scale of 1 to 10+, with values categorized as low (1–3), moderate (4–6), high (7–10), and very high (10+) health risk. Each category has an associated health message to communicate how individuals can modify their behavior to reduce personal exposure. The AQHI is normally calculated using the 3-hour running average concentrations of nitrogen dioxide (NO2), ground-level ozone (O3), and PM2.5. This formulation was based on its association with mortality in twelve urban Canadian cities (Stieb et al. Citation2008). One ongoing concern with the AQHI is that PM2.5 has the smallest coefficient in the equation, but PM2.5 is the dominant pollutant in biomass smoke from sources such as wildfires, slash burning, and residential wood burning. These sources all have relatively smaller impacts on ambient NO2 and O3 concentrations, which have larger coefficients in the AQHI equation.
An amended AQHI is reported in Alberta to capture rapid increases in various pollutants (Government of Alberta Citation2020). There, the AQHI is set to a high or very high risk value when certain pollutants exceed their provincial target value. A similar approach was taken in British Columbia where the AQHI was set to a high risk value when the previous 1-hour PM2.5 exceeded 60 μg/m3. This was known as the Trump & Hold AQHI-Plus amendment (Yao et al. Citation2019). Public feedback indicated that a sudden jump to a high index value did not effectively communicate risk just below the jump threshold (BCACV Citation2017). For example, a 1-hour PM2.5 value of 60 μg/m3 would yield a high risk value, but 59 μg/m3 could still yield a low risk value.
Our previous work evaluated various AQHI-Plus amendments and found that a 1-hour PM2.5 only AQHI-Plus was most indicative of acute respiratory health outcomes during wildfire seasons (Yao et al. Citation2019). That amendment was implemented in British Columbia starting in May 2018, but it remains unclear whether the same AQHI-Plus is more predictive of acute health outcomes when air quality is affected by biomass smoke from other sources, such as residential wood burning. Although PM2.5 remains the primary health implicating pollutant from wildfires and residential wood burning, their smoke exposure profiles are very different (). Wildfire smoke generally causes sporadic, episodic, and widespread air quality degradation with very high PM2.5 concentrations in the summer months, when people spend more time outdoors and respiratory infection rates are lower. In comparison, residential woodsmoke generally causes regular, overnight, and localized air quality degradation with moderate PM2.5 concentrations during the winter months, when people spend more time indoors and respiratory infection rates are higher. This study aims to compare the 3-hour 3-pollutant AQHI with the 1-hour PM2.5-only AQHI-Plus for prediction of acute health outcomes in areas of British Columbia that are impacted by residential woodsmoke.
Figure 1. Sample one-week time series of AQHI, AQHI-Plus, and fine particulate matter (PM2.5) hourly values from 2015 in Howe Sound, an area with both wildfire and residential wood burning impacts. Vertical x-axis lines represent the 00:00 hour mark of that day in the time series.
Methods
Study setting
British Columbia is a mountainous province situated on the west coast of Canada (). The provincial population is approaching 5 million people with approximately half living in the Metro Vancouver urban area. The other half are distributed over 940,000 km2 in smaller cities, towns, and remote areas. Many of these places have high residential woodsmoke impacts throughout the winter months due to the availability of inexpensive firewood (Mustel Group Citation2012) and the provincial topography. The mountain valleys and coastal areas commonly experience temperature inversions that trap woodsmoke in the surface layer of the atmosphere (Brook et al. Citation2014).
Figure 2. Local Health Area (LHA) boundary map of British Columbia displaying LHAs included in the study and locations of the Air Quality Health Index (AQHI) and weather stations.
This analysis covered the cooler months of October to April, beginning January 1, 2010 and ending December 31, 2017 (1,698 days). The province is divided into 89 Local Health Areas (LHAs), which were the smallest geographic units for health data aggregation during the study period.
Health data
The British Columbia Center for Disease Control has a mandate to conduct routine health surveillance using data feeds made available for this purpose. Daily counts for the following five health outcomes were retrieved for each LHA: (1) non-accidental mortality, where cause of death is coded according to the International Classification of Diseases, 10th revision (excluding accidental death ICD-10 codes starting with S through Z) (CIHI Citation2020); (2) outpatient physician visits for all cardiovascular conditions, coded according to the International Classification of Diseases, 9th revision (ICD-9 codes 390– 459) (British Columbia Ministry of Health Citation2013); (3) outpatient visits for all respiratory conditions (ICD-9 codes 460– 519); (4) outpatient visits specifically for asthma (ICD-9 code 493); and (5) salbutamol sulfate inhaler dispensations. Salbutamol sulfate (e.g. Ventolin®) is a common medication for the acute relief of asthma and chronic obstructive pulmonary disease (COPD) symptoms, and inhaler dispensations have previously been associated with wildfire smoke in British Columbia (Elliott, Henderson, and Wan Citation2013). The mortality data were extracted from the provincial Vital Statistics database, outpatient visit data were extracted from the provincial Medical Services Plan billings database, and dispensation data were extracted from the provincial PharmaNet database.
Air quality data
Publicly available 1-hour PM2.5 (µg/m3), O3 (ppb), and NO2 (ppb) data were downloaded from the provincial air quality monitoring network (British Columbia Ministry of Environment and Climate Change Strategy Citation2018). Each study LHA was assigned data from the AQHI monitoring station within its boundary (). For study LHAs that had multiple stations, one station was selected based on data completeness and population proximity.
For every hour in each LHA, the AQHI and the AQHI-Plus values were calculated. Values over 10 were truncated to 11 to remain consistent with how the AQHI and AQHI-Plus are reported. The AQHI was calculated using its standard 3-hour 3-pollutant formula (Stieb et al. Citation2008). The AQHI-Plus was taken as the higher value between: (1) the 3-hour 3-pollutant AQHI; or (2) the 1-hour 1-pollutant amendment, which is calculated as the ceiling value of the 1-hour PM2.5 concentration divided by 10 (Yao et al. Citation2019). Therefore, the AQHI-Plus is identical to the AQHI when the 1-hour PM2.5-only value is lower than or equal to the 3-hour 3-pollutant value. The 1-hour PM2.5 only calculation is based on a linear extrapolation between two anchor points. First, the index reaches 4 (i.e., AQHI moderate risk) when the 1-hour PM2.5 concentrations are over 30 μg/m3, which is an estimated threshold for odor perception of burning softwood (Kistler et al. Citation2012). Second, the index reaches 7 (i.e., AQHI high risk) when the 1-hour PM2.5 concentrations are over 60 μg/m3, which is strongly predictive of the 24-hour average exceeding the provincial PM2.5 objective of 25 μg/m3, when air quality advisories are typically issued (Yao et al. Citation2019).
The daily AQHI and AQHI-Plus values were set as the maximum 1-hour value observed in the 24-hour period prior to 09:00 of that day. This window was chosen to reflect the diurnal distribution of PM2.5 exposures caused by residential woodsmoke, where the highest concentrations are typically observed during the late night and early morning hours (Hong et al. Citation2017). With the exception of mortality, most of the study health outcomes would only occur during business hours and we assumed that smoke-related outcomes in the daytime would be associated with higher exposure during the preceding evening or day. If more than 75% of the 1-hour AQHI or AQHI-Plus values were missing in the 24-hour period, the daily AQHI or AQHI-Plus value was considered missing. All LHAs outside of Metro Vancouver that had daily AQHI and AQHI-Plus values on at least 20% of days during the study period were included. This threshold included LHAs with stations that have data in all study months for at least two years.
Temperature data
Temperature data for all of British Columbia were downloaded from the Environment and Climate Change Canada archives (Government of Canada Citation2018). The nearest weather station was assigned to each study LHA () and daily mean apparent temperature values were calculated (Steadman Citation1984). Missing 1-hour values were imputed from a spline of same-day values if three or fewer 1-hour values were missing from a day (2% of days). If more than three 1-hour values were missing, a distance-weighted average of measurements from the nearest two stations was used (0.6% of days).
Identification of woodsmoke-impacted areas
In previous work, we developed an algorithm to classify days as being impacted by residential woodsmoke using routinely measured temperature and PM2.5 data (Hong et al. Citation2017). The algorithm was not designed for accurate day-to-day classification, but rather for rapid identification and prioritization of highly-impacted communities. The same algorithm was applied in this study to identify woodsmoke-impacted areas. A single day was classified as woodsmoke-impacted if all of the following were true: (1) the mean daily temperature was less than 13°C; (2) the standard deviation of 1-hour PM2.5 measurements was greater than 3 µg/m3; and (3) the ratio of mean daytime (09:00– 18:00) to mean nighttime (18:00– 09:00) PM2.5 was less than 0.5. All LHAs were then ranked by the percentage of days classified as woodsmoke-impacted and PM2.5 heat maps were plotted for each LHA by time-of-day and month-of-year. PM2.5 values were standardized within each LHA and months with intense wildfire activity – July to September 2010, 2014, 2015, and 2017 – were removed. We considered the algorithm results along with the plotted PM2.5 temporal trends to decide which LHAs could be reasonably identified as woodsmoke-impacted.
Statistical analysis
The daily AQHI and AQHI-Plus values were regressed against the daily health outcome counts in the woodsmoke-impacted areas using generalized linear mixed effects models with a Poisson distribution and logit link, accounting for the random effects of LHAs. The models were offset by the annual LHA population (BC Stats Citation2019). Covariates in the models included an indicator of weekends and holidays and terms for the same-day and 21-day mean apparent temperature. The temperature terms were fit with a natural cubic spline with three degrees of freedom. The 21-day term was included because cold temperatures are known to impact health on this time scale (Gasparrini et al. Citation2015). We also ran the analyses with same-day temperature only and with no temperature controls to assess the impact of the temperature term(s) on the AQHI and AQHI-Plus coefficients. To assess whether the aggregate results were influenced by any individual LHA(s), we also ran the analyses excluding each LHA. The Akaike information criterion (AIC) was used to compare the degree of model fit between the AQHI and AQHI-Plus, where a smaller AIC value indicates less information lost and a better fit. All data preparation and analysis was completed in the R statistical computing environment (R Core Team Citation2017). The regression models were computed with the lme4 package version 1.1–19 (Pinheiro et al. Citation2017).
Results
Woodsmoke-impacted areas
Twenty-one LHAs met the inclusion criteria of (1) being outside Metro Vancouver and (2) having adequate data for calculation of the AQHI and AQHI-Plus on more than 20% of days (). Twelve LHAs had AQHI monitoring stations with over 75% complete data and eighteen LHAs had stations with complete data for roughly half of the study period. Missing data were primarily due to stations being established or discontinued during the study period.
The number of days with complete data for the woodsmoke-impacted detection algorithm ranged from 462 to 1,676 across the LHAs (). When ordering LHAs by percent of days classified as woodsmoke-impacted, the top eleven LHAs exhibited the monthly and hourly PM2.5 patterns associated with residential wood burning, with elevated PM2.5 concentrations during the nighttime hours of the colder months (). The remaining ten LHAs had many fewer days categorized as woodsmoke-impacted () and did not have the monthly and hourly PM2.5 pattern to suggest that residential wood burning is a dominant source of PM2.5.
Table 1. Results from the woodsmoke-impacted detection algorithm sorted by percentage of days with data that were classified as woodsmoke-impacted. The study period included 1,698 days during the months of October to April, beginning January 1, 2010 and ending December 31, 2017.
Figure 3. Mean fine particulate matter (PM2.5) plotted by Local Health Area (LHA), time of day, and month. LHAs are ordered by the percent of woodsmoke impacted days (). The PM2.5 values are standardized within their respective LHA. Months with intense wildfire activity are excluded (July to September in 2010, 2014, 2015, and 2017).
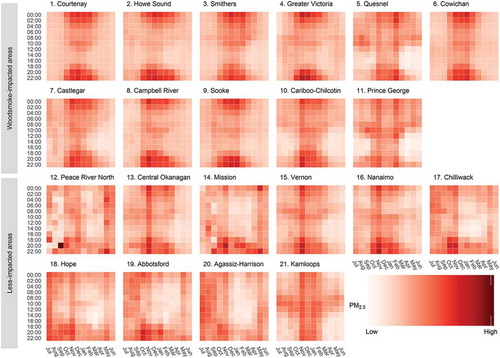
The top eleven LHAs ordered by percent of woodsmoke-impacted days were considered as woodsmoke-impacted areas, while the remaining ten LHAs were considered as less-impacted areas. The woodsmoke-impacted areas were, on average, colder and less populated than the less-impacted areas. They also had higher average AQHI, AQHI-Plus, and PM2.5 values, and lower average NO2 concentrations (). The AQHI-Plus was often triggered in the woodsmoke-impacted areas, particularly in the nighttime hours of the winter months, but it was rarely triggered in the less-impacted areas ().
Table 2. Summary descriptions of the woodsmoke-impacted areas compared with the less-impacted areas.
Figure 4. The percentage of hours during which the Air Quality Health Index (AQHI) was overridden by a greater AQHI-Plus value, shown by Local Health Area (LHA), time of day, and month. The LHAs are ordered by the percent of woodsmoke-impacted days (). Months with intense wildfire activity are excluded (July to September in 2010, 2014, 2015, and 2017).
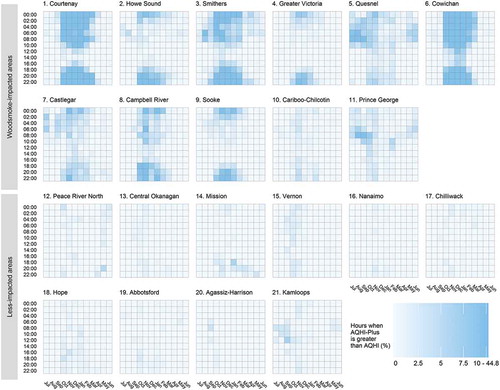
In the less impacted areas, AQHI-Plus daily exposure was based on the 3-hour 3-pollutant AQHI for approximately 98% of days. There was limited utility in comparing the AQHI and the AQHI-Plus in these areas because they were essentially equivalent. As such, we restricted the health analyses to the woodsmoke-impacted areas where approximately 20% of AQHI-Plus daily exposures were based on the 1-hour 1-pollutant amendment rather than the 3-hour 3-pollutant AQHI.
Health analysis
The number of daily observations available for the health analyses varied depending on the outcome. The mortality model included 14,360 daily observations, the salbutamol model included 13,718 observations, and each of the respiratory, cardiovascular, and asthma physician visit models included 9,797 observations. The distribution of daily values varied between the AQHI and AQHI-Plus in the woodsmoke-impacted areas (). The majority of AQHI values were in the low and moderate risk categories (i.e., 1 to 6). In comparison, the AQHI-Plus had fewer low risk values and more values in the moderate and high risk categories (i.e., 4 to 10+).
Table 3. Frequency distribution of Air Quality Health Index (AQHI) and AQHI-Plus daily values used in the study for the woodsmoke-impacted areas.
When the AQHI and AQHI-Plus were used to model the five acute health outcomes in the woodsmoke-impacted areas, the AQHI-Plus provided a better fit for all outcomes except respiratory physician visits ( and ). This outcome was particularly sensitive to the control terms for short- and long-term apparent temperature. Without any temperature control, 1-unit increases in the AQHI and AQHI-Plus were associated with statistically significant 2.7% [2.4%, 3.0%] and 1.9% [1.6%, 2.2%] increases in respiratory physician visits, respectively. When long- and short-term temperature controls were added to the model, these associations were no longer statistically significant and dropped to −0.4% [−0.8%, −0.1%] and 0.2% [−0.1%, 0.4%] changes for the AQHI and AQHI-Plus, respectively.
Table 4. AIC values for models fit for the AQHI and AQHI-Plus to each health outcome, controlling for both 21-day rolling average apparent temperature and same-day apparent temperature.
Figure 5. Relative rates and confidence intervals for 1-unit increases in the AQHI and AQHI-Plus for each health outcome: i) controlling for both 21-day rolling average apparent temperature and same-day apparent temperature; ii) controlling for same-day apparent temperature; and iii) without any temperature control. For models with both long- and short-term temperature controls, model fit was assessed using the Akaike information criterion (AIC), where a lower value indicates a better fit.
The AQHI and AQHI-Plus were both positively associated with non-accidental mortality, though they were not statistically significant. The effect of control for apparent temperature also influenced these models. Without any temperature control, the effects of 1-unit increases in the AQHI and AQHI-Plus were similar, associated with 0.7% [−1.1%, 2.6%] and 1.1% [−0.1%, 2.3%] increases in non-accidental mortality, respectively. When long- and short-term temperature controls were added to the model, these effects were reduced to a 0.1% decrease [−1.9%, 1.9%] for the AQHI and a 0.6% increase [−0.6%, 1.9%] for the AQHI-Plus. The AQHI and AQHI-Plus relationships with cardiovascular physician visits were much smaller, with less evident sensitivity to the temperature controls. When controlling for both long- and short-term temperature trends, 1-unit increases in the AQHI and AQHI-Plus were associated with −0.1% [−0.4%, 0.2%] and 0.3% [0%, 0.5%] changes in cardiovascular-related physician visits, respectively, where the latter was marginally significant. The AQHI-Plus was better fit to both mortality and cardiovascular physician visits when compared with the AQHI.
The asthma-specific outcomes exhibited the most consistent associations with the AQHI-Plus. For asthma-related physician visits, a 1-unit increase in the AQHI-Plus was associated with a statistically significant 1.1% [0.4%, 1.8%] increase in the outcome, while the same change in the AQHI was associated with a statistically insignificant −0.2% [−1.3%, 0.8%] effect. For salbutamol dispensations, the changes associated with 1-unit increases in the AQHI and AQHI-Plus were both statistically significant at 0.5% [0%, 0.9%] and 0.9% [0.6%, 1.2%], respectively. In both cases, control for ambient temperature trends led to limited adjustment of the effect estimates and the AQHI-Plus was better fitted to the data compared with the AQHI.
Discussion
This study compared the 3-hour 3-pollutant AQHI with the 1-hour 1-pollutant (PM2.5) AQHI-Plus as indicators of acute health risk in areas of British Columbia, Canada that are impacted by residential woodsmoke. Compared with the AQHI, the AQHI-Plus was better fitted to all of the health outcomes except respiratory physician visits, for which the associations were null after short- and long-term temperature adjustments. Models using the AQHI-Plus produced consistently higher effect estimates than models using the AQHI, and they were often elevated when the AQHI estimates were null. This was particularly evident for asthma-specific physician visits. Salbutamol dispensations were the only acute outcome for which both the AQHI and AQHI-Plus indicated significant elevated risk. Here, the AQHI-Plus was better fitted to the data. Due to its lower sensitivity to PM2.5, it is possible that the AQHI does not generate enough values in the moderate to high exposure categories () to capture the acute health risk posed by degraded air quality in woodsmoke-impacted areas. In addition, the 1-hour formulation of the AQHI-Plus may be better capturing rapid changes in woodsmoke concentrations. A 1-hour 3-pollutant AQHI performed similarly to the 3-hour 3-pollutant AQHI; the AQHI-Plus remained the best fitting model [Figure S1].
Temperature played an important role in the relationships between the acute health outcomes we examined and the AQHI and AQHI-Plus values, particularly for respiratory physician visits. During British Columbia winters, respiratory physician visits are primarily due to acute respiratory infections, which accounted for 60% of the visits included in these analyses. Although air pollution is associated with increased risk of respiratory infections (Chauhan and Johnston Citation2003; Laumbach and Kipen Citation2012), we found a large confounding effect from cold ambient temperatures. Further, the lag between residential woodsmoke exposure and the onset of respiratory infections may be longer than the 24-hour window considered in these analyses, though same-day associations have been found with air pollution more broadly (Nhung et al. Citation2017).
Cold ambient temperatures also had a confounding effect on non-accidental mortality. Evidence for the effect of residential woodsmoke on mortality is limited compared with the evidence on morbidity outcomes (Naeher et al. Citation2007). It is possible that the peak magnitudes of exposure in these analyses were not high enough to statistically detect an acute mortality effect. Nonetheless, broad categories of morbidity and mortality may not be the most informative indicators of acute health risk from residential woodsmoke when compared with asthma-specific outcomes.
A multi-step process was used to identify areas where air quality is impacted by residential wood burning. This was in lieu of province-wide data for a woodsmoke marker such as ambient levoglucosan. We started by excluding Metro Vancouver from the analysis despite acknowledgment that residential wood burning is an important source of wintertime air pollution in the region (Larson et al. Citation2007; MacIntyre et al. Citation2011; Metro Vancouver Citation2017; Weichenthal et al. Citation2017). Because our method relied on temporal patterns in PM2.5 concentrations, the relatively lower residential woodsmoke prevalence in this urban area may have been obscured by the relatively larger PM2.5 contributions from other sources such as transportation. Although we were not able to statistically control for other specific sources of air pollution (Government of Canada Citation2020; Meng et al. Citation2019), the multi-step process did provide information on areas where residential wood burning is a dominant source of PM2.5. The 11 LHAs identified as woodsmoke-impacted fit the a priori expectations of being colder, less populated (), and located in surveyed regions where residential wood burning is more prevalent (Mustel Group Citation2012).
A leave-one-out sensitivity analysis of LHAs demonstrated internally consistent results, with the exception of the Greater Victoria exclusion which led to increased risk for all physician visit outcomes for both the AQHI and AQHI-Plus where the AQHI-Plus was better fit to all modeled relationships (). Greater Victoria is different from the other LHAs categorized as woodsmoke-impacted because it is an urban area with a population density of approximately 2000 persons/km2 compared with a mean of 40 persons/km2 among other the woodsmoke-impacted LHAs. It is possible that urban air quality impacts obscure the residential woodsmoke impact that we intended to examine in these analyses.
Figure 6. Relative rates and confidence intervals for 1-unit increases in the AQHI and AQHI-Plus for each health outcome for the leave-one-out sensitivity analysis of Local Health Areas (LHAs). Models are adjusted for 21-day rolling average apparent temperature and same-day apparent temperature. Removed LHAs are ordered left-to-right by the percent of woodsmoke-impacted days ().
The population-based approach to this study allowed for region-wide inferences with readily available data, but it has some limitations. Physician visits were used as a measure of treatment-seeking behavior due to poor air quality, but we were not able to assess the impact of residential woodsmoke on respiratory and cardiovascular symptoms themselves, as other studies have done (Naeher et al. Citation2007). A notable example is a study of older adults conducted in Prince George during the winters of 2014 and 2015, which found that the AQHI was consistently associated with subclinical daily changes in heart rate, blood pressure, and forced expiratory volume (Stieb et al. Citation2018). Such direct measurements at an hourly scale may be a better indicator of acute health risk for residential woodsmoke, given the strong diurnal pattern in the exposure profile, which generally has the highest exposures overnight when healthcare facilities are closed. The health data used were only available as daily counts, so we could not assess hourly trends, as has been done more recently to show that wildfire smoke has health impacts within the first hours of exposure (Yao et al. Citation2020). Moreover, we chose the daily exposure window as the 24-hour period preceding 09:00 under the assumption that individuals were able to access care within one day of exposure and symptom onset. Our findings were not sensitive to revising this exposure window to 12- or 48-hours [Figure S2].
Another limitation is that air quality data were retrieved from a single fixed monitoring station in each LHA. Due to missing data from many stations across the province, we were limited to using 21 of the 72 provincial LHAs outside of Metro Vancouver. Still, the included LHAs represented approximately 68% of the provincial population outside of Metro Vancouver. Computing ecological exposure from fixed monitoring stations is also subject to exposure misclassification, particularly with the small-scale exposure variability evident in residential woodsmoke exposures (Su et al. Citation2007; Wagstaff Citation2018). This also meant we were not able to examine smoke dispersion and other spatial trends as they relate to population smoke exposure. Although spatial models of woodsmoke impacts have been created for some British Columbia communities (Larson et al. Citation2007; Millar Citation2012; Wagstaff Citation2018; Weichenthal et al. Citation2017), these would not have allowed us to study the effects of the AQHI and AQHI-Plus on health in woodsmoke-impacted regions across the province. Moreover, administrative data for environmental health surveillance in British Columbia are aggregated to the LHA level, limiting health analysis to this ecological scale.
Our previous research compared five AQHI-Plus amendments with the AQHI using the same health outcomes during the summer wildfire season (Yao et al. Citation2019) and found that the 1-hour PM2.5-only AQHI-Plus evaluated here was the most predictive of acute respiratory health risk, particularly for asthma-related outcomes. Analyses for the wildfire season found that the AQHI-Plus was associated with clear elevated risk of mortality (0.5% increase), cardiovascular physician visits (0.2% increase), and respiratory physician visits (0.6% increase). While similar effect estimates were found in the residential wood burning analyses, they were not statistically significant. This may be due to differences in the exposure profiles for the two pollutant sources. Wildfire is spatially and temporally sporadic, but smoke exposures tend to be uniformly high within affected communities. Residential wood burning is common in many rural and remote communities during the cooler seasons, but it produces relatively lower smoke exposures with stronger diurnal variation (). These factors may affect the ability to detect statistically significant associations between the AQHI-Plus and health outcomes in the general population over a 24-hour period with an ecological study design, particularly considering the confounding effect from cold ambient temperatures. Nonetheless, the AQHI-Plus was significantly associated with asthma-specific outcomes in both seasons with similar magnitudes. 1-unit increases in the AQHI-Plus were associated with a 1.7% and 1.1% increase in asthma physician visits for the wildfire and cooler season, respectively. The same associations for salbutamol dispensations were 1.1% in the wildfire season and 0.9% in the cooler season.
Conclusion
Our previous work found that a 1-hour PM2.5-only AQHI-Plus amendment was more indicative of acute respiratory health risk than the AQHI during wildfire seasons in British Columbia. Here we report that the same amendment is more indicative of acute asthma-related health risk in British Columbia communities impacted by residential woodsmoke. We also report that the AQHI-Plus is rarely triggered during wintertime in communities that are less impacted by woodsmoke or during periods that are not affected by woodsmoke or wildfire. Therefore, year-round and province-wide implementation of the AQHI-Plus can reflect health risk associated with wildfire smoke and residential woodsmoke with minimal change elsewhere. Based on these analyses, the British Columbia Ministry of Environment and Climate Change Strategy has extended the AQHI-Plus pilot to cover the entire year. Other jurisdictions across Canada and elsewhere should consider whether their air quality indices are adequately reflective of the risks from residential wood burning.
Supplemental Material
Download TIFF Image (49.4 MB)Supplemental Material
Download TIFF Image (49.4 MB)Acknowledgment
The authors thank Health Canada’s and the Journal of Air and Waste Management Association’s reviewers whose comments strengthened this work. The authors thank Kris Hong for sharing his woodsmoke-impacted detection and visualization code.
Disclosure statement
No potential conflict of interest was reported by the authors.
Supplementary material
Supplemental data for this paper can be accessed on the publisher’s website.
Additional information
Funding
Notes on contributors
Jeffrey Trieu
Jeffrey Trieu is an epidemiologist (correspondence: [email protected]) in Environmental Health Services of the British Columbia Centre for Disease Control.
Jiayun Yao
Jiayun Yao is a research associate in Environmental Health Services of the British Columbia Centre for Disease Control.
Kathleen E. McLean
Kathleen E. McLean is an environmental health scientist in Environmental Health Services of the British Columbia Centre for Disease Control.
Dave M. Stieb
Sarah B. Henderson is a senior scientist in Environmental Health Services of the British Columbia Centre for Disease Control.
Sarah B. Henderson
Dave M. Stieb is a public health physician and epidemiologist with the Healthy Environments and Consumer Safety Branch (HECSB) of Health Canada.
References
- Barregard, L., G. Sallsten, P. Gustafson, L. Andersson, L. Johansson, S. Basu, and L. Stigendal. 2006. Experimental exposure to wood-smoke particles in healthy humans: Effects on markers of inflammation, coagulation, and lipid peroxidation. Inhal. Toxicol. 18 (11):845–53. doi:10.1080/08958370600685798.
- BC Stats. 2019. Population estimates. https://www2.gov.bc.ca/gov/content/data/statistics/people-population-community/population/population-estimates.
- BCACV. 2017. Air quality health index concerns. Accessed June 29, 2020. https://breathecleanair.ca/wp-content/uploads/2017/09/BCACV-letter-re-AQHI-Concerns.pdf.
- Boman, B. C., A. B. Forsberg, and B. G. Jarvholm. 2003. Adverse health effects from ambient air pollution in relation to residential wood combustion in modern society. Scand. J. Work Environ. Health 29 (4):251–60. doi:10.5271/sjweh.729.
- British Columbia Ministry of Environment and Climate Change Strategy. 2018. Air quality monitoring: Verified hourly data - Datasets - Data catalogue. https://catalogue.data.gov.bc.ca/dataset/air-quality-monitoring-verified-hourly-data.
- British Columbia Ministry of Health. 2013. Electronic medical claims system inbound & outbound record specifications. https://www2.gov.bc.ca/assets/gov/health/practitioner-pro/medical-services-plan/teleplan-4-3-manual.pdf.
- Brook, J. R., T. F. Dann, E. Galarneau, D. Herod, and J. Charland. 2014. The state of air quality in Canada: National patterns. In Air quality management in Canada: Canadian perspectives on a global issue, ed. A. Taylor and E. McMillan, 43–67. Dordrecht, Netherlands: Springer Science.
- Chauhan, A. J., and S. L. Johnston. 2003. Air pollution and infection in respiratory illness. Br. Med. Bull. 68:95–112. doi:10.1093/bmb/ldg022.
- CIHI. 2020. Codes and classifications for clinical health data. https://www.cihi.ca/en/submit-data-and-view-standards/codes-and-classifications.
- Elliott, C. T., S. B. Henderson, and V. Wan. 2013. Time series analysis of fine particulate matter and asthma reliever dispensations in populations affected by forest fires. Environ. Health 12:11. doi:10.1186/1476-069X-12-11.
- Gasparrini, A., Y. Guo, M. Hashizume, E. Lavigne, A. Zanobetti, J. Schwartz, A. Tobias, S. Tong, J. Rocklöv, and B. Forsberg. 2015. Mortality risk attributable to high and low ambient temperature: A multicountry observational study. Lancet 386 (9991):369–75. doi:10.1016/S0140-6736(14)62114-0.
- Ghio, A. J., J. M. Soukup, M. Case, L. A. Dailey, J. Richards, J. Berntsen, R. B. Devlin, S. Stone, and A. Rappold. 2012. Exposure to wood smoke particles produces inflammation in healthy volunteers. Occup. Environ. Med. 69 (3):170–75. doi:10.1136/oem.2011.065276.
- Glasius, M., M. Ketzel, P. Wåhlin, B. Jensen, J. Mønster, R. Berkowicz, and F. Palmgren. 2006. Impact of wood combustion on particle levels in a residential area in Denmark. Atmos. Environ. 40 (37):7115–24. doi:10.1016/j.atmosenv.2006.06.047.
- Government of Alberta. 2020. Air quality health index - Calculation. https://www.alberta.ca/air-quality-health-index–calculation.aspx.
- Government of Canada. 2017. Air quality health index. https://www.canada.ca/en/environment-climate-change/services/air-quality-health-index.html.
- Government of Canada. 2018. Historical data - Climate. http://climate.weather.gc.ca/historical_data/search_historic_data_e.html.
- Government of Canada. 2020. Air pollutants emissions inventory online search. https://pollution-waste.canada.ca/air-emission-inventory/.
- Hong, K. Y., S. Weichenthal, A. Saraswat, G. H. King, S. B. Henderson, and M. Brauer. 2017. Systematic identification and prioritization of communities impacted by residential woodsmoke in British Columbia, Canada. Environ. Pollut. 220 (Pt B):797–806. doi:10.1016/j.envpol.2016.10.056.
- Jeong, C.-H., G. J. Evans, T. Dann, M. Graham, D. Herod, E. Dabek-Zlotorzynska, D. Mathieu, L. Ding, and D. Wang. 2008. Influence of biomass burning on wintertime fine particulate matter: Source contribution at a valley site in rural British Columbia. Atmos. Environ. 42 (16):3684–99. doi:10.1016/j.atmosenv.2008.01.006.
- Kistler, M., C. Schmidl, E. Padouvas, H. Giebl, J. Lohninger, R. Ellinger, H. Bauer, and H. Puxbaum. 2012. Odor, gaseous and PM10 emissions from small scale combustion of wood types indigenous to Central Europe. Atmos. Environ. 51:86–93. doi:10.1016/j.atmosenv.2012.01.044.
- Larson, T., J. Su, A. M. Baribeau, M. Buzzelli, E. Setton, and M. Brauer. 2007. A spatial model of urban winter woodsmoke concentrations. Environ. Sci. Technol. 41 (7):2429–36. doi:10.1021/es0614060.
- Laumbach, R. J., and H. M. Kipen. 2012. Respiratory health effects of air pollution: Update on biomass smoke and traffic pollution. J. Allergy Clin. Immunol. 129 (1):3–11; quiz 12-3. doi:10.1016/j.jaci.2011.11.021.
- MacIntyre, E. A., C. J. Karr, M. Koehoorn, P. A. Demers, L. Tamburic, C. Lencar, and M. Brauer. 2011. Residential air pollution and otitis media during the first two years of life. Epidemiology 22 (1):81–89. doi:10.1097/EDE.0b013e3181fdb60f.
- Meng, J., R. V. Martin, C. Li, A. van Donkelaar, Z. A. Tzompa-Sosa, X. Yue, J. W. Xu, C. L. Weagle, and R. T. Burnett. 2019. Source contributions to ambient fine particulate matter for Canada. Environ. Sci. Technol. 53 (17):10269–78. doi:10.1021/acs.est.9b02461.
- Metro Vancouver. 2017. Discussion paper: Managing residential wood smoke in Metro Vancouver. Burnaby, Canada: Metro Vancouver.
- Millar, G. 2012. Characterizing residential wood smoke at the neighbourhood scale: An evaluation of five communities in British Columbia. Prince George, Canada: University of Northern British Columbia.
- Mustel Group. 2012. Inventory of wood-burning appliance use in British Columbia - Report of findings. Vancouver, Canada: Mustel Group.
- Naeher, L. P., M. Brauer, M. Lipsett, J. T. Zelikoff, C. D. Simpson, J. Q. Koenig, and K. R. Smith. 2007. Woodsmoke health effects: A review. Inhal. Toxicol. 19 (1):67–106. doi:10.1080/08958370600985875.
- Nhung, N., T. Trang, H. Amini, C. Schindler, M. K. Joss, T. M. Dien, N. Probst-Hensch, L. Perez, and N. Künzli. 2017. Short-term association between ambient air pollution and pneumonia in children: A systematic review and meta-analysis of time-series and case-crossover studies. Environ. Pollut. 230:1000–08. doi:10.1016/j.envpol.2017.07.063.
- Pinheiro, J., Bates, D., DebRoy, S., Sarkar, D., & R Core Team. 2017. _nlme: Linear and Nonlinear Mixed Effects Models_. R package version 3. 1–131. https://CRAN.R-project.org/package=nlme.
- R Core Team. 2017. R: A language and environment for statistical computing. Vienna, Austria: R Foundation for Statistical Computing. https://www.R-project.org/
- Riddervold, I. S., J. H. Bonlokke, L. Molhave, A. Massling, B. Jensen, T. K. Gronborg, R. Bossi, L. Forchhammer, S. K. Kjaergaard, and T. Sigsgaard. 2011. Wood smoke in a controlled exposure experiment with human volunteers. Inhal. Toxicol. 23 (5):277–88. doi:10.3109/08958378.2011.567401.
- Rokoff, L. B., P. Koutrakis, E. Garshick, M. R. Karagas, E. Oken, D. R. Gold, and A. F. Fleisch. 2017. Wood stove pollution in the developed world: A case to raise awareness among pediatricians. Curr. Probl. Pediatr. Adolesc. Health Care 47 (6):123–41. doi:10.1016/j.cppeds.2017.04.001.
- Simoneit, B. R., J. J. Schauer, C. G. Nolte, D. R. Oros, V. O. Elias, M. P. Fraser, W. F. Rogge, and G. R. Cass. 1999. Levoglucosan, a tracer for cellulose in biomass burning and atmospheric particles. Atmos. Environ. 33:173–82. doi:10.1016/S1352-2310(98)00145-9.
- Steadman, R. G. 1984. A universal scale of apparent temperature. J. Clim. Appl. Meteorol. 23 (12):1674–87. doi:10.1175/1520-0450(1984)023<1674:AUSOAT>2.0.CO;2.
- Stieb, D. M., R. Shutt, L. M. Kauri, G. Roth, N. A. Mieczyslaw Szyszkowicz, L. C. Dobbin, M. Rigden, K. Van Ryswyk, and R. Kulka. 2018. Cardiorespiratory effects of air pollution in a panel study of winter outdoor physical activity in older adults. J. Occup. Environ. Med. 60 (8):673–82. doi:10.1097/JOM.0000000000001334.
- Stieb, D. M., R. T. Burnett, M. Smith-Doiron, O. Brion, H. H. Shin, and V. Economou. 2008. A new multipollutant, no-threshold air quality health index based on short-term associations observed in daily time-series analyses. J. Air Waste Manag. Assoc. 58 (3):435–50. doi:10.3155/1047-3289.58.3.435.
- Su, J. G., T. Larson, A.-M. Baribeau, M. Brauer, M. Rensing, and M. Buzzelli. 2007. Spatial modeling for air pollution monitoring network design: Example of residential woodsmoke. J. Air Waste Manage. Assoc. 57 (8):893–900. doi:10.3155/1047-3289.57.8.893.
- Tunno, B., I. Longley, E. Somervell, S. Edwards, G. Olivares, S. Gray, L. Cambal, L. Chubb, C. Roper, G. Coulson, et al. 2019. Separating spatial patterns in pollution attributable to woodsmoke and other sources, during daytime and nighttime hours, in Christchurch, New Zealand. Environ. Res. 171:228–38. doi:10.1016/j.envres.2019.01.033.
- Unosson, J., A. Blomberg, T. Sandstrom, A. Muala, C. Boman, R. Nystrom, R. Westerholm, N. L. Mills, D. E. Newby, J. P. Langrish, et al. 2013. Exposure to wood smoke increases arterial stiffness and decreases heart rate variability in humans. Part Fibre Toxicol. 10:20. doi:10.1186/1743-8977-10-20.
- Wagstaff, M. 2018. Monitoring residential woodsmoke in British Columbia communities. Vancouver, Canada: University of British Columbia.
- Ward, T. J., L. R. Rinehart, and T. Lange. 2006. The 2003/2004 Libby, Montana PM2. 5 source apportionment research study. Aerosol Sci. Technol. 40 (3):166–77. doi:10.1080/02786820500494536.
- Weichenthal, S., R. Kulka, E. Lavigne, D. van Rijswijk, P. J. Michael Brauer, D. S. Villeneuve, L. Joseph, and R. T. Burnett. 2017. Biomass burning as a source of ambient fine particulate air pollution and acute myocardial infarction. Epidemiology (Cambridge, Mass.) 28 (3):329–37. doi:10.1097/EDE.0000000000000636.
- Yao, J., D. M. Stieb, E. Taylor, and S. B. Henderson. 2019. Assessment of the Air Quality Health Index (AQHI) and four alternate AQHI-Plus amendments for wildfire seasons in British Columbia. Can. J. Public Health. doi:10.17269/s41997-019-00237-w.
- Yao, J., M. Brauer, J. Wei, K. M. McGrail, F. H. Johnston, and S. B. Henderson. 2020. Sub-daily exposure to fine particulate matter and ambulance dispatches during wildfire seasons: A case-crossover study in British Columbia, Canada. Environ. Health Perspect. 128 (6):067006. doi:10.1289/EHP5792.
- Yli-Tuomi, T., T. Siponen, R. P. Taimisto, M. Aurela, K. Teinilä, R. Hillamo, J. Pekkanen, R. O. Salonen, and T. Lanki. 2015. Impact of wood combustion for secondary heating and recreational purposes on particulate air pollution in a suburb in Finland. Environ. Sci. Technol. 49 (7):4089–96. doi:10.1021/es5053683.