
ABSTRACT
Vehicle non-exhaust emissions are a major component of particle matter, including the direct wear of tires, brakes, road, and the resuspension of deposited particles. It is suggested that resuspended PM (RPM) emissions can be at the same magnitude or even larger than combustion emissions in urban centers. Factors affecting RPM can be included in four categories: road characteristics, traffic condition, land use, and meteorology. In order to study and evaluate these influencing factors, road dust less than 10 micrometers (RD10) was collected in 41 sites across Bogotá. The sampling points had diverse characteristics. RD10 levels varied between 1.0 and 45.8 mg/m2 with an average of 8.9 ± 8.4 mg/m2. Lower RD10 values were observed when vegetation density was high, pavement condition good, driving speeds fast and construction activities absent. On the contrary, RD10 increased under heavy-duty traffic influence and dry conditions. Among dust mitigation measures, management of land-use variables could be as important as traffic control and road maintenance.
Implications: This study documented for the first time in Latin America dust loadings less than 10 micrometers, information that can be used to estimate resuspended particle matter emissions in the region. The influence of meteorology, traffic characteristics, road condition, and land-use variables was analyzed and quantified. The management of land-use variables could be as important as traffic control and road maintenance for road dust mitigation. Further research interests are discussed.
Introduction
Air pollution has been recognized as the largest environmental challenge in the world, causing one out of each eight deaths worldwide (Mannucci and Franchini Citation2017; WHO Citation2016). In urban environments, several sources emit pollutants to the atmosphere: vehicles, industries, waste treatment facilities, airports, etc. Among those sources, vehicles have shown to contribute the largest, not only with exhaust but also with non-exhaust emissions. The latter ones are referred to the wear of brakes, tires, and road, and the suspension of material already deposited (Amato et al. Citation2011; Denby et al. Citation2013b; Denier van der Gon et al. Citation2013; Norman et al. Citation2016; Padoan and Amato Citation2018; Pant and Harrison Citation2013). It has been found that 93% vol of particles >10 μm near the roads are dominated by traffic-related abrasion processes (Sommer et al. Citation2018). These particles can range from nano to micrometers (Amato et al. Citation2014; Gustafsson et al. Citation2008; Kumar et al. Citation2013; Lee et al. Citation2018).
Non-exhaust particle matter emissions can be comparable or even greater than exhaust emissions in urban centers (Amato et al. Citation2009b; Gustafsson et al. Citation2019). Chemical composition of road particles shows several components, including semimetals and organics associated with health impacts (Alves et al. Citation2018; Gustafsson et al. Citation2008; Lanzerstorfer Citation2018). Additionally, road dust can be transported by surface runoff and impact hydric resources (Zafra, Temprano, and Tejero Citation2008). Despite their significance worldwide, road dust studies have focused on Europe, Asia, and North-America (Padoan and Amato Citation2018). However, resuspended particle matter (RPM) represents a large fraction of emission inventories in Santiago (Chile), Mexico, and Bogotá (Beltran, Belalcázar, and Rojas Citation2012; Ingeniería DICTUC Citation2006; Nedbor-Gross et al. Citation2018; Pachón Citation2018; Pachón et al. Citation2018, Citation2017; Pérez-Peña et al. Citation2017; Ramírez et al. Citation2018; Secretaria del Medio Ambiente de la Ciudad de Mexico Citation2018; Vargas et al. Citation2012).
The reason for this lack of information is that RPM emissions are strongly dependent on road and traffic characteristics as well as land-use features. Extensive field campaigns need to be carried out to characterize dust loadings and understand their temporal and spatial variability. Such campaigns are time and resource-intensive and potentially dangerous. Databases such as CORINAIR or emission models, such as IVE (ISSRC Citation2008) or MOVES (US-EPA Citation2014), report emission factors for brake and tire wear, but not for the resuspension of loose material.
Different methods exist to characterize road dust. Silt loadings (sL), diameter <75 um, are collected by broom sweeping and vacuuming of the roads, following by sieving of samples in the laboratory and moisture content determination (US-EPA Citation2006). Road dust samplers have been designed to alleviate the intense field and laboratory work and avoid potential loss of material when sweeping or vacuuming the roads. They use a constant flow rate under wet (Jonsson, Blomqvist, and Gustafsson Citation2008) or dry road conditions (Amato et al. Citation2009b).
The relationship between resuspended particle matter (RPM) and air quality is complex and affected by several factors (Gustafsson et al. Citation2019). Understanding of temporal and spatial variability of RPM emissions can help to elucidate its relationship with PM10 levels. Some studies attempt to observe and describe the time variability, especially driven by meteorology. In effect, surface moisture has been found the dominant variable explaining the retention of particles on the surface and their subsequent suspension (Denby et al. Citation2013a, Citation2013b; Gustafsson et al. Citation2019; Omstedt, Bringfelt, and Johansson Citation2005; Padoan et al. Citation2018).
The knowledge gap on spatial variability is much wider, as several factors have been identified. Road condition, construction activities, industrial emissions, heavy traffic, among others, are variables associated with high dust levels. In fact, the US-EPA has identified the average weight and vehicle speed as the most important factors for surface silt loadings, and inversely proportional to the precipitation rates (US-EPA Citation2006). The NOn-exhaust Road Traffic Induced Particle emissions model (NORTRIP) considers road dust as a function of surface moisture, tire types, vehicle speeds, and road surface (Denby et al. Citation2013b; Omstedt, Bringfelt, and Johansson Citation2005). Padoan et al. (Citation2018) developed an empirical equation to predict maximum dust loadings as function of pavement macrotexture, traffic intensity, and proximity to braking zones.
The previous models have several limitations. First, silt loadings are strongly dependent on local conditions, the use of the US-EPA database is discouraged unless no local data are available (Amato et al. Citation2014; Teng et al. Citation2008). Second, some models are designed for countries with strong winters where road salting and studded tires are present; other parametrizations respond to subtropical countries with mild winters and hot summers. No models are available currently for tropical countries.
Natural mitigation factors for RPM emissions have been designed to account for the influence of land-use features, in addition to surface humidity and precipitation (Pérez-Peña et al. Citation2017). The transportable fraction (TF) is defined as the fraction of dust not captured by vegetation or buildings (Pace Citation2005). Tall, leafy, and dense vegetation are assigned low TF values (0.05), whereas short, sparse, and scattered vegetation score high TF (0.95) numbers (Pouliot et al. Citation2010). TF are applied to RPM emissions but not directly to RD10 levels.
This work aims to characterize and understand the spatial variability of RD10 in a Latin American urban environment in order to reduce uncertainties in the estimation of RPM emissions. From literature review, factors influencing the spatial variability of road dust were classified into four categories: i. road characteristics (pavement texture and condition, proximity to braking zones, number of lanes, road maintenance, confined streets); ii. traffic characteristics (traffic volume, driving speeds, vehicle type and weight); iii. land use (vegetation cover, unpaved areas, construction); and iv. meteorology (precipitation, surface moisture) (Amato et al. Citation2009a; Denby et al. Citation2013a; Gehrig et al. Citation2010; Kantamaneni et al. Citation1996; Omstedt, Bringfelt, and Johansson Citation2005; Padoan et al. Citation2018; US-EPA Citation2006).
In order to increase the knowledge of such influencing factors, two field campaigns were conducted in Bogotá. This is the first time that dust loadings are determined in Latin America using a dry road dust sampler, offering information that can be used in similar cities in the region. In addition, evaluation of influencing factors from on-site and off-site information was explored, highlighting the impact of land-use variables, such as vegetation and unpaved areas, in RD10 levels. Results from this study are useful to propose strategies to reduce road dust levels under local conditions, and therefore, improve air quality and public health.
Methods
Site description
Bogotá is the capital of Colombia and the largest city with a population of 8.5 million, located in the South America Andes Cordillera at 2,600 m height, in the tropical zone. Meteorological conditions are mild in Bogotá, with an average temperature of 15°C and a bimodal rainy season (two rainy periods around April and October, two dry periods around January and June). The trade winds reach the city between June and August favoring pollutant dispersion.
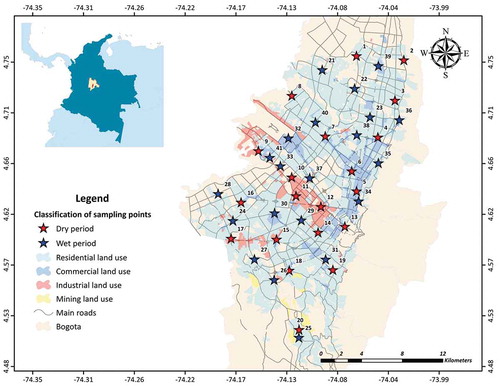
Bogotá´s economic and social dynamics bring together residential, commercial, industrial, and mining activities () generating land-use and environmental conflicts (Blanco et al. Citation2014; Hernández et al. Citation2012; Sarmiento et al. Citation2015). The city has an intensive use of fossil fuels for transportation and goods production. Diesel is consumed preferent in heavy-duty vehicles and gasoline in passenger vehicles and motorcycles. Most of commuting trips are made on public transportation, especially in the Transmilenio system, the largest Bus Rapid Transit in Latin America. However, 70% of vehicles in the city are passenger cars and 20% motorcycles, creating traffic congestion.
Figure 1. Bogotá´s land-use information and sampling points for RD10 in the wet period (points 21 to 41) and the dry period (points 1 to 20)
The city operates an air quality monitoring network (RMCAB for its Spanish acronym) since 1997 where criteria pollutants are permanently recorded and displayed to the public. More details on pollutant monitoring and historic trends are found elsewhere (Pachón Citation2018). Frequently, PM exceeds national air quality standards in the south and western areas of the city, given the emission sources, local and meteorological conditions.
Road dust RD10 measurements
A road dust sampler designed at the Spanish Research Council was used to collect particles with a diameter less than 10 μm (RD10). A description of the instrument is available elsewhere (Amato et al. Citation2013, Citation2011, Citation2009b; Padoan et al. Citation2018). Briefly, the instrument consists on a settling chamber followed by a stainless-steel elutriation filter designed to allow passage to only PM10 grade material. The instrument uses a vacuum flow of 25 l/min and collects particles directly from the ground. Although fragmentation and breakdown of particles larger than 10 microns can eventually produce PM10, the purpose of this study is the instantaneous emission potential (the moment of sampling), which depends mostly on the available PM10 on road. The larger particles (>10 microns) are separated in two sedimentation stages (deposition chamber and elutriation filter) and are not analyzed.
The dust sample was collected on a filter for gravimetric determination. Quartz fiber filters were conditioned at constant temperature and relative humidity (20 ± 2°C and RH 50 ± 5%) before and after the campaign. The sampling was conducted on three adjacent squares (1 m2 each) at the closest traffic lane to the sidewalk, but not less than 1 m from the curbside. Sometimes this distance was shortened to 0.7 m due to pavement condition, traffic intensity, oil leakage, or for safety conditions. In all cases, it was verified that the sampling area corresponded to an active lane and not a parking spot.
A total of 41 points were sampled across the city (). At each site, an average of 4 h was spent between logistic preparation, road sampling (30 minutes per square), finalization, and transportation to the next point; therefore, approximately 160 hours were necessary to cover both campaigns. A chaperone vehicle was located behind the sampling point and whenever possible police was accompanying the scene. Each sampling site required the presence of at least three people, two in charge of the instrument setup and operation, and a third person to route traffic and observe for security conditions.
Road dust loadings RD10 (mg/m2) were determined as the difference in the mass collected in the filters (in mg) before and after sampling and divided by the sampled area (1 m2). The sampling area and time were reduced to half on 40% of the samples due to filter saturation.
Spatial variability of RD10
The spatial variability was evaluated with dust loadings obtained at the 41 sampling sites. Half of the points were collected during March and April 2017 (hereafter the wet period) at the beginning of the rainy season; the other half from December 2017 to March 2018 (hereafter the dry period) (). In this way, the two most typical meteorological conditions in the city were evaluated. However, the analysis of influencing factors was conducted independently at each period, in order to avoid confounding factors.
Evaluation of factors influencing dust loadings
Two methods were proposed to evaluate the impact of different factors on dust loadings: i) from field observations collected on site and ii) from the analysis of local information gathered off site ().
Table 1. On-site and off-site information on factors influencing road dust loadings
On-site observations were assessed by visual inspection during the sampling campaigns. In order to avoid subjectivity by the field assistants a list of criteria was prepared for each factor (). Off-site data were collected and assessed from local agencies or the web, accessing the information at the site or the closest location. For instance, meteorological variables were available at the 14 sites of the Bogotá´s Air Quality Monitoring Network; therefore, the nearest site to the sampling point was selected.
Table 2. Ranking of on-site observations influencing dust loadings
Off-site criteria were prepared for each factor (). Meteorological data comprised the rain intensity and the number of days after the last precipitation event of at least 0.25 mm. This metric is the minimum measurable rain intensity under which no effect on dust loadings is expected (US-EPA Citation2006).
Table 3. Off-site factors influencing dust loadings
Areas covered by vegetation and length of unpaved roads were identified from geographic information data and quantified around the sampling site in a series of radius: 100 m, 250 m, 500 m, and 1 km. It is worth to note that vegetation referred mainly to grass in the land-use data.
Traffic volumes were available for the following vehicle types: PV – passenger vehicle, MT – motorcycle, BU – bus, TR – light and heavy-duty truck. In order to consider the vehicular weight, two groups were defined for this analysis: light-duty vehicles (LDV) and heavy-duty vehicles (HDV). LDV comprised a weighted average of PV (~1.6 ton) and MT (~0.2 ton), whereas HDV included BU (~14.5 ton) and TR (~10 ton). The weighting parameter was the traffic volume (on average 60% PV, 23% MT, 11% BU, and 6% TR). Driving speeds were available for the mix of traffic.
In the first period, driving speeds were not measured during the field campaign, they were obtained from local records. The data were only available in discrete speeds. In contrast, velocity measurements were conducted in the dry season. The distance to the closest braking zone (intersections, traffic lights, round bounds, stop signs, lane ends, merges) was quantified from Google maps.
Results
Road dust RD10 estimation
The average RD10 was almost double in the dry season vs the wet period (). This difference is mainly explained by meteorology, specifically, the changes in precipitation and surface moisture. In effect, during the dry period, half of the points were sampled after at least 10 days of the last precipitation event (i.e. 10 dry days). In contrast, in the wet period, half of the points were sampled between one and three dry days.
Table 4. Dust loadings during the sampling campaigns conducted in Bogotá
The larger dust loadings in the dry period confirm the effect of meteorology. During rainy seasons, dust loadings decrease after each precipitation due to the reduction of the mobility of deposited particles onto street surfaces (Querol et al. Citation2018). Additionally, the rain brings higher air humidity and road moisture that prevents further dust suspension. The moistening effect is suggested to be more significant than the wash-off particle removal (Denby et al. Citation2013b; Padoan et al. Citation2018). During dry seasons, dust particles build up and reach a maximum value. However, the growth is limited by a steady-state condition once suspension and deposition processes are balanced (Amato et al. Citation2012).
The observed RD10 in Bogotá are similar to European dust loadings characterized with the same methodology. In a roadside in Birmingham (UK) mass loadings (n = 10 samples) ranged 3.78 and 21.8 mg/m2 during June–July (Pant et al. Citation2015); in Barcelona, RD10 values varied between 1.1 and 23 mg/m2 at different sampling sites (n ~ 30) during summer time (Amato et al. Citation2009b, Citation2012; Padoan et al. Citation2018). In Turin (Italy), RD10 values were observed between 1.0 and 42.7 mg/m2 (n = 20 samples) in summer time and mass loadings between 0.8 and 11.5 mg/m2 (n = 10 samples) in winter time (Padoan et al. Citation2018). Dust loadings found in Paris (0.7 to 2.2 mg/m2, n = 6 samples) and Zurich (0.2 to 1.3 mg/m3) (Amato et al. Citation2016) are significantly lower than Bogotá, whereas values for New Delhi (44 to 106 mg/m2, n = 10 samples) (Pant et al. Citation2015) are much higher. The variability of RD10 within cities demonstrates the high dependence on the city´s attributes, for which local study of influencing factors is of upmost relevance.
Atypical values of dust loadings are also of interest to understand the city’s environmental and social dynamics. In the dry period, three points were identified as atypical (sites 8,9,19). Site 8 with RD10 of 45.7 mg/m2 was identified as an outlier, the next large value was 23.1 mg/m2, half of it. Site 9 was impacted by a motorcycle strike that caused decrease in traffic congestion and a consequent increase in driving speeds, which could explain the low RD10 value (1.8 mg/m2). Site 19 could have been influenced by a wildfire event that took place in the eastern mountains of the city, close to the sampling point, resulting in a dust loading of 16.7 mg/m2. In the wet season, two points were recognized as anomalous and removed, points 28 (7.2 mg/m2) and 32 (22.0 mg/m2). They displayed large percentages of vegetation cover (>50%) in a 1-km radius and still dust loadings were relatively high. It is possible that geographic information for those sites was outdated.
Spatial variability of RD10
The variability of RD10 among sampling points was significant, but some general patterns were identified. Large dust loadings were observed toward the southwestern areas of the city, with RD10 values >6.0 mg/m2 in the wet period and >12.0 mg/m2 in the dry period (). Such values in the western part quickly dropped toward the east and northern areas. However, large dust loadings were also observed in the north and eastern parts of the city, especially when the sampling was conducted close to construction sites, on dedicated bus lanes, or in confined streets. This result suggests the importance of local conditions or circumstances on RD10 levels.
Figure 2. Road dust loadings estimated for Bogotá in the wet period (a) and the dry period (b)
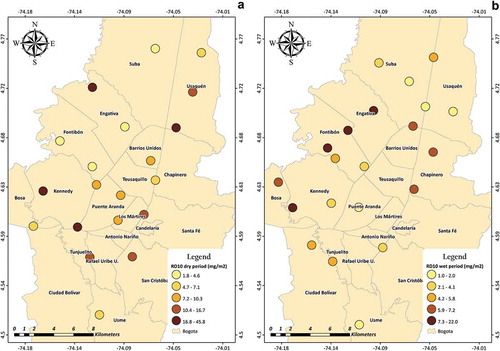
On the other hand, it was also possible to observe low dust loadings in the western areas, especially those surrounded by significant vegetation cover. The influence of road characteristics, traffic condition, and land use on dust loadings will be described in more detail sections 3.3 and 3.4.
In the wet period, the city showed intermediate loadings (4.0–7.0 mg/m2) and the lowest values (1.0–4.0 mg/m2) were observed at the northeastern and southern parts of the city (). In the dry period, RD10 values also dropped from west to east, but levels are considerably higher than during the wet period ().
The western areas in Bogotá are also high in ambient PM10 concentrations (http://iboca.ambientebogota.gov.co/mapa/) with values ranging 55–75 μg/m3, above the city average (45 μg/m3 for 2017) (SDA Citation2017), which suggests an influence of RD10 in PM10. In effect, it is known that dust suspension can increase PM10 levels, but the opposite is also true, i.e. PM10 can deposit on the ground if adequate conditions exist and increment dust loadings (US-EPA Citation2006). A comprehensive study on the relationship between RD10 and PM10 is out of the scope of this work. However, studies of the PM10 chemical composition in Bogotá have found the mineral component in a range between 23% and 35% of the mass (Pachón et al. Citation2017; Ramírez et al. Citation2018).
Evaluation of factors influencing dust loadings from on-site information
The influence of road characteristics, traffic condition, and land-use variables was evaluated at the 41 sampling sites (Table S1 in the supplementary material). On-site observations, as described in , showed that the lowest RD10 values occurred in residential areas absent of constructions and roads of great extension (4+lanes) with good pavement condition ().
Figure 3. Analysis of factors influencing road dust from on-site observations, wet period (gray bars) and dry period (black bars), error bars represent minimum and maximum values
In respect to the type of road, dust loadings were larger in commercial and industrial zones and lower in residential areas, with a difference of approximately 6.0 mg/m2 (). Similar results were obtained for Bogotá in previous studies, due to heavy vehicular traffic, industrial emissions, and deteriorated pavement condition (Ramírez et al. Citation2019). Roads in the east and center zones of the city are usually narrow, which could explain high dust levels. Factors like house height, length of blocks, and ventilation are expected to influence. Further research is needed on these topics.
The number of lanes has been suggested as a proxy for traffic volumes assuming that the greater the road the more vehicles can transit. shows a decrease in RD10 with the number of lanes, which could be explained by the traffic-induced turbulence, in addition to large driving speeds and less use of brakes in motorways. The difference in RD10 between a great avenue (4+ lanes) and a road with three or fewer lanes was approximately 6.0 mg/m2.
The construction of roads and buildings and the presence of unpaved areas were documented during the field campaigns. These activities had a clear effect on the availability of fugitive dust, especially during the dry period (). A difference of approximately 4.0 mg/m2 in RD10 was estimated between sites with and without near-by constructions and/or unpaved areas (roads, sidewalks, parking lots). This situation can be explained by transport of particles downwind, in addition to the delivery and transportation of construction materials.
Finally, road condition was evaluated as good, regular, or bad depending on the visible damage of the pavement or the presence of crackings and indentations around the sampling site (). shows large dust levels when the pavement was in bad condition. The average difference in RD10 values with a good condition road was approximately 9.0 mg/m2. This is caused by the dust deposited in cracks and indentations of the road that is potentially available for resuspension. During the field campaign, it was possible to observe different types of pavement across the city. The analysis of pavement surface properties, such as macro texture, is out of the scope of this work, but several studies indicate that a higher road surface texture tends to accumulate larger dust loadings (Gustafsson et al. Citation2019; Padoan et al. Citation2018).
Based on the average difference between RD10 values within factors, the largest effect was observed with the pavement condition (bad vs regular). A similar influence was identified between the type of road and the number of lanes (as a proxy of traffic counts). Finally, the presence of construction activities and unpaved areas displayed the lowest rank. It might be possible that 400 m, the maximum distance evaluated, is not enough to include the transport of fugitive dust from longer distances. Some pictures of the sampling points including the previous factors are available in Figure S2 in the supplementary material.
Results in this study are supported by international studies that show dust loadings decreasing with homogeneous pavement condition, fast driving speeds, great avenues, and absence of construction work (Amato et al. Citation2009b; Bukowiecki et al. Citation2010; China and James Citation2012).
Evaluation of factors influencing dust loadings from off-site information
Areas covered by vegetation and length of unpaved roads were identified and quantified around the sampling site in a series of radius: 100 m, 250 m, 500 m, and 1 km. The 1-km buffer offered the largest correlation with dust loading, and therefore it was selected for subsequent analysis. Traffic volume and velocities were obtained from traffic monitoring sites. The distance to the closest braking zone was quantified from google maps. Data for each factor at all sites are available in Table S1 (supplementary material).
The impact of vegetation was notable in both campaigns (). A decrease in RD10 was identified as the area covered by vegetation increased (R2 = 0.4). This analysis includes near-road and surrounding (1-km buffer) vegetation. The grass cover in sidewalks, curbs, and parks can prevent the carryout of mud and dirt to the roads. Large vegetation, such as bushes and trees can act as a barrier for dust mobilization.
Figure 4. Analysis of factors influencing road dust, wet period (gray points) and dry period (black points)
This work did not distinguish the type of vegetation and its influence on RD10. Previous studies suggest that tall, leafy, and dense vegetation are more efficient capturing fugitive dust than short, sparse, and scattered vegetation (Pouliot et al. Citation2010). Similarly, it has been suggested that wide vegetation on grass and hairy leaves can explain greater particle deposition rates (Abhijith et al. Citation2017; Gómez-Moreno et al. Citation2019; Janhäll Citation2015). Large dust loadings in Southern Europe have been associated with small vegetation cover (Querol et al. Citation2018).
The increase in the length of unpaved roads resulted in large RD10 levels, situation that is more notable in the dry period (R2 = 0.4) (). It is recognized that unpaved roads are a major source of fugitive dust, especially in dry climates where particles are mobilized by wind currents and vehicle-induced turbulence.
Driving speeds and distance to the closest braking zone (BRAKE) display a similar relationship with dust loadings ( & d). Low velocity and low BRAKE are associated with high dust levels. In the first case, the resuspension of the material deposited on the road largely depends on traffic-induced turbulence (Amato et al. Citation2013; Padoan et al. Citation2018). In the second case, the friction generated in brake pads and disks yields the formation of coarse and fine particles (Sommer et al. Citation2018; Thorpe and Harrison Citation2008) accompanied by the wear of tires and pavement.
The increase in traffic volumes is generally associated with lower dust levels due to the turbulence effects caused by the passing vehicles. This is mainly true in motorways with large driving speeds. In this study, a positive trend between traffic counts and RD10 was identified in the wet season and the opposite behavior in the dry period (). This variability could be caused by the constant traffic jams in the city, even in motorways. In fact, Bogota´s traffic is ranked as the worst in the world according to the Inrix index (Inrix Citation2019). The braking frequency and low velocity prevent a successful mobilization of abraded particles.
Finally, the analysis of RD10 as a function of heavy-duty traffic shows that the increase in the vehicle weight represented an increase in dust levels in the dry season (). In the wet period, this relationship was not conclusive. Several studies confirm larger dust emission factors (5 to 10 times) for HDV than light-duty vehicles caused by a much larger turbulence, abrasion, and resuspension (Bukowiecki et al. Citation2010; Denby, Kupiainen, and Gustafsson Citation2018; Sommer et al. Citation2018). Additionally, it is possible for the crushing of coarse particles by heavy traffic (Zafra, Temprano, and Tejero Citation2008).
Measures to reduce dust loadings
A key step to reduce dust loadings and improve air quality is to consider the effect of several factors influencing RD10 levels. Traditionally, emission models are function of silt/dust loadings, surface humidity, traffic characteristics, and road condition. This study highlights the impact of urban vegetation and unpaved areas in the levels of resuspended dust.
Most of dust mitigation measures have focused on surface moisture. Water flushing and/or dust binders have been shown to successfully reduce dust levels in paved and unpaved roads (Amato et al. Citation2010; Querol et al. Citation2018). On the contrary, dry cleaning methods may actually increase dust loadings and its effectiveness is not conclusive (Querol et al. Citation2018; Zafra, Temprano, and Tejero Citation2008). In many Latin American cities, curbs and gutters are still cleaned by hand sweeping and roads by traditional cleaning machines. Mitigation of RPM emissions could be achieved by switching to wet cleaning techniques, but this requires conducting field studies to determine rates and times.
This study found that lower speeds tend to resuspend less particles from the ground. Management of driving speeds has also been considered to reduce dust loadings (Gustafsson et al. Citation2009); however, its practicability is not simple, since it depends on the change of urban regulations, driver´s behaviors, law enforcement, etc. Similarly, the closeness to braking zones is associated with higher dust levels. The decrease in the braking frequency would imply the management of driving speeds, the redesign of intersections, synchronization of traffic lights, design of better brakes, etc., strategies that are not simple to implement.
Traffic volumes are associated with both decrease and increase of dust loadings, depending on traffic congestion. However, heavy-duty traffic is related with large RD10 levels in the dry season. Restriction of HDV in towns promotes the reduction of exhaust and non-exhaust emissions, but the feasibility of this measure could be low. In the absence of a multimodal transportation system, frequent in Latin American cities, HDV are largely used for transportation of food, goods, raw materials, etc.
Vegetation showed dust mitigation in both dry and wet periods. The effect of near-road vegetation and 1 km vegetation cannot be identified separately, but it´s expected that grass in sidewalks, road shoulders, and median strips prevent the carryout of mud and dirt to the roads. On the other hand, big trees can act as vegetation barriers. These large species need to be carefully planned, since their benefit to reduce dust loadings could be overridden by the air quality impact under different street conditions.
The presence of unpaved areas (roads, sidewalks, median strips, parking lots) is still a problem in Latin America, especially, in low- and middle-income zones. Pavement of unpaved roads has shown a 95% of reduction in RPM emissions (Méndez Espinosa et al. Citation2017). In addition, marginalized population experiment an increase in the quality of life when their roads are paved.
Conclusion
In many Latin American cities, air quality improvement largely depends on the abatement of RPM emissions. However, those emissions are rarely included in emission inventories, due to the lack of local dust loadings and a poor understanding of their spatial and temporal variability. This study contributes with RD10 values for Bogotá under different site characteristics. Such values can be applied in cities with similar characteristics. In this way, RPM emissions can be constructed and included in air quality management plans in the region.
Factors influencing RD10 levels were included in four groups: meteorology, traffic characteristics, road condition, and land-use variables. Qualitative and quantitative analysis highlighted the impact of vegetation and pavement in the reduction of dust loadings in urban environments. Their influence is comparable with that from traffic volumes, road condition, braking distance, and driving speeds.
Further research should focus on the impact of different types of urban vegetation on RD10, especially the predominant species in the city. Similarly, factors like house height, length of blocks, and ventilation should be investigated. Models for RPM emission estimation should include vegetation cover and unpaved areas in addition to surface humidity, traffic, and road condition. Accordingly, measures to mitigate road dust can consider increasing vegetation covers as complement of traditional dust reduction strategies.
Supplemental Material
Download MS Word (701 KB)Acknowledgment
The authors are grateful for the financial support provided under agreements 20161239 with Secretaria de Ambiente and 5224377 with Ecopetrol. The authors' viewpoint do not necessarily reflect the official opinion of their institutions. We thank our students who developed their undergraduate work with activities from this project. We also thank the Colombian police who accompanied some of the field campaigns. The authors thank the China Section of the Air & Waste Management Association for the generous scholarship they received to cover the cost of page charges, and make the publication of this paper possible.
Supplementary material
Supplemental data for this article can be accessed on the publisher’s website.
Additional information
Funding
Notes on contributors
Jorge E. Pachon
Jorge E. Pachon is titular professor at the Department of Environmental Engineering, Universidad de La Salle in Bogota, Colombia.
Sebastián Vanegas
Sebastián Vanegas a is a junior environmental researcher at the CLIMA research group, Universidad de La Salle in Bogota, Colombia.
Constanza Saavedra
Constanza Saavedra is an assistant professor at the Department of Environmental Engineering, Universidad de La Salle in Bogota, Colombia.
Fulvio Amato
Fulvio Amato is a Tenured Researcher in the Institute of Environmental Assessment and Water Research at the Consejo Superior de Investigaciones Científicas de España.
Luis F. O. Silva
Luis F. O. Silva is the Research Division Director at Universidad de la Costa in Barranquilla, Colombia.
Karen Blanco
Karen Blanco is a senior professional of the Air Quality Management group at Secretaria Distrital de Ambiente in Bogota, Colombia.
Rafael Chaparro
Rafael Chaparro is leader of the Air Quality Management group at Secretaria Distrital de Ambiente in Bogota, Colombia.
Oscar M. Casas
Oscar M. Casas is a senior researcher at the Colombian Petroleoum Institute in Piedecuesta, Santander, Colombia.
References
- Abhijith, K. V., P. Kumar, J. Gallagher, A. McNabola, R. Baldauf, F. Pilla, B. Broderick, S. Di Sabatino, and B. Pulvirenti. 2017. Air pollution abatement performances of green infrastructure in open road and built-up street canyon environments – A review. Atmos. Environ. 162:71–86. doi:10.1016/j.atmosenv.2017.05.014.
- Alves, C. A., M. Evtyugina, A. M. P. Vicente, E. D. Vicente, T. V. Nunes, P. M. A. Silva, M. A. C. Duarte, C. A. Pio, F. Amato, and X. Querol. 2018. Chemical profiling of PM10from urban road dust. Sci. Total Environ. 634:41–51. doi:10.1016/j.scitotenv.2018.03.338.
- Amato, F., F. R. Cassee, H. A. C. Denier van der Gon, R. Gehrig, M. Gustafsson, W. Hafner, R. M. Harrison, M. Jozwicka, F. J. Kelly, T. Moreno, et al. 2014. Urban air quality: The challenge of traffic non-exhaust emissions. J. Hazard. Mater. 275:31–36. doi:10.1016/j.jhazmat.2014.04.053.
- Amato, F., O. Favez, M. Pandolfi, A. Alastuey, X. Querol, S. Moukhtar, B. Bruge, S. Verlhac, J. A. G. Orza, N. Bonnaire, et al. 2016. Traffic induced particle resuspension in Paris: Emission factors and source contributions. Atmos. Environ. 129:114–24. doi:10.1016/j.atmosenv.2016.01.022.
- Amato, F., S. Nava, F. Lucarelli, X. Querol, A. Alastuey, J. M. Baldasano, and M. Pandolfi. 2010. A comprehensive assessment of PM emissions from paved roads: Real-world emission factors and intense street cleaning trials. Sci. Total Environ. 408 (20):4309–18. doi:10.1016/j.scitotenv.2010.06.008.
- Amato, F., M. Pandolfi, A. Alastuey, A. Lozano, J. Contreras González, and X. Querol. 2013. Impact of traffic intensity and pavement aggregate size on road dust particles loading. Atmos. Environ. 77:711–17. doi:10.1016/j.atmosenv.2013.05.020.
- Amato, F., M. Pandolfi, A. Escrig, X. Querol, A. Alastuey, J. Pey, N. Perez, and P. K. Hopke. 2009a. Quantifying road dust resuspension in urban environment by multilinear engine: A comparison with PMF2. Atmos. Environ. 43:2770–80. doi:10.1016/j.atmosenv.2009.02.039.
- Amato, F., M. Pandolfi, T. Moreno, M. Furger, J. Pey, A. Alastuey, N. Bukowiecki, A. S. H. Prevot, U. Baltensperger, and X. Querol. 2011. Sources and variability of inhalable road dust particles in three European cities. Atmos. Environ. 45:6777–87. doi:10.1016/j.atmosenv.2011.06.003.
- Amato, F., M. Pandolfi, M. Viana, X. Querol, A. Alastuey, and T. Moreno. 2009b. Spatial and chemical patterns of PM10 in road dust deposited in urban environment. Atmos. Environ. 43:1650–59. doi:10.1016/j.atmosenv.2008.12.009.
- Amato, F., M. Schaap, H. A. C. Denier, V. D. Gon, M. Pandol, A. Alastuey, M. Keuken, and X. Querol. 2012. Effect of rain events on the mobility of road dust load in two Dutch and Spanish roads. Atmos. Environ. 62:352–58. doi:10.1016/j.atmosenv.2012.08.042.
- Beltran, D., L. C. Belalcázar, and N. Rojas. 2012. Emisiones vehiculares de material particulado (PM2.5 y PM10) por resuspensión de polvo y abrasion de Bogotá. Rev. Ing. Sanit. Y Ambient 231:25–33.
- Blanco, L. C., V. Miranda, L. Hernández, A. Barraza, W. Junger, M. Hurtado, and I. Romieu. 2014. Effect of particulate matter less than 10µm (PM10) on mortality in Bogota, Colombia: A time-series analysis, 1998-2006. Salud Publica Mex. 56:363–70.
- Bukowiecki, N., P. Lienemann, M. Hill, M. Furger, A. Richard, F. Amato, A. S. H. Prévôt, U. Baltensperger, B. Buchmann, and R. Gehrig. 2010. PM10 emission factors for non-exhaust particles generated by road traffic in an urban street canyon and along a freeway in Switzerland. Atmos. Environ. 44:2330–40. doi:10.1016/j.atmosenv.2010.03.039.
- China, S., and D. E. James. 2012. Influence of pavement macrotexture on PM10emissions from paved roads: A controlled study. Atmos. Environ. 63:313–26. doi:10.1016/j.atmosenv.2012.09.018.
- Denby, B. R., K. J. Kupiainen, and M. Gustafsson. 2018. Chapter 9 – Review of road dust emissions. In Non-exhaust emissions, ed. F. B. T.-N.-E.-E. Amato, 183–203. UK: Academic Press. doi:10.1016/B978-0-12-811770-5.00009-1.
- Denby, B. R., I. Sundvor, C. Johansson, L. Pirjola, M. Ketzel, M. Norman, K. Kupiainen, M. Gustafsson, G. Blomqvist, M. Kauhaniemi, et al. 2013a. A coupled road dust and surface moisture model to predict non-exhaust road traffic induced particle emissions (NORTRIP). Part 2: Surface moisture and salt impact modelling. Atmos. Environ. 81:485–503. doi:10.1016/J.ATMOSENV.2013.09.003.
- Denby, B. R., I. Sundvor, C. Johansson, L. Pirjola, M. Ketzel, M. Norman, K. Kupiainen, M. Gustafsson, G. Blomqvist, and G. Omstedt. 2013b. A coupled road dust and surface moisture model to predict non-exhaust road traffic induced particle emissions (NORTRIP). Part 1: Road dust loading and suspension modelling. Atmos. Environ. 77:283–300. doi:10.1016/j.atmosenv.2013.04.069.
- Denier van der Gon, H. A. C., M. E. Gerlofs-Nijland, R. Gehrig, M. Gustafsson, N. Janssen, R. M. Harrison, J. Hulskotte, C. Johansson, M. Jozwicka, M. Keuken, et al., 2013. The policy relevance of wear emissions from road transport, now and in the future – An international workshop report and consensus statement. J. Air Waste Manage. Assoc. 63, 136–49. 10.1080/10962247.2012.741055
- Gehrig, R., K. Zeyer, N. Bukowiecki, P. Lienemann, L. D. Poulikakos, M. Furger, and B. Buchmann. 2010. Mobile load simulators – A tool to distinguish between the emissions due to abrasion and resuspension of PM10 from road surfaces. Atmos. Environ. 44:4937–43. doi:10.1016/j.atmosenv.2010.08.020.
- Gómez-Moreno, F. J., B. Artíñano, E. D. Ramiro, M. Barreiro, L. Núñez, E. Coz, C. Dimitroulopoulou, S. Vardoulakis, C. Yagüe, G. Maqueda, et al. 2019. Urban vegetation and particle air pollution: Experimental campaigns in a traffic hotspot. Environ. Pollut. 247:195–205. doi:10.1016/j.envpol.2019.01.016.
- Gustafsson, M., G. Blomqvist, A. Gudmundsson, A. Dahl, P. Jonsson, and E. Swietlicki. 2009. Factors influencing PM10 emissions from road pavement wear. Atmos. Environ. 43:4699–702. doi:10.1016/j.atmosenv.2008.04.028.
- Gustafsson, M., G. Blomqvist, A. Gudmundsson, A. Dahl, E. Swietlicki, M. Bohgard, J. Lindbom, and A. Ljungman. 2008. Properties and toxicological effects of particles from the interaction between tyres, road pavement and winter traction material. Sci. Total Environ. 393:226–40. doi:10.1016/j.scitotenv.2007.12.030.
- Gustafsson, M., G. Blomqvist, I. Järlskog, J. Lundberg, S. Janhäll, M. Elmgren, C. Johansson, M. Norman, and S. Silvergren. 2019. Road dust load dynamics and influencing factors for six winter seasons in Stockholm, Sweden. Atmos. Environ. X 2:100014. doi:10.1016/j.aeaoa.2019.100014.
- Hernández, L. J., G. Aristizábal, Y. Salgado, L. Cantor, K. Medina, and J. Reyes. 2012. Asociación entre la contaminación del aire y la morbilidad por enfermedad respiratoria aguda en menores de cinco años en tres localidades de Bogotá. Pediatria (Santiago) 45:124–38. doi:10.1016/S0120-4912(15)30011-2.
- Ingeniería DICTUC. 2006. Actualización del inventario de emisiones de contaminantes atmosféricos en la región metropolitana de Santiago de Chile 2005. Santiago: Universidad de Santiago de Chile.
- Inrix. 2019. INRIX global traffic scorecard [WWW Document]. Accessed July 11, 2020. https://inrix.com/scorecard/.
- ISSRC. 2008. IVE user manual. La Habra, CA: International Sustainable Systems Research Center.
- Janhäll, S. 2015. Review on urban vegetation and particle air pollution – Deposition and dispersion. Atmos. Environ. 105:130–37. doi:10.1016/j.atmosenv.2015.01.052.
- Jonsson, P., G. Blomqvist, and M. Gustafsson. 2008. Wet dust sampler technological innovation for sampling particles and salt on road surface. In TRB transportation research circular E-C126: Surface transportation weather and snow removal and ice control technology, ed. Swedish National Road and Transport Research Institute, 102–11. Indianapolis, Indiana: E-circular.
- Kantamaneni, R., G. Adams, L. Bamesberger, E. Allwine, H. Westberg, B. Lamb, and C. Claiborn. 1996. The measurement of roadway PM10 emission rates using atmospheric tracer ratio techniques. Atmos. Environ. 30:4209–23. doi:10.1016/1352-2310(96)00131-8.
- Kumar, P., L. Pirjola, M. Ketzel, and R. M. Harrison. 2013. Nanoparticle emissions from 11 non-vehicle exhaust sources – A review. Atmos. Environ. 67:252–77. doi:10.1016/j.atmosenv.2012.11.011.
- Lanzerstorfer, C. 2018. Heavy metals in the finest size fractions of road-deposited sediments. Environ. Pollut. 239:522–31. doi:10.1016/j.envpol.2018.04.063.
- Lee, K. Y., T. Batmunkh, H. S. Joo, and K. Park. 2018. Comparison of the physical and chemical characteristics of fine road dust at different urban sites. J. Air Waste Manage. Assoc. 68:812–23. doi:10.1080/10962247.2018.1443855.
- Mannucci, M. P., and M. Franchini. 2017. Health effects of ambient air pollution in developing countries. Int. J. Environ. Res. Public Heal. doi:10.3390/ijerph14091048.
- Méndez Espinosa, J. F., L. C. Pinto Herrera, B. R. Galvis Remolina, and J. E. Pachón Quinche. 2017. Estimación de factores de emisión de material particulado resuspendido antes, durante y después de la pavimentación de una vía en Bogotá. Cienc. e Ing. Neogranadina 27:43–60. doi:10.18359/rcin.1797.
- Nedbor-Gross, R., B. Henderson, M. Perez-Peña, and J. E. Pachon. 2018. Air quality modeling in Bogotá, Colombia using local emissions and natural mitigation factor adjustment for re-suspended particulate matter. Atmos. Pollut. Res. 9:95–104. doi:10.1016/j.apr.2017.07.004.
- Norman, M., I. Sundvor, B. R. Denby, C. Johansson, M. Gustafsson, G. Blomqvist, and S. Janhäll. 2016. Modelling road dust emission abatement measures using the NORTRIP model: Vehicle speed and studded tyre reduction. Atmos. Environ. 134:96–108. doi:10.1016/j.atmosenv.2016.03.035.
- Omstedt, G., B. Bringfelt, and C. Johansson. 2005. A model for vehicle-induced non-tailpipe emissions of particles along Swedish roads. Atmos. Environ. 39:6088–97. doi:10.1016/j.atmosenv.2005.06.037.
- Pace, T. G. 2005. Methodology to estimate the Transportable Fraction (TF) of fugitive dust emissions for regional and urban scale air quality analyses. Research Triangle Park, NC: US-Environmental Protection Agency.
- Pachón, J. E. 2018. Case 7. The experience of Bogotá. In Air quality in cities, a global challenge, ed. X. Querol, 279. Madrid: Naturgy foundation.
- Pachón, J. E., B. Galvis, O. Lombana, L. Carmona, S. Fajardo, A. Rincón, S. Meneses, R. Chaparro, R. Nedbor-Gross, and B. Henderson. 2018. Development and evaluation of a comprehensive atmospheric emission inventory for air quality modeling in the megacity of Bogotá. Atmosphere (Basel) 9 (2):49. doi:10.3390/atmos9020049.
- Pachón, J. E., C. Saavedra, F. Amato, A. Rincon, and D. Sanchez. 2017. Identificación del aporte de fuentes al PM10 en la ciudad de Bogotá. Memorias Del IV Congreso Colombiano y Conferencia Internacional de Calidad Del Aire y Salud Pública CASAP. Cali: Universidad del Valle.
- Padoan, E., F. Ajmone-Marsan, X. Querol, and F. Amato. 2018. An empirical model to predict road dust emissions based on pavement and traffic characteristics. Environ. Pollut. 237:713–20. doi:10.1016/j.envpol.2017.10.115.
- Padoan, E., and F. Amato. 2018. Chapter 2 - Vehicle non-exhaust emissions: Impact on air quality. In Non-exhaust emissions, ed. F. B. T.-N.-E.-E. Amato, 21–65. UK: Academic Press. doi:10.1016/B978-0-12-811770-5.00002-9.
- Pant, P., S. J. Baker, A. Shukla, C. Maikawa, K. J. Godri Pollitt, and R. M. Harrison. 2015. The PM10 fraction of road dust in the UK and India: Characterization, source profiles and oxidative potential. Sci. Total Environ. 530–531:445–52. doi:10.1016/j.scitotenv.2015.05.084.
- Pant, P., and R. M. Harrison. 2013. Estimation of the contribution of road traffic emissions to particulate matter concentrations from field measurements: A review. Atmos. Environ. 77:78–97. doi:10.1016/j.atmosenv.2013.04.028.
- Pérez-Peña, M. P., B. H. Henderson, R. Nedbor-Gross, and J. E. Pachón. 2017. Natural mitigation factor adjustment for re-suspended particulate matter emissions inventory for Bogota, Colombia. Atmos. Pollut. Res. 8:29–37. doi:10.1016/j.apr.2016.07.006.
- Pouliot, G., H. Simon, P. V. Bhave, D. Tong, D. Mobley, T. G. Pace, and T. Pierce. 2010. Assessing the anthropogenic fugitive dust emission inventory and temporal allocation using an updated speciation of particulate matter. 19th International Emission Inventory Conference. San Antonio, TX.
- Querol, X., F. Amato, F. Robusté, C. Holman, and R. M. Harrison. 2018. Chapter 11 - Non-technological measures on road traffic to abate urban air pollution. In Non-exhaust emissions, ed. F. B. T.-N.-E.-E. Amato, 229–60. UK: Academic Press. doi:10.1016/B978-0-12-811770-5.00011-X.
- Ramírez, O., A. M. Sánchez de la Campa, F. Amato, R. A. Catacolí, N. Y. Rojas, and J. de la Rosa. 2018. Chemical composition and source apportionment of PM10 at an urban background site in a high–altitude Latin American megacity (Bogota, Colombia). Environ. Pollut. 233:142–55. doi:10.1016/j.envpol.2017.10.045.
- Ramírez, O., A. M. Sánchez de la Campa, F. Amato, T. Moreno, L. F. Silva, and J. D. de la Rosa. 2019. Physicochemical characterization and sources of the thoracic fraction of road dust in a Latin American megacity. Sci. Total Environ. 652:434–46. doi:10.1016/j.scitotenv.2018.10.214.
- Sarmiento, R., L. J. Hernandez, E. K. Medina, N. Rodriguez, and J. Reyes. 2015. Sintomas respiratorios asociados con la exposicion a la contaminacion del aire en cinco localidades de Bogota, 2008-2011, estudio en una cohorte dinamica. Biomedica 35:167–76. doi:10.7705/biomedica.v35i0.2445.
- SDA. 2017. Informe anual de calidad del aire en Bogotá 2017. Bogota: Secretaria Distrital de Ambiente.
- Secretaria del Medio Ambiente de la Ciudad de Mexico. 2018. Inventario de Emisiones de la Ciudad de Mexico 2016. Ciudad de Mexico: Secretaria del Medio Ambiente.
- Sommer, F., V. Dietze, A. Baum, J. Sauer, S. Gilge, C. Maschowski, and R. Gieré. 2018. Tire abrasion as a major source of microplastics in the environment. Aerosol Air Qual. Res. 18:2014–28. doi:10.4209/aaqr.2018.03.0099.
- Teng, H., V. Kwigizile, M. Karakouzian, D. E. James, and V. Etyemezian. 2008. Investigation of the AP-42 sampling method AU. J. Air Waste Manage. Assoc. 58:1422–33. doi:10.3155/1047-3289.58.11.1422.
- Thorpe, A., and R. M. Harrison. 2008. Sources and properties of non-exhaust particulate matter from road traffic: A review. Sci. Total Environ. 400:270–82. doi:10.1016/j.scitotenv.2008.06.007.
- US-EPA. 2006. AP 42, chapter 13: Miscellaneous sources. Research Triangle Park, NC: US-Environmental Protection Agency.
- US-EPA. 2014. MOVES2014 software design reference manual. Research Triangle Park, NC: US-Environmental Protection Agency
- Vargas, F., N. Y. Rojas, J. E. Pachon, and A. G. Russell. 2012. PM10 characterization and source apportionment at two residential areas in Bogota. Atmos. Pollut. Res. 3:72–80. doi:10.5094/APR.2012.006.
- WHO. 2016. Ambient air pollution: A global assessment of exposure and burden of disease. Geneva, Switzerland: World Health Organization.
- Zafra, C. A., J. Temprano, and I. Tejero. 2008. Particle size distributioin of accumlated sediments on an urban road in rainy weather. Environ. Technol. 29:571–82. doi:10.1080/09593330801983532.