
 ?Mathematical formulae have been encoded as MathML and are displayed in this HTML version using MathJax in order to improve their display. Uncheck the box to turn MathJax off. This feature requires Javascript. Click on a formula to zoom.
ABSTRACT
A case study was conducted to evaluate the SO2 emission reduction in a power plant in Central Mexico, as a result of the shifting of fuel oil to natural gas. Emissions of criteria pollutants, greenhouse gases, organic and inorganic toxics were estimated based on a 2010 report of hourly fuel oil consumption at the “Francisco Pérez Ríos” power plant in Tula, Mexico. For SO2, the dispersion of these emissions was assessed with the CALPUFF dispersion model. Emissions reductions of > 99% for SO2, PM and Pb, as well as reductions >50% for organic and inorganic toxics were observed when simulating the use of natural gas. Maximum annual (993 µg/m3) and monthly average SO2 concentrations were simulated during the cold-dry period (152–1063 µg/m3), and warm-dry period (239–432 µg/m3). Dispersion model results and those from Mexico City’s air quality forecasting system showed that SO2 emissions from the power plant affect the north of Mexico City in the cold-dry period. The evaluation of model estimates with 24 hr SO2 measured concentrations at Tepeji del Rio suggests that the combination of observations and dispersion models are useful in assessing the reduction of SO2 emissions due to shifting in fuels. Being SO2 a major precursor of acid rain, high transported sulfate concentrations are of concern and low pH values have been reported in the south of Mexico City, indicating that secondary SO2 products emitted in the power plant can be transported to Mexico City under specific atmospheric conditions.
Implications: Although the surroundings of a power plant located north of Mexico City receives most of the direct SO2 impact from fuel oil emissions, the plume is dispersed and advected to the Mexico City metropolitan area, where its secondary products may cause acid rain. The use of cleaner fuels may assure significant SO2 reductions in the plant emissions and consequent acid rain presence in nearby populated cities and should be compulsory in critical areas to comply with annual emission limits and health standards.
Introduction
One of the major challenges faced by the Mexico City Metropolitan Area (MCMA) local authorities is air quality improvement through the establishment of control strategies and mitigation measures for major emissions sources. Different strategies to reduce emissions, such as the removal of lead from gasolines, reduction of sulfur content in diesel fuel and substitution of fuel oil with natural gas in industrial plants have been established (Cámara de Diputados de México Citation2006). Data collected by Mexico City´s atmospheric monitoring network shows a decrease in the average ambient SO2 concentration > 65%, achieved during the 1992–1993 period (SENER Citation2012). The resulting air quality improvement was due to a combination of factors, including the closure and subsequent soil remediation of the 18 de Marzo oil refinery in 1991 (Cámara de Diputados de México Citation2006), the compulsory switching from fuel oil to natural gas in the Jorge Luque Loyola power plant since the beginning of the 90´s, and an increased use of emission control technologies such as oil desulfurization or scrubbers (SENER Citation2012).
Despite the observed improvements in air quality, the atmospheric monitoring network still reports a high percentage of days with poor air quality and areas with acid rain problems, showing an evident and urgent need to address additional strategies. Refineries, power plants and other big industries, located in the outskirts of Mexico City, consume high sulfur content fuel oil (up to 4% weight). Regarding electricity generation, fossil fuel power plants are the primary sources of electricity in Mexico, with an average production of 245,649 GWh during 2005–2017 (SENER Citation2018), although natural gas accounts for 38% of the electricity production. Renewable energy sources such as geothermal and hydropower plants contribute with approximately 5%, whereas nuclear energy provides 1.7% of total energy production. In general, oil has reduced its share in primary energy use, while natural gas increased it (Sheinbaum, Ruiz, and Ozawa Citation2011). Annual SO2 emissions can be reduced by switching to cleaner fuels and benefiting the use of natural gas over fuel oil in generating units that can combine both fuels. With this approach, the hourly SO2 emission rate of the generating unit would not change when burning fuel oil, but its annual emissions would decrease when the percentage of natural gas increases.
In the United States, most of the electric generating units use fuel switching, instead of installing SO2 emissions controls, as a common acid rain federal Clean Air Interstate Rule compliance strategy (EPA Citation2013). In 2013, the US Energy Information Administration reported that SO2 emissions from the electric power sector in 2012 decreased due to an increase in the number of coal-fired power plant retrofits with fuel switching to low-sulfur coal and natural gas (US EIA Citation2013). In Kuwait, Alhajeri et al. (Citation2019) and Al-Fadhli et al. (Citation2019) used the AERMOD model to assess the effect of fuel oil switching to natural gas in electricity generation. They estimate a decrease of 84% in the number of SO2 exceedances, and over 98% in maximum SO2 concentrations when only natural gas is used in electricity production. Nakomcic-Smaragdakis, Cepic, and Cepic et al. (Citation2014) show a significant concentration reduction for different pollutants in the flue gas of a Serbian power plant, including SO2, when combined fossil fuels are used with higher proportions of natural gas. Other authors, such as Ishfaq, Raja, and Clark (Citation2016) mention the lower cost of electricity generation when natural gas is used. Even though the use of natural gas would decrease, besides SO2, emissions of almost all associated air pollutants, CO2 emissions are expected to remain or slightly increase. Therefore, fuel shifts should be accompanied with the use of carbon capture technologies to foster and advance the growth of clean technologies, as well as being an important key to meet the goal of lower emissions (Salovaara Citation2011).
Due to the proximity of Mexico City to the Tula-Vito-Apaxco industrial corridor (TVAIC) in Hidalgo, located to its northwest, the emission sources of the latter are considered to have a significant impact on the city´s air quality. Major pollutant sources in the TVAIC include a refinery, a thermoelectric power plant and five cement plants. As thermoelectric power plants are major emitters of sulfur compounds, one of the options to reduce the corresponding emissions is to switch to a cleaner fuel with substantial co-benefits and lower costs compared to other technologies (SENER Citation2012).
At least 90% of the sulfur present in fossil fuels used for power plants and power generation, among others, is emitted to the atmosphere as SO2 during combustion, which is equivalent to an estimate of 65 Tg SO2 per year of anthropogenic global emissions (Benkovitz et al. Citation1996). In addition, SO2, its secondary products (H2SO4, SO4 2-) and reactions products such as (NH4)2SO4 may lead to acid rain causing negative impacts on public health and ecosystems (Hewitt Citation2001).
In Mexico City, the levels of SO2, a major precursor of acid rain, do not longer represent an air quality problem; however, the high levels of sulfate observed in the wet atmospheric deposition continues to be a matter of concern. Long term spatiotemporal variation of acid rain has presented a pH decrease from north to south (SEDEMA Citation2018). In 1990, the U.S. Acid Rain Program was established, which aimed at reducing air pollution and resulted in maximum permissible levels for annual SO2 emissions (EPA Citation2015). These types of program can be taken as an example to implement similar programs in Mexico.
The goals of this study are: 1) to evaluate the reduction of SO2 emissions as a result of a shift of fuel oil to natural gas in a power plant located in the TVAIC, estimating atmospheric pollutants with emission factors reported in AP-42; 2) analyze the influence of SO2 emissions on the MCMA air quality, from January to December 2010, by means of the CALPUFF dispersion model and; 3) Associate TVAIC SO2 concentrations with acid rain composition in the MCMA.
Background
This section describes the location and characteristics of the study area, as well as the observed air quality in the Mexico City Metropolitan Area and how it is affected by the TVAIC emissions.
Study area
The TVAIC is located in the central Mexican state of Hidalgo within the Tula basin, 70 km NW of Mexico City (). The Tula basin has a surface of 1,730 km2 and almost 500,000 inhabitants, and is home to several industries such as cement, chemical, oil, coal, and plastic. Average temperatures range from 14 to 22°C and precipitation from 430–650 mm (SEMARNAT Citation2016).
Figure 1. Location of the Tula-Vito-Apaxco industrial corridor (TVAIC) in central Mexico. The dark color corresponds to urban areas; the MCMA corresponds to the gray spot in the center that extends north of Mexico City.
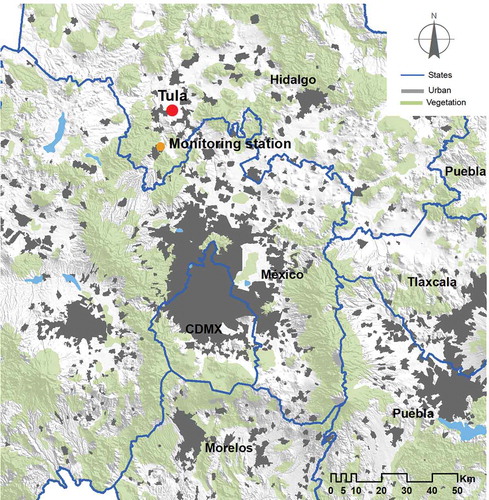
Minimum temperatures occur in January whereas maximum temperatures are registered from April to May. The rainy season usually takes place during the summer, from June to September (SEMARNAT Citation2016). Throughout the year, dominant winds come from the north and northeast at the Tula basin, with average wind speeds of 2.8 to 8.3 m/s. During winter, westerly winds intensify significantly, and, during summer, easterly winds with speeds between 16.7 and 18 m/s dominate. According to Rivera et al. (Citation2009), 18% of the high SO2 concentrations recorded by the monitoring network of Mexico City are transported from the Tula region to the MCMA due to wind direction and other meteorological conditions.
The Tula-Vito-Apaxco area has recorded a poor air quality for more than three decades, which led environmental authorities to classify this industrial corridor in 1989 as a critical area due to the high pollutant concentrations, considering the topography, meteorology, climate and demography in addition to the type of industrial activities (DOF Citation2012). As for the levels of pollutants released to the atmosphere by the TVAIC, during 2017 the complex emitted 217,228 Mg of SO2, 89,948 Mg of NOx, 34,949 Mg of PM10, 23,960 Mg of PM2.5, 268,990 Mg of VOC and 24,931 Mg of NH3 (SEMARNAT Citation2016). These emissions are similar to those discharged by the power generation plants in Ohio and Kentucky in the USA (Massetti et al. Citation2017). In 2011, in the TVAIC, major emitters (oil refineries, as well as power and cement plants) represented 99% of the SO2 emissions, 39% of NOx emissions, 49% of PM10 and 43% of PM2.5 (SEMARNAT Citation2016). Due to these high levels of air pollutants, the area is defined as a “hot spot”, especially for PM and SO2.
The “Francisco Pérez Ríos” power plant (CTFPR, for its acronym in Spanish), located in Tula, started operations in September 1975. It is a thermoelectric plant with a capacity of 1545.6 MW with five electricity generating units (three units of 300 MW each with tangential burners and two with 322.8 MW each with frontal burners). Configuration of the frontal burners with multiple flames generates cold and hot spots, which decreases the heat transmission efficiency. This type of burners has the inconvenience of NOx formation at high temperatures when compared with tangential burners with a single flame, which prevent high temperatures (Cureño, Bravo, and Sosa Citation2012).
Maximum permissible emission levels of smoke, PM, CO, SO2 and NOx for thermoelectric indirect heating combustion equipment (DOF Citation2012) are shown in . These emission limits are based on the rated thermal capacity of the equipment, fuel type, location of the fixed source and the reference conditions.
Table 1. Maximum permissible emission levels for thermoelectric indirect heating combustion equipment, NOM-085-SEMARNAT-2011 (DOF Citation2012).
Different reports based on short-term field measurements or in-plume transects consider that the TVAIC emissions sources, due to their proximity to Mexico City (70 km), are likely to have a negative impact on the city´s air quality (Almanza et al. Citation2014; Almanza, Molina, and Sosa Citation2012; Chow et al. Citation2002; de Foy et al. Citation2009; Escalante García et al. Citation2014; Molina et al. Citation2007; Rivera et al. Citation2009; Sosa et al. Citation2013). Some of the previous studies have addressed the impact of the power plant considering constant emissions, or short periods of information. These cannot account for differences in daily or hourly consumption, nor the corresponding emission variations, contrary to the data used in this study.
Air quality in the Mexico City Metropolitan Area (MCMA)
The MCMA air quality monitoring network (RAMA) consists of 45 stations where criteria and some other pollutants are measured since 1988 (SEDEMA Citation2018). The RAMA has allowed to record SO2 concentrations and, therefore, to evaluate the effectiveness of changing fuel oil for natural gas, among other strategies. shows the evolution of air pollution reduction in the MCMA from 1990 to 2017.
Figure 2. Temporal annual average air pollutant reduction from 1990 to 2017 within the MCMA.
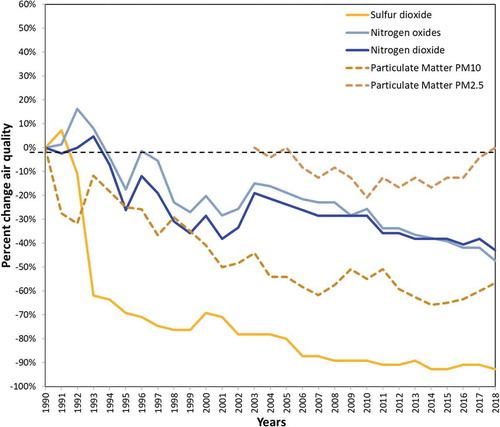
Currently, SO2 does not longer represent a problem for MCMA air quality, as the fuel replacement achieved a reduction of approximately 90% in SO2 levels. However, emission reduction (as, for example, by fuel substitution) has been a priority in the MCMA due to its high population density, but was not applied in other federal facilities outside the metropolitan area where emissions may affect the MCMA. At present, the CTFPR power plant is using fuel oil in its combustion process.
On the other hand, SO2 presence continues to generate concern due to its importance in acid rain formation and the high sulfate levels in wet atmospheric deposition. Although SO2 and NOx concentrations have been reduced during the last years, both pollutants lead to acid deposition not just on the emission area, but also on a regional scale. Spatiotemporal variations of the chemical composition of the rain were analyzed from 2005 to 2017 at different sampling stations located in the MCMA (SEDEMA Citation2018). During this period, a decrease in rain pH was observed from north to south, being 4.16 the lowest annual value of rain pH measured during 2006 in the southeast of the MCMA. The highest values of atmospheric wet deposition were recorded in the western area of the MCMA in 2007, with values of 24 and 20 kg/ha for SO4 2- and NO3 −, respectively, which were similar to levels of the same species registered in the USA during 2013 and 2014 (Bravo et al. Citation2015). As emission sources play an important role on acid rain formation within the MCMA, it is necessary to reinforce strategies to control precursors of acid rain coming from upwind sources outside the MCMA.
Methodology
Estimated emissions due to fuel shifting were determined for different pollutant categories, using US-EPA emission factors. Subsequently, SO2 dispersion was modeled with the CALPUFF model and the Mexico City air quality forecasting system (AQFS-CdMX).
Estimation of the pollutant emissions
The CTFPR information was used to evaluate the impact of the fuel shift on its emissions. Four categories of pollutants were considered to compare the pollutant levels emitted to the atmosphere for fuel oil and natural gas:
-
Criteria pollutants (SO2, CO, PM, NOx and Pb),
-
Greenhouse gases (CH4, CO2 and N2O),
-
Toxics organic compounds (benzene, formaldehyde, toluene), and PAH (acenaphthene, acenaphthylene, antracene, benzo(a)antracene, benzo(b,k,i)fluoranthene, benzo(g,h,i)perylene, chrysene, dibenzo(a,h)anthracene, phenanthrene, fluoranthene, fluorene, indeno(1,2,3-cd)pyrene, naphthalene and pyrene),
-
Toxic inorganic species (As, Ba, Be, Cd, Cr, Co, Cu, Mn, Hg, Mo, Ni, Se, V, and Zn),
Registered daily fuel oil consumption and energy generation were available from January 2010 to September 2011 for each of the five generating units, as well as information on sulfur content and calorific value from November 2010 to January 2011. The previous information was used in conjunction with calculated emission factors reported for external combustion sources in the AP-42 (US-EPA Citation2010) to determine pollutant emissions. For SO2, a specific emission factor for Mexican electricity generating plants was used (Cureño, Bravo, and Sosa Citation2010, Citation2012). shows the criteria pollutant emission factors used in this study, as well as calorific values and sulfur contents for fuel oil and natural gas; emission factors for greenhouse gases and organic and inorganic toxics are available in the complementary material.
Table 2. Emission factors used in this study for criteria pollutants, calorific values and sulfur contents for fuel oil and natural gas.
To determine the emissions for the fuel switch scenario, the required natural gas consumption was determined considering the same amount of energy generation per unit based on fuel oil consumption and considering the differences in calorific value between both fuels.
To determine emissions, the following equation was used:
E: emission
η: control system efficiency
EF: emission factor
A: activity level
CALPUFF dispersion modeling
To determine the impact of SO2 emissions on air quality due to the combustion of fuel oil at the power plant, the CALPUFF/CALMET air dispersion model was applied for hourly data (March 4, 2010 to February 9, 2011), to model the meteorology and SO2 transport from the power plant in the Tula industrial corridor, and to evaluate its impact on air quality. In this paper, only power plant emissions of SO2 were considered, as they represent 99% of the total emissions at the TVAIC (217,228 Mg of SO2).
CALPUFF is a non-stationary Gaussian puff model that can analyze transport, dispersion, concentration, and atmospheric deposition of primary, secondary, and toxics pollutants. It can consider multiple species and layers for dispersion studies. The model considers two modules for SO2 and NOx reactions in the atmosphere, being RIVAD and MESOPUFF.
CALPUFF components include CALMET (a meteorological model that develops hourly wind and temperature fields on a three-dimensional gridded modeling domain), CALPUFF (a transport and dispersion model of the emitted pollutants from modeled sources), and CALPOST (the post processing package).
CALPUFF source data considered that the power plant has two generating units with a diameter of 3.4 m, two units with a 5.3 m diameter and one with a 5.4 m diameter, most of them with a height of 65 and one with 56 m, and average gas exit temperatures ranging between 430.8 to 460.1 K (). This information was fed to the CALPUFF model to determine the transport, dispersion and concentration of the anthropogenic point source.
Table 3. Technical specification of the generating units at the CTFPR.
Model parameters were as follows:
-
The geographical reference used in this study was the Universe Transverse Mercator Reference Ellipsoid WGS-84, where the power plant is located in UTM zone 14 at 471.01 km E, 2217.68 km N.
-
The required geophysical data, such as terrain data (GTOPO30, resolution 900 m) and land use data (ESR-S, GLCC North America, resolution 1 km) were loaded from the webGIS CALPUFF model.
-
The simulation domain used in the dispersion model to determine SO2 concentrations from the power plant at a regional scale was 60 × 60 km2, with 60 grid cells both east-west and north-south, with a resolution of 1 km and the vertical levels for the meteorology were: 10, 30, 60, 120, 240, 660, 1250, 1850 and 2600 m. The radius of influence was 80 km, depending on topography features, and a complex terrain was considered.
-
Meteorological data was processed using the fifth-generation mesoscale model MM5 from the National Center for Atmospheric Research/Pennsylvania State University (NCEP Citation2018). The meteorological model considered two domains, 1) the first one with a size of 170 × 120 points and point resolution of 24 km, 2) the second one with a size of 31 × 31 points and point resolution of 8 km. The Mercator map for MM5 had reference coordinates of UTM 749.66 km E, 2615.90 km N in zone 13. Meteorological information for MM5 modeling was available for the period between March 2010 and February 2011.
-
Surface meteorological data was available for the CECATI meteorological station located 14.6 km south-southwest of the power plant (UTM zone 14, at 464.33 km E, 2204.72 km N), from March 4, 2010 to February 28, 2011.
-
The analysis of the wind vectors generated by MM5 and surface meteorological data was done with the CALMET model, which performed hourly simulations for the defined modeling period, to feed the CALPUFF model.
-
To compare model results with measured data, a single discrete receptor was included, corresponding to the air quality monitoring station located at the meteorological monitoring site (UTM zone 14, at 464.33 km E, 2204.72 km N), in addition to the gridded receptors described above.
-
Model results include the time series of estimated SO2 concentrations in the monitoring site, as well as 1 hr, 24 hr, monthly and period average concentrations throughout the modeling grid.
AQFS-CdMX modeling
In order to analyze the SO2 dispersion toward the MCMA on a larger scale, CALPUFF outcomes were compared with results from an additional modeling system. Local environmental authorities at Mexico City Secretariat for the Environment (SEDEMA) implemented in 2017 an air quality forecasting system for Mexico City (AQFS-CdMX), to provide 24 and 48-hour weather and air quality forecasts within the MCMA, with high spatial (1 km2) and temporal (1 hr) resolutions. Model results are based on the interaction of meteorology, emissions and air quality forecasts.
Regarding the forecast of meteorological parameters, the Model Research and Forecasting-Advanced Search (WRF-ARW) was used. For the processing of emission information, the flexible system HERMES-Mex was developed, which allows spatial, temporal and speciation disaggregations, based on available information from the 2014 SEDEMA Emission Inventory and the 2013 National Emission Inventory. The simulation of pollutant transport and chemical reactions is carried out by means of the Community Multi-scale Air Quality (CMAQ) (US-EPA Citation2019).
The AQFS-CdMX system runs on 4 domains. On the first two, the WRF-ARW model was executed, with a resolution of 9 and 27 km2, respectively. Their coverage allows to adequately consider the meteorological systems that affect the MCMA, both those that come from the northern and southern part of the continent, and the phenomena that occur in the Gulf of Mexico and Pacific Ocean. On the third domain, all three models are run with a 3 km2 resolution, to provide the meteorological and chemical boundary conditions for a fourth nested domain. The latter generates the final forecast of criteria pollutants for the MCMA with a 1 km2 resolution.
Results and discussion
This section describes the emissions determined by AP-42 emission factors for the four categories of pollutants described above, as well as the CALPUFF modeling results regarding the impact of SO2 emissions from fuel oil and natural gas combustion at the TVAIC power plant on MCMA air quality, applied on a daily basis for 2010. SO2 dispersion was corroborated with the AQFS-CdMX modeling system, developed by MCMA local authorities.
Emissions
shows a comparison of the total emissions for 2010 (in Mg) for fuel oil and natural gas consumption at the CTFPR, for the 40 species considered in this study. For most pollutants, the results showed significant differences between fuel oil and natural gas emissions. These results agree with reported information for natural gas-fired electric generating units where emissions of particulate matter, SO2 and mercury are orders of magnitude lower for gas than for fuel oil (US-EPA Citation2010).
Figure 3. Comparison of the total annual emissions (sum of the five generating units) during 2010, for fuel oil and natural gas consumption at the CTFPR.
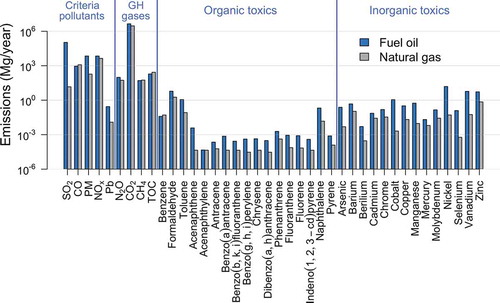
Total estimated emissions showed that when fuel oil is used in the power plant, emissions are higher with respect to the hypothetical case were natural gas is used, for most of the emitted 40 species considered in this study. Exceptions were CO, CH4, total organic carbon and benzene, with slightly higher emissions when using natural gas. Natural gas, despite having lower emission factors, has a calorific value of around 1000 times smaller than fuel oil, so much larger quantities are required to reach the same level of power generation. For natural gas burning in generating units with frontal configuration, CO emissions are expected to be four times higher than those of generating units with tangential configuration, which suggests that tangential configurations favor a more efficient combustion, lowering CO emissions accordingly.
With respect to greenhouse gases, emissions were similar for both fuels, so other technological approaches should be considered to decrease these gases. In general, emissions for most toxics organic compounds decreased when natural gas was used as a fuel. Emissions of toxic inorganic species from natural gas combustion also decreased for most species, but it was more significant for arsenic, cobalt, manganese, nickel, selenium and vanadium.
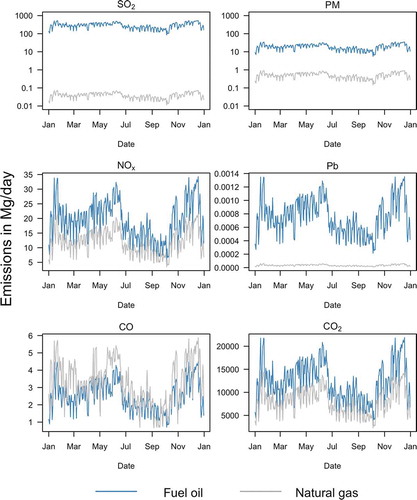
shows a comparison of emissions from fuel oil and natural gas combustion for criteria pollutants and CO2. As fuel consumption had an important variation coefficient (0.33) for 2010, the corresponding emissions present varying levels throughout the year. A significant average reduction of SO2 emissions was observed (> 99%), decreasing from 327 ± 109 Mg/day to 0.045 ± 0.015 Mg/day when using natural gas. Average emissions of PM decreased from 19 to <1 Mg/day (>96%). Average lead (Pb) emissions also decreased over 95%, from 0.001 Mg/day to less than 5% that amount when using natural gas. Significant emission reductions were obtained for the aforementioned pollutants, but no significant differences were observed for CO, NOx and CO2 emissions, due to the lower calorific value of natural gas, which increases the required amount.
Figure 4. Comparison of total daily emissions of SO2, CO, NOx, Pb, PM and CO2, for fuel oil and natural gas consumption during 2010. SO2 and PM have logarithmic y-axis scales.
Meteorology
As Tula does not have a meteorological station, wind data from the CECATI station in Tepeji del Rio, located 14 km south-southeast of the TVAIC, was analyzed to understand meteorological conditions in Tula. Measured data records include surface temperature (°C), pressure (mbar), humidity (%), wind speed (m/s) and direction (degrees), rainfall (mm) and solar radiation (W/m2) and are available on an hourly basis from March 4, 2010 to February 10, 2011. The wind roses in summarize this information.
Figure 5. Wind roses for the cold-dry, warm-dry and warm-wet seasons in the CECATI station in Tepeji del Río, March 2010 – February 2011.
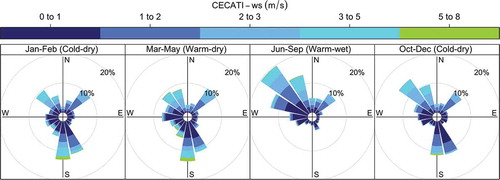
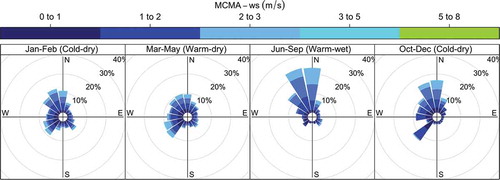
Daytime patterns at Tepeji correspond to low wind speeds during the early morning, increasing gradually from 8:00 to maximum values around 17:00 and decreasing during the night. Atmospheric conditions at night showed low cloudiness and wind speeds between 2 and 4 m/s, with slight to moderate atmospheric stability, causing thermal inversions and resulting in poor pollutant transport and dispersion. These results indicate that pollutants from the TVAIC might be transported to Mexico City. To corroborate this, wind roses corresponding to hourly wind data in 3 monitoring stations in the northern area of MCMA (FAC, TLA and VIF) were plotted (see ). Results showed that observed wind directions from north and northwest were observed in up to 40% of the occasions, suggesting that there was an impact on MCMA from upwind emissions, i.e. from the TVAIC direction.
Figure 6. Wind roses for the cold-dry, warm-dry and warm-wet seasons for the northern part of the MCMA, January – December 2010.
Model results
Since, in the critical area of Tula, major emissions are due to SO2, only this pollutant was selected to evaluate the impact of TVAIC power plant emissions on the MCMA air quality. The CALPUFF dispersion model was used to simulate SO2 mass concentrations for both scenarios, using fuel oil and natural gas; average hourly and 24 hr concentrations were estimated from the emission data determined for the generating units at the power plant.
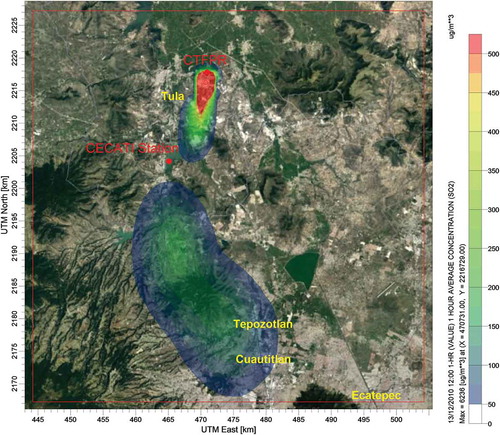
As expected by the high emissions, the winter cold-dry season showed the highest SO2 concentrations due to fuel oil burning, and frequent exceedances to the air quality standard (AQS) were observed in December. With respect to the impact of the SO2 plume, winds with a northerly component advect the SO2 plumes from Tula into the northern MCMA basin, where they increase local SO2 levels, resulting in AQS exceedances. By contrast, lower concentrations of SO2 were observed at the southern areas of the MCMA for most of the year, as these areas were not reached by SO2 plumes coming from the northern industrial corridors. In general, simulation results showed local impacts within 10 to 15 km from the power plant, were high hourly concentrations were observed and the 24 hr AQS was exceeded in several occasions. There are only few cases where the transport and dispersion of SO2 had a direct impact on the MCMA. shows an example of the impact to the MCMA of the SO2 plume from Tula, for December 13, 2010.
Figure 7. Hourly SO2 concentrations (μg/m3) estimated by CALPUFF for fuel oil consumption at the CTFPR, December 13, 2010 (12:00 LT). The CECATI meteorological station and CTFPR power plant are indicated in red.
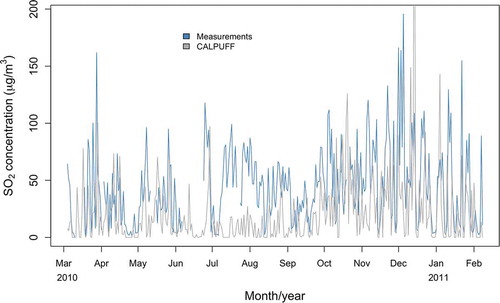
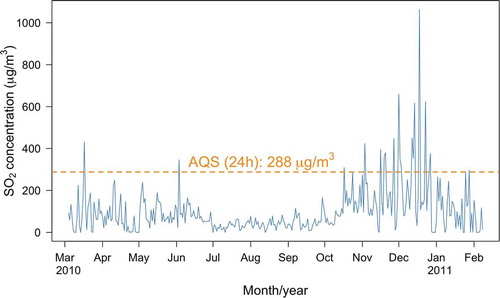
For model validation purposes, the modeled results were compared with real time SO2 measured concentrations, from the CECATI meteorological and monitoring station at Tepeji del Rio, (), showing a good agreement, comparable orders of magnitude and the reproduction of most of the concentration peaks. Model results (gray line) underestimate the SO2 measurements (blue line) by 35%, on average. The corresponding mean absolute percent error was 0.9, indicating that the model overestimated or underestimated the measurements by the same amount as the latter. Any discrepancy is due to the contribution from other SO2 sources than the power station units. However, the fact that the observed peaks are replicated suggests that the tool can be used to assess the impact of the TVAIC on the MCMA air quality.
Figure 8. Comparison of measured (CECATI station) and modeled (CALPUFF) SO2 emissions for fuel oil consumption between March 4, 2010 and February 9, 2011.
Temporal and seasonal variations of SO2 concentrations at TVAIC and MCMA
Simulation results indicate that, in 2010, the SO2 annual average AQS of 65 µg/m3 was exceeded 15 times, as the maximum average value was 993 µg/m3. Although rather big areas with 24 hr AQS exceedances were estimated throughout the year in the surroundings of the plant, high SO2 concentrations can also be observed further south, depending on the prevailing meteorological conditions. Simulated 24 hr SO2 mass concentrations from the CALPUFF model were used to assess the concentration variations to the south of the plant.
In regions more than 15 km south of the plant, annual average concentrations up to 99 µg/m3 were still observed. shows the temporal profile of the 24 hr maximum SO2 concentration for all model receptors located more than 15 km south of the CTFPR power plant. The orange line corresponds to the Mexican 24 hr AQS (288 µg/m3), which was exceeded on 18 days in the specified region. More exceedances were observed during the cold-dry season (5, 9 and 1 exceedances in November, December and January, respectively). Higher concentration values and exceedances in December with respect to other months can be explained by a lower consumption pattern during summer compared to winter (), lower wind speeds with respect to January to May () and absence of rain. shows high emission values due to fuel consumption in May and June (as in December); however, as these months fall in the rainy season, pollutants may wash out with rain.
Figure 9. Temporal profile of CALPUFF simulated SO2 concentrations during 2010 for receptors > 15 km south of the CTFPR. The orange line corresponds to the Mexican AQS for 24 hr averages.
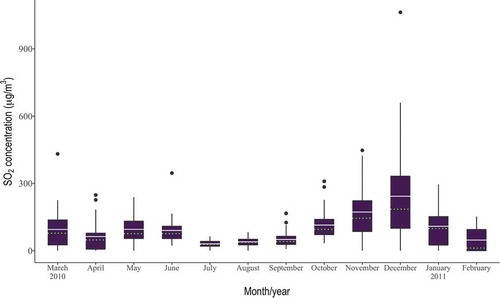
Monthly profiles of simulated maximum 24 hr SO2 concentrations from March 2010 to February 2011 are shown in , for the region > 15 km south of the plant. Higher average maximum 24 hr concentrations were observed during the cold-dry and warm-dry seasons, fluctuating from 152 to 1063 µg/m3, and from 239 to 432 µg/m3, respectively. The highest simulated SO2 concentrations obtained for the cold-dry winter season could be due to regional transport of oil and gas activities coupled with high atmospheric stability, low wind speed (less than 2 m/s), and low mixing layer heights (50 to 368 m) due to low temperatures observed during this season. A significant variation of simulated SO2 concentrations was observed in December, with values up to 1063 µg/m3 and an average concentration of 243 µg/m3. On the contrary, the lowest SO2 concentrations were obtained for July, with averages of 64 µg/m3.
Figure 10. Box-whisker plot of simulated maximum 24 hr SO2 mass concentrations from fuel oil consumption at the CTFPR during March-December 2010 and January-February 2011.
Impact on MCMA air quality due to TVAIC emissions
To ascertain if TVAIC emissions impact air quality in the MCMA, hourly average SO2 concentrations, measured during 2010 within the MCMA, were combined with meteorological data and the corresponding spatial distribution was plotted (). In , darker color dots correspond to concentrations > 620 µg/m3. It should be noted that TVAIC’s SO2 emissions not only come from the power plant, but also from nearby oil refinery facilities and cement plants. For this reason, the concentrations registered in the monitoring stations are higher than those estimated with the CALPUFF model.
Figure 11. Spatial distribution of the 2010 daily average SO2 concentration in µg/m3 at 12 monitoring stations within the MCMA.
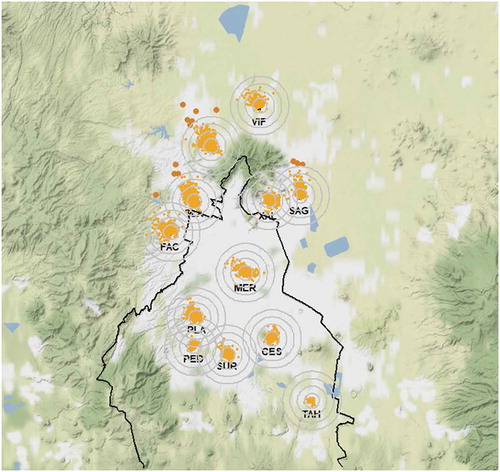
As the northern sites are closer to the TVAIC emissions sources, higher SO2 concentrations were registered at these monitoring stations, compared to locations south of the MCMA. Furthermore, the higher SO2 levels in the north of the MCMA were associated with northerly wind flows, suggesting that most of the TVAIC’s SO2 emissions traveled long distances downwind before reaching the ground in the north of the MCMA, in accordance with previous studies (Rivera et al. Citation2009; Sosa et al. Citation2013). In addition, although most of the SO2 oxidation is reported to occur in the immediate vicinity of the power station, Almanza, Molina, and Sosa (Citation2012) reported an 18 to 27% contribution of Tula´s flaring activities to the total SO2 ambient air concentration at northern MCMA. On the other hand, de Foy et al. (Citation2009) suggested from model estimates that emissions from the nearby Popocatepetl volcano could also contribute with about one tenth of the SO2 levels recorded at the MCMA. However, annual SO2 emission fluxes from the Popocatepetl volcano were reported from 2005 to 2016 by Carn et al. (Citation2017), being minimal the SO2 flows in 2010. Based on this information, we conclude that the contribution of the volcano was not significant during the period of this study.
shows the monthly profiles of 24 hr SO2 concentrations at different points of the MCMA during 2010, determined as average values over the 6 northern monitoring stations showed in . As can be observed in , measured 24 hr SO2 concentrations in the MCMA follow a similar monthly pattern as the one observed for the estimated 24 hr SO2 concentrations for the TVAIC power plant (), reinforcing the hypothesis that SO2 affectation in the MCMA is originated in the TVAIC region.
Figure 12. Box-Whisker plot of monthly distributions of 24 hr SO2 concentration at 6 northern monitoring stations (see ) within the MCMA during 2010.
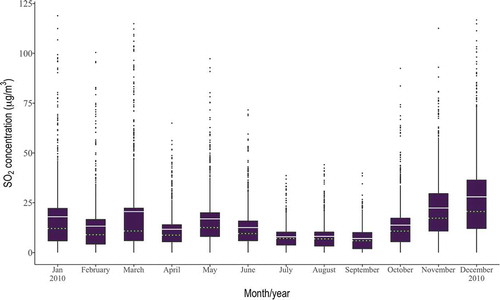
Significantly higher average concentrations were observed during the cold-dry and the warm-dry season. The highest SO2 concentrations were observed during the November-December and January-February periods, whereas the lowest SO2 concentrations were registered during the June-September period (the wet period). A rough comparison of the scales of and indicates that around 5% of the SO2 emitted in the TVAIC might travel to the MCMA.
AQFS-CdMx model results
As mentioned before, when using natural gas, the SO2 emissions are reduced in more than 90% and, apparently, no significant direct health impact by SO2 to the MCMA will be observed after a fuel switch, as the AQS will not be violated. However, although SO2 affectation is rather local, its secondary products such as sulfates may cause negative impacts on MCMA air quality.
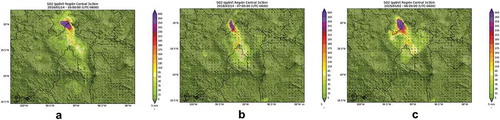
shows an example (January 14, 2018) of how SO2 emissions from the CTFPR affect the north of the MCMA in the cold-dry period, according to the results of the AQFS-CdMX model. Similar results can be observed for the warm-dry period, as showed in and for respectively March 14, 2018 (06:00 LT) and April 2, 2019 (07:00 LT). The presented results are equivalent to CALPUFF modeling results: although the TVAIC area receives most of the direct SO2 impact, the plume is dispersed and advected to the MCMA, where its secondary products may cause acid rain as a result of having high concentration of its precursors.
Figure 13. MCMA affectation due to SO2 emissions from the CTFPR, estimated by the AQFS-CdMX system for selected days and hours: (a) January 14, 2018 (10:00 LT), (b) March 14, 2018 (06:00 LT) and (c) April 2, 2019 (07:00 LT).
Wet atmospheric deposition
Despite the historically decreasing trend of the annual average of SO2 concentrations and the reduction of over 90% in the SO2 concentration in ambient air in the MCMA (), its secondary products, such as sulfate, can produce acid rain. shows the annual average sulfate concentrations (µEq/L) in the wet atmospheric deposition during 2010 in the MCMA.
Figure 14. Annual average sulfate concentrations (µEq/L) in atmospheric wet deposit during 2010, in different sites of the MCMA: IBM Legaria (IBM), Laboratorio de Analisis Ambiental (LAA) and Tlalnepantla (TLA) at the NE; Chapingo (CHA), Netzahualcóyotl Sur (NTS), Cerro del Tepeyac (TEC) and Xalostoc (XAL) at the NW; Museo (MCM) at the Center; Diconsa (DIC), Ecoguardas Ajusco (EAJ), Ex-convento Desierto de los Leones (EDL), Lomas (LOM), Parres (PAR), San Nicolás Totolapan (SNT) at the SW; Corena (COR) and Milpa Alta (MPA) at the SE.
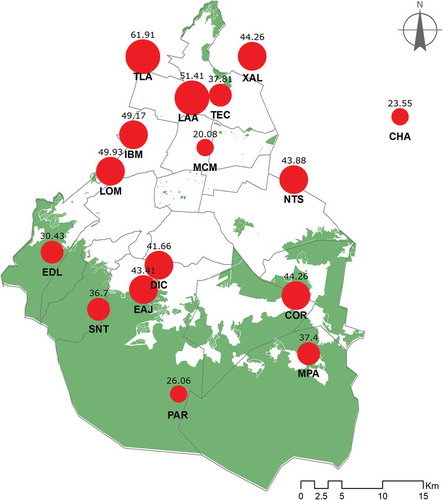
The highest average SO4 2- concentrations were recorded at the northeastern part of the urban area, with concentrations up to respectively 61.9 µEq/L. As might be expected, this area also registered the highest rain acidity with a pH ranging from 5.2 to 5.6. Therefore, high concentrations of SO4 2- were quite probably due to the contribution of SO2 from sources located upwind, such as those from the TVAIC.
From the above discussion, it is clear that expansion of the MCMA deposition network is needed at different locations to evaluate the effect of policies to reduce SO2 emissions, and also to study and understand specific deposition parameters, as well as space and time variation of dry deposition and its relationship with air pollution. In addition, fuel switching should be considered to meet daily and seasonal emission limits, especially in critical areas where switching to natural gas should be compulsory to comply with annual SO2 emission limits.
As most of the published studies have been carried out during the warm-dry season, the comparison of the results obtained in this study with other studies is not straightforward. However, results agree with those found by Chow et al. (Citation2002), which suggest a contribution from the TVAIC with two-thirds of the SO4 2- due to wind transport from north to south toward the MCMA. In addition, a study carried out in the MCMA during 2003 reported high particulate SO4 2- loadings associated with transport from the north (Salcedo et al. Citation2006), and de Foy et al. (Citation2007) suggested that the Tula industrial complex accounted for the high SO2 episodes during the Milagro campaign.
Conclusion
In this study, the evaluation of the SO2 emission reduction as a result of the shift of fuel oil to natural gas in the “Francisco Pérez Ríos” thermoelectric power plant located in the TVAIC and its possible impact on MCMA air quality was determined using advanced dispersion models. Emission estimates of criteria pollutants, organic and inorganic toxics, and greenhouse gases were based on AP-42 emission factors and information on power generation and daily fuel oil consumption per generation unit during 2010, provided by plant personnel. The results of this study might not compare with results of other studies that use different emission factors, corrections to AP-42 emission factors, or include point measurements.
Model results based on the estimated emissions identified episodic SO2 events during the winter, coinciding with elevated SO2 emissions at the thermoelectric plant. CALPUFF simulated SO2 mass concentrations during 2010 frequently exceeded the 24 hr AQS, especially during the cold-dry period. Variability of power plant emissions enables the possibility of a significant impact on the MCMA air quality, especially when there are both large emissions at the source and favorable meteorological conditions to transport pollutants to the MCMA. Although SO2 levels no longer represent an air quality problem at the MCMA, the presence of acid rain and the high levels of sulfates in the wet atmospheric deposition is still a matter of concern. Long term spatiotemporal variation of acid rain showed a pH decrease from north to south with a minimum annual value of 4.16.
A proven option for reducing emissions from the existing thermoelectric power plant is switching to the use of a cleaner fuel, which would generate substantial co-benefits at lower costs.
There has been an improvement in the emission rates of air pollutants by major sources located at the TVAIC, but besides the use of emission control technologies and the switch to natural gas, it should be compulsory for major emitters that burn primarily fossil fuels to meet annual emission requirements for primary precursors of acid rain (SO2 and NOx) to assure permanent SO2 reductions and avoid the acidic deposition.
Despite the decreasing tendency of annual SO2 concentrations, its secondary products were found in concentrations up to 61.9 µEq/L for SO4 2-. The area also registered a high acidity with pH values ranging from 5.2 to 5.6. These elevated SO4 2- concentrations in wet deposition are probably due to the contribution of SO2 from sources located upwind, i.e. the TVAIC.
Results of the emission estimation showed that switching from fuel oil to natural gas can bring several benefits such as: a reduction of over 99% of SO2 emissions; a decrease in PM emissions from 19 Mg/day to less than 1 Mg/day, and a drop of Pb emissions from 0.001 Mg/day up to less than 5% of that amount. Emission reductions were over 95% for the abovementioned criteria pollutants, concluding that fuel switching seems to be a feasible solution to reduce emissions of thermoelectric power plants that use fuel oil as a primary fuel. For NOx and CO2 emissions, no significant differences were observed when using fuel oil or natural gas, while CO, TOC and benzene emissions increased.
Although no energy source is perfect in view of its environmental impact, natural gas is a cleaner source, as it does not produce SO2, PM or H2S emissions. As primary energy supplies will still be used in coming years, switching to the use of cleaner fuels like natural gas may assure significant reductions of SO2 and should be compulsory in critical areas to comply with annual SO2 emission limits. To achieve this goal, local authorities should warrant the availability at low cost of the natural gas required for federal generating units, since, at present, the private sector is favored. Additionally, carbon capture, utilization and storage technologies should be considered for reducing the emissions of greenhouse gases.
In addition, deposition networks are needed at different locations to evaluate the effect of policies to reduce SO2 emissions and to study deposition and its relationship with air pollution.
Finally, future studies are suggested to include substantial information about the type of source emission, the type and amount of emissions and fuel consumption required to reduce SO2 emissions, as well as about the local meteorology. They should also consider other major emission sources in the area, to be able to finetune modeled results.
Acknowledgment
This study was supported by UNAM under the program PAPIIT IN116215. The authors are grateful to Edgardo Moreno T. and Iris Violeta Cureño G. for the support provided during the development of this study.
Disclosure statement
No potential conflict of interest was reported by the authors.
Additional information
Funding
Notes on contributors
Rodolfo Sosa E.
Rodolfo Sosa E., Elizabeth Vega are research professors at the Environmental Pollution Section, Centro de Ciencias de la Atmósfera, Universidad Nacional Autonoma de Mexico, in Mexico City, Mexico.
Ann Wellens
Mónica Jaimes is the sub-director of the Analysis and Modeling of the Secretaria del Medio Ambiente in Mexico City, Mexico.
Mónica Jaimes
Ann Wellens is a professor at the Engineering Faculty, Universidad Nacional Autonoma de Mexico, in Mexico City, Mexico
Gilberto Fuentes G
Gilberto Fuentes G., Elías Granados H., Ana Luisa Alarcón J., María del Carmen Torres B., Pablo Sánchez A. and Evelin Mateos D. are technical staff at the Environmental Pollution Section, Centro de Ciencias de la Atmósfera, Universidad Nacional Autonoma de Mexico, in Mexico City, Mexico
Sergio Rosas A.
Sergio Rosas A. is a consultant of the Environmental Department at the Comision Federal de Electricidad, in Mexico City, Mexico.
References
- Al-Fadhli, F. M. , N. S. Alhajeri , A. Z. Aly , and D. T. Allen . 2019. The impact of power plant emission variability and fuel switching on the air quality of Kuwait. Sci. Total Environ. 672:593–603. doi:10.1016/j.scitotenv.2019.03.441.
- Alhajeri, N. S. , M. Dannoun , A. Alrashed , and A. Z. Aly . 2019. Environmental and economic impacts of increased utilization of natural gas in the electric power generation sector: Evaluating the benefits and trade-offs of fuel switching. J. N. Gas Sci. Eng. 71:102969. doi:10.1016/j.jngse.2019.102969.
- Almanza, V. H. , L. T. Molina , G. Li , J. Fast , and G. Sosa . 2014. Impact of external industrial sources on the regional and local SO2 and O3 levels of the Mexico megacity. Atmos. Chem. Phys. 14 (16):8483–99. doi:10.5194/acp-14-8483-2014.
- Almanza, V. H. , L. T. Molina , and G. Sosa . 2012. Soot and SO2 contribution to the supersites in the MILAGRO campaign from elevated flares in the Tula Refinery. Atmos. Chem. Phys. 12 (21):10583–99. doi:10.5194/acp-12-10583-2012.
- Benkovitz, C. M. , M. T. Scholtz , J. Pacyna , L. Tarrason , J. Dignon , E. C. Voldner , P. A. Spiro , J. A. Logan , and T. E. Graedel . 1996. Global gridded inventories of anthropogenic emissions of sulphur and nitrogen. J. Geophys. Res. 101 (D22):29239–53. doi:10.1029/96JD00126.
- Bravo, H. , R. Sosa , P. Sánchez , A. Quintanar , V. H. Paramo , A. H. Retama , and M. P. Jaimes (2015). Actual state of the air quality in Mexico City. Proceeding of the 106th Annual Conference & Exhibition of the Air & Waste Management Association. Chicago, Illinois, USA.
- Cámara de Diputados . 2006. Sobre la construcción del parque ecológico en la ex refinería 18 de Marzo. México, DF: Información Legislativa. http://www.senado.gob.mx/64/gaceta_del_senado/documento/10327.
- Carn, S. A. , V. E. Fioletov , C. A. McLinden , C. Li , and N. A. Krotkov . 2017. A decade of global volcanic SO2 emissions measured from space. Sci. Rep. 7 (1):44095. doi:10.1038/srep44095.
- Chow, J. C. , J. G. Watson , S. A. Edgerton , E. Vega , and E. Ortiz . 2002. Spatial differences in outdoor PM10 mass and aerosol composition in Mexico City. J. Air Waste Ma. 52:423–34. doi:10.1080/10473289.2002.10470791.
- Cureño, I. , H. Bravo , and R. Sosa . 2010. The importance of the generation and applications of emission factors for developing countries. Proceedings of the 103rd Annual Conference and Exhibition of the Air & Waste Management Association. Calgary, Canada. June.
- Cureño, I. , H. Bravo , and R. Sosa . 2012. The importance of the generation of emission factors for developing countries: Case of Mexico. J. Environ. Sci. Eng. 1 (4):495–502.
- de Foy, B. , N. A. Krotkov , N. Bei , S. C. Herndon , L. G. Huey , A.-P. Martínez , L. G. Ruiz Suárez , E. C. Word , M. Zavala , and L. T. Molina . 2009. Hit from both sides: Tracking industrial and volcanic plumes in Mexico City with surface measurements and OMI SO2</sub> retrievals during the MILAGRO field campaign. Atmos. Chem. Phys. 9 (24):9599–617. doi:10.5194/acp-9-9599-2009.
- de Foy, B. , W. Lei , M. Zavala , R. Volkamer , J. Samuelsson , J. Mellqvist , B. Galle , A. P. Martinez , M. Grutter , A. Retama , et al. 2007. Modelling constraints on the emission inventory and on vertical dispersion for CO and SO2</sub> in the Mexico City Metropolitan Area using Solar FTIR and zenith sky UV spectroscopy. Atmos. Chem. Phys. 7 (3):781–801. doi:10.5194/acp-7-781-2007.
- DOF . 2012. Contaminación atmosférica - Niveles máximos permisibles de emisión de los equipos de combustión de calentamiento indirecto y su medición. NOM-085-SEMARNAT-2011, Diario Oficial de la federación, 02/ 02/2012. http://www.dof.gob.mx/nota_detalle.php?codigo=5232012&fecha=02/02/2012.
- EPA . 2013. Clean air interstate rule, acid rain program, and former NOx budget trading program: 2012 progress report. https://www.epa.gov/sites/production/files/2016-10/documents/2013_full_report_0.pdf.
- EPA . 2015. Cross-state air pollution rule and acid rain program. Program Progress Environmental Protection Agency. https://www3.epa.gov/airmarkets/progress/reports/index.html.
- Escalante García, J. S. , J. A. García Reynoso , A. Jazcilevich Diamant , and L. G. Ruiz-Suárez . 2014. The influence of the Tula, Hidalgo complex on the air quality of the Mexico City Metropolitan Area. Atmósfera 27 (2):215–25. doi:10.1016/S0187-6236(14)71111-7.
- Hewitt, C. N. 2001. The atmospheric chemistry of sulphur and nitrogen in power station plumes. Atmos. Environ. 35 (7):1155–70. ISSN 1352-2310. doi:10.1016/S1352-2310(00)00463-5.
- Ishfaq, R. , U. Raja , and M. Clark . 2016. Fuel-switch decisions in the electric power industry under environmental regulations. IIE Trans. 48 (3):205–19. doi:10.1080/0740817X.2015.1056391.
- Massetti, E. , M. Brown , M. Lapsa , I. Sharma , J. Bradbury , C. Cunliff , and Y. Li . 2017. Environmental quality and the U.S. power sector: Air quality, land use and environmental justice. Prepared by the Oak Ridge National Laboratory, US Department of Energy. Washington. D.C. Report number ORNL/SPR-2017/772.
- Molina, L. T. , C. E. Kolb , B. de Foy , B. K. Lam , W. H. Brune , J. L. Jimenez , R. Ramos-Villegas , J. Sarmiento , V. H. Paramo-Figueroa , B. Cardenas , et al. 2007. Air quality in North America’s most populous city – Overview of the MCMA-2003 campaign. Atmos. Chem. Phys 7 (10):2447–73. doi:10.5194/acp-7-2447-2007.
- Nakomcic-Smaragdakis, B. , Z. Cepic , M. Cepic , and T. Staji. 2014. Data analysis of the flue gas emissions in the thermal-power plant firing fuel oil and natural gas. Int. J. Environ. Sci. Technol. 11:269–80. doi:10.1007/s13762-013-0388-8.
- NCEP . 2018. National centers for environmental prediction. https://www.ncep.noaa.gov/.
- Rivera, C. , G. Sosa , H. Wöhrnschimmel , B. de Foy , M. Johansson , and B. Galle . 2009. Tula industrial complex (Mexico) emissions of SO2 and NO2 during the MCMA 2006 field campaign using a mobile mini-DOAS system. Atmos. Chem. Phys. 9:6351–61. doi:10.5194/acp-9-6351-2009.
- Salcedo, D. , T. Onasch , K. Dzepina , M. Canagaratna , Q. Zhang , J. A. Huffman, P. F. DeCarlo, J. T. Jayne, P. Mortimer, D. R. Worsnop, et al. 2006. Characterization of ambient aerosols in Mexico City during the MCMA-2003 campaign with Aerosol Mass Spectrometry: Results from the CENICA Supersite. Atmos. Chem. Phys. 6 (4):925–46. doi:10.5194/acp-6-925-2006.
- Salovaara, J. 2011. Coal to natural gas fuel switching and CO2 emissions reduction. M-RCBG Associate Working Paper Series – No. 6. Bachelor thesis, Mossavar-Rahmani Center for Business & Government, Harvard Kennedy School. https://hepg.hks.harvard.edu/publications/coal-natural-gas-fuel-switching-and-co2-emissions-reduction.
- SEDEMA . 2018. Calidad del aire en la Ciudad de México, informe anual 2017. Secretaría de Medio Ambiente de la Ciudad de México, Dirección General de Gestión de la Calidad del aire, Ciudad de México.
- SEMARNAT . 2016. ProAire 2016-2024. Programa de Gestión para mejorar la Calidad del Aire del Estado de Hidalgo, Secretaria de Medio Ambiente y Recursos Naturales.
- SENER . 2012. Prospectiva del Sector Eléctrico 2012-2026. Secretaría de Energía, Mexico. https://www.gob.mx/cms/uploads/attachment/file/62958/Prospectiva_del_Sector_El_ctrico_2012-2026.pdf.
- SENER . 2018. Prontuario Estadístico 2018. Secretaría de Energía, Mexico. https://www.gob.mx/sener/documentos/prontuario-estadistico-2018.
- Sheinbaum, C. , B. J. Ruiz , and L. Ozawa . 2011. Energy consumption and related CO2 emissions in five Latin American countries: Changes from 1990 to 2006 and perspectives. Energy 36 (6):3629–38. doi:10.1016/j.energy.2010.07.023.
- Sosa, G. , E. Vega , E. González-Avalos , V. Mora , and D. López-Veneroni . 2013. Air pollutant characterization in Tula Industrial Corridor, Central Mexico, during the MILAGRO study. Biomed. Res. Int. 2013:1–13. doi:10.1155/2013/521728.
- US EIA (Energy Information Administration) . 2013. Power plant emissions of sulfur dioxide and nitrogen oxides continue to decline in 2012. http://www.eia.gov/todayinenergy/detail.cfm?id=10151.
- US-EPA . 2010. AP-42 Volume I. Chapter 1: External combustion sources. 5th ed.
- US-EPA . 2019. CMAQ, US EPA office of research and development. doi:10.5281/zenodo.1079878.