
 ?Mathematical formulae have been encoded as MathML and are displayed in this HTML version using MathJax in order to improve their display. Uncheck the box to turn MathJax off. This feature requires Javascript. Click on a formula to zoom.
ABSTRACT
The air quality in cities in Kazakhstan has been poorly investigated despite the worsening conditions. This study evaluates national air pollution monitoring network data (Total Suspended Particle-TSP, NO2, SO2, and O3) from Kazakhstan cities and provides estimates of excess mortality rates associated with PM2.5 exposure using the Global Exposure Mortality Model (GEMM) concentration-response function. Morbidity rates associated with PM10 exposure were also estimated. Annual average (2015-2017) population-weighted concentrations were Kazakhstan cities was 157, 51, 29, and 41 μg m−3 for TSP, NO2, SO2, and O3 respectively. We estimated a total of 8134 adult deaths per year attributable to PM2.5 (average over 2015–2017) in the selected 21 cities of Kazakhstan. The leading causes of death were ischemic heart disease (4080), stroke (1613), lower respiratory infections (662), chronic obstructive pulmonary disease (434), lung cancer (332). The per capita mortality rate attributable to ambient air pollution (per 105 adults per year) was less than 150 in nine cities, between 150 and 204 in nine cities, and between 276 and 373 in three industrial cities (Zhezkazgan, Temirtau, and Balkhash).
Implications: Quantitative information on the health impacts of air pollution can be useful for decision-makers in Kazakhstan to justify environmental policies and identify policy and funding priorities for addressing air pollution issues. This information can also be useful for policymakers by improving the quality of government-funded environmental reports and strategic documents, as they have many shortcomings in terms of the selection of air quality indicators, identification of priority pollutants, and identification of sources of pollution. This study has high significance due to the lack of data and knowledge in Central Asia, especially Kazakhstan.
Introduction
Air pollutants impact the climate system and hydrological cycle (Ramanathan et al. Citation2001), human health (Cohen et al. Citation2017), and agriculture (Chameides et al. Citation1999). In terms of the human health impact, exposure to ambient air pollution increases mortality and morbidity as a result of increased risk of ischemic heart disease (IHD), cerebrovascular disease, lung cancer (LC), chronic obstructive pulmonary disease (COPD), and lower respiratory infections (LRI) (Cohen et al. Citation2017).
The environmental situation in Kazakhstan has been suffering under the pressure of rapid economic development in recent decades due to the inadequacy of the existing environmental monitoring and control systems (Russell et al. Citation2018). In 2011, the concentrations of the major pollutants PM10, NO2, and SO2 exceeded the European Union (EU) annual limit values in 10 out of 11 selected cities (World Bank Citation2013). The prevalence of COPD in Almaty (largest city of Kazakhstan) was 66.7 per 1000 people, which is 1.8- to 2.1-times higher than that in other post-Soviet countries (e.g., Ukraine and Azerbaijan) and is associated with the poor environmental situation (Nugmanova et al. Citation2018). Public environmental complaints have increased, and some court cases have arisen due to the local authorities’ failure to take necessary measures in the context of environmental safety (Radio Azattyk Citation2018).
Fossil fuel combustion is the main source of air pollution in Kazakhstan, as half of the total energy consumption of Kazakhstan is attributed to coal use (Kerimray et al. Citation2018). A major portion of electricity and heat production (66%) is based on coal burning (Karatayev et al. Citation2017), which emits large quantities of hazardous air pollutants (EIA Citation2019). Kazakhstan ranks second in the world, with per capita coal consumption equal to 157 kg per person in the household sector (Kerimray et al. Citation2017). Transportation is another major source of atmospheric emissions, as almost 63% of passenger cars do not satisfy the requirements of the Euro 4 emission standard (UNDP Citation2017). The quality of oil products is also an issue, with frequent cases of noncompliance with fuel quality standards and the late introduction of Euro 4 standard in 2018 (Kazenergy Citation2017).
Natural sources of air pollution, such as windblown dust and forest fires, can also contribute to the deterioration of the air quality in the cities of Kazakhstan. Dust and sandstorms are distributed unevenly in Kazakhstan, with the southern desert zone of Kazakhstan being more affected by dust storms from the Pre-Aral Karakum, Aralkum, Kyzylkum, and southern Pre-Balkhash deserts mainly in the spring and summer seasons (Issanova and Abuduwaili Citation2017). Rupakheti et al. (Citation2019) suggested that clean continental aerosol is a major aerosol type over Central Asia and Kazakhstan, with a very low contribution of dust storms to the overall aerosol loading in Kazakhstan. This could be because Kazakhstan’s population density is among the lowest in the world (6 people per km2 of land area), and most of its territory is unpopulated, especially in areas with sandy and sandy-loamy soils. The study of the NO2 column in Kazakhstan revealed that NO2 density was significantly lower in rural areas, which account for the majority of Kazakhstan, than in urban areas: by a factor of 4 in the summer and by a factor of 20 in the winter (Darynova et al. Citation2018).
Rupakheti et al. (Citation2019) stated that the highest seasonal aerosol optical depth observed from satellites over Kazakhstan was in summer and that the lowest aerosol optical depth was in winter. The higher seasonal aerosol optical depth in the summer was associated with the lower amount of precipitation, high temperatures leading to photochemical reactions (Filonchyk et al. Citation2019), the formation of secondary aerosols, and the northerly winds transporting dust from the desert areas (Rupakheti et al. Citation2019).
To date, a very limited number of air quality assessment studies have been conducted in Kazakhstan cities. Previous studies have focused on transportation-related emissions in Almaty (Carlsen et al. Citation2013); tropospheric NO2 concentrations from satellite measurements (Darynova et al. Citation2018); benzene, toluene, ethylbenzene and xylene (BTEX) concentrations and ratios in Almaty (Baimatova et al. Citation2016); availability and quality of air pollution data in Kazakhstan (Russell et al. Citation2018); and pollution characterization in Almaty (Nazhmetdinova et al. Citation2018).
The National Hydrometeorological Service of Kazakhstan (Kazhydromet) compares the measured concentrations to the local air quality guidelines, which differ from the international standards (e.g., World Health Organization (WHO), European Union). National air quality monitoring network (NAQMN) data are only rarely used for the analysis of trends, possible sources, and health impacts. In 2013, the World Bank (Citation2013) conducted an assessment of air quality in eleven Kazakhstan cities using 1 year of data from 2011. It was estimated that PM10 and PM2.5 air pollution in the studied cities results in a 1.3 USD billion loss in the national economy due to additional health-care costs (0.9% of the GDP). It was concluded that PM pollution causes approximately 2800 premature deaths annually. However, the Global Burden of Disease Study estimated that 10,064 premature deaths occurred in 2010 as a result of ambient air pollution in Kazakhstan (WHO Citation2015). Ground measurements of PM were not available in many areas of the world (including Kazakhstan) in the Global Burden of Diseases Study 2010; therefore, annual mean PM2.5 estimates were modeled using a combination of estimates from data from satellites, results from the global chemical transport model and ground measurements (Brauer et al. Citation2012). Global Ambient Air Quality Database (WHO Citation2018) does not contain data on PM10 and PM2.5 concentrations in Kazakhstan cities.
The benefits and costs of air quality improvements are often “hidden” due to the lack of information linking air quality with health outcomes and consequent economic costs (Craig, Dragan, and Fimka Citation2015). By having a clear understanding of those links, policymakers can focus on a narrow set of air pollution sources to achieve better improvements in public health (Craig, Dragan, and Fimka Citation2015; Yang et al. Citation2017). Some studies assess the health impacts of ambient air pollution at the city level (Abe and Miraglia Citation2016), while others assess these impacts at the national level (Yang et al. Citation2017) or global level (Rao et al. Citation2012); nevertheless, there is a common agreement in terms of national legislation that the political agendas of countries should prioritize city-level impact assessments. As is the case in Kazakhstan, there is a clear lack of information linking air quality with health outcomes at the city level. Nazhmetdinova et al. (Citation2018) also highlighted the need for further studies on the optimization of the environment and public health in Kazakhstan.
The global exposure mortality model (GEMM) was first introduced by Burnett et al. (Citation2018) for the global estimate of mortality associated with long-term exposure to ambient fine particulate matter. The new GEMM is based on a larger number of cohort studies and a wider range of PM2.5 exposure than the integrated exposure response (IER) functions used in the Global Burden of Disease (GBD) assessment in 2015 (Burnett et al. Citation2018). The IER used in GBD (Citation2015) includes information from nonoutdoor sources (indoor air pollution, active/passive smoking) and assumes equal toxicity per unit dose. The new GEMM relied solely on studies of outdoor PM2.5, including studies of Chinese men with PM2.5 exposures up to 84 μg m−3 (Burnett et al. Citation2018). The global mortality attributable to ambient fine particulate air pollution was estimated to be 8.9 million people (95% CI: 7.5–10.3) using the GEMM, while GBD using IER obtained an estimate of 4 million deaths (in 2015) (Burnett et al. Citation2018). Burnett et al. (Citation2018) concluded that health benefits due to reductions in PM2.5 concentrations were much greater than those identified in previous studies (e.g., GBD Citation2015 Risk Factors Collaborators 2016), particularly in areas with high levels of exposure to PM2.5. The GEMM was recently applied for the assessment of health impacts of ambient air pollution in Tehran (Bayat et al. Citation2019) and Europe (Lelieveld et al. Citation2019). Lelieveld et al. (Citation2019) suggested that the health impacts attributable to ambient air pollution in Europe estimated with the GEMM are substantially higher than previous assessments. The previous study on the health impacts of particulate matter in Kazakhstan conducted by the World Bank (Citation2013) employed exposure-response coefficients reported by Ostro (Citation2004) and covered only four regions of Kazakhstan representing 30% of the total population of the country. This study evaluated the air quality in Kazakhstan cities, developed rankings of the most polluted cities of Kazakhstan and discussed potential sources of emissions contributing to the air pollution in those cities based on the available activity data. Our study aims to provide revised estimates of excess mortality rates associated with PM2.5 exposure by using a novel concentration-response function of the GEMM. This study covers 21 major cities of Kazakhstan with 8.6 million population from the total 17.9 million population of Kazakhstan (in 2017). Large urban cities, administrative centers as well as smaller industrial cities with availability of air quality data were selected in this study. The most populated urban areas and smaller industrial cities were studied, where anthropogenic sources may play a dominant role in air quality deterioration, although no definite conclusion can be made on sources due to the lack of source apportionment studies.
Methodology
National air quality monitoring network (NAQNM)
NAQMN data on air quality were obtained from the Kazhydromet-operated national network of stations. Data are published on a monthly and annual basis in the form of information bulletins on the environmental situation in Kazakhstan. Kazhydromet monitors air quality in 49 cities/towns at 156 observation posts by operating 66 manual sampling, 90 automatic monitoring, and 14 mobile stations (Kazhydromet Citation2018). Kazhydromet monitors 34 different pollutants, including criteria and priority pollutants. Manual measurements of air quality are carried out in three types of “programs”: i) full (four times a day at 01:00, 07:00, 13:00 and 19:00), ii) incomplete (three times a day at 07:00, 13:00 and 19:00), and iii) shortened (two times a day at 07:00 and 13:00).
Kazhydromet used to monitor only TSP levels before the introduction of PM10 and PM2.5 monitoring in 2014. Currently, the number of PM10 and PM2.5 monitoring sites is still insufficient in many cities when compared to the EU standards of the minimum station number according to the population (World Bank Citation2013). There were no PM2.5 measurements in five cities (Temirtau, Taraz, Ust-Kamenogorsk, Taldykorgan, and Kostanay) and in 10 cities there was only one PM2.5 station (Supplementary File, Figure A1). In 21 cities total number of TSP stations was 53, while it was only 27 for PM2.5 stations. There is a small correlation between the measured TSP values and measured PM2.5 values, and cities with the highest TSP levels do not have the highest PM2.5 values (Supplementary File, Fig A.2). This could be due to the different locations of the stations used to measure TSP and PM2.5, as well as the low coverage of the cities with PM2.5 stations, differences in frequency of measurements and applied measurement method. There are differences in the methodology for determining TSP and PM2.5 because TSPs are determined by gravimetric method and PM2.5 by optical method. Location of TSP and PM2.5 stations are different in the cities. As an example, for Almaty, in 2017, the PM2.5 stations were located far from the densely populated city center.
Due to the lack of complete PM10 time series data and inconsistencies in the minimum required a number of measurement points in many cities, the incomplete PM10 concentrations were determined using the PM10/TSP ratio of 0.45 (World Bank Citation2013).
There is considerable temporal and spatial variability in PM2.5/PM10 ratios; for example, their median ranged from 0.4 to 0.8 with a median of 0.65 in the UK (Munir Citation2017), they ranged from 0.18 to 0.86 with a median of 0.58 in Turkey (Tecer et al. Citation2008). The ratio could also vary during the day depending on the source of the emissions, reaching minimum values (0.60– 0.65) in the traffic hours and higher values (0.75–0.85) during the remaining periods in Barcelona (Querol et al. Citation2001). The annual average PM2.5/PM10 values recorded for the entire study period were 0.45 at a roadside site and 0.51 at an urban site in Algeria (Talbi et al. Citation2018). In the urban area of Lanzhou, Northwest China, the annual average PM2.5/PM10 ratio was 0.425, and it was associated with dust emissions from deserts (Filonchyk and Yan Citation2018). Additionally, in Wuhan in Central China, the three-year average PM2.5/PM10 ratio was 0.62 ± 0.22 at the urban site and 0.68 ± 0.31 at the background site, with a maximum value in the winter: 0.75 ± 0.26 at the urban site and 0.80 ± 0.42 at the rural site (Xu et al. Citation2017). Ostro (Citation2004) concluded that the PM2.5/PM10 ratio is 0.50 − 0.65 in urban areas of industrialized nations, and the ratios are likely to be much lower (0.35) in areas impacted by more crustal particles such as arid areas or cities with a significant number of unpaved roads or windy days. In Kazakhstan, there were no previous studies with PM2.5 and PM10 measurements that could be used to calculate the PM2.5/PM10 ratio. Some cities located in sandy areas of Kazakhstan (e.g., Aktau, Atyrau, Kyzylorda), as depicted by Issanova and Abuduwaili (Citation2017), may have lower PM2.5/PM10 ratios, while other densely populated (e.g., Almaty, Nur-Sultan, Shymkent) and industrialized cities (Temirtau, Ust-Kamenogorsk, Karaganda, Pavlodar) may have higher PM2.5/PM10 ratios. Many cities in Kazakhstan have unpaved roads that can also contribute to the coarse fraction. Ostro (Citation2004) suggests that “In the absence of a local measurement of the ratio, a value of 0.65 could be assumed for developed countries and 0.5 for developing countries.” The World Bank (Citation2013) assumed PM2.5/PM10 ratios of 0.35, 0.45, and 0.55 for low, moderate, and high estimates, respectively. In this study, the midpoint estimate of the World Bank (Citation2013) PM2.5/PM10 ratio of 0.45 was assumed with an error of ±22%. Future studies are needed to evaluate the spatial and temporal variations in PM2.5/PM10 in the cities of Kazakhstan.
Study area
In this study, 21 out of the 49 monitored cities/towns were evaluated. They include all administrative regional centers and represented 47% of the total population of Kazakhstan. presents the map with cities, towns, population numbers, location of heavy industries, and coal-fired power plants. Population numbers (from the beginning of 2018) were obtained from the Committee of Statistics of the Ministry of National Economy of the Republic of Kazakhstan (Citation2018a).
Figure 1. Map with cities, population numbers (in thousands), location of heavy industries and coal power plants
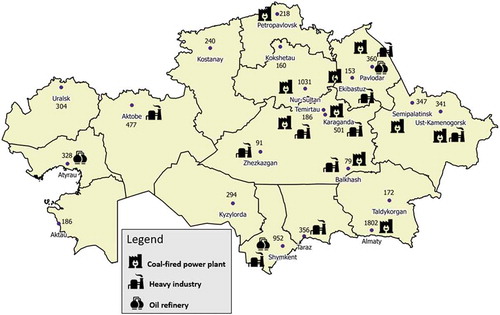
The central, northeastern, and eastern regions of Kazakhstan are centers of heavy industry, accounting for the bulk of energy consumption of the country. In Ust-Kamenogorsk, Zhezkazgan, Balkhash mainly lead, zinc, and copper are produced by the pyrometallurgical method. Ferroalloy plants are located in Aktobe. In Pavlodar, there is aluminum and pipe rolling plant; in Temirtau the largest steel mill is located. In order to provide cheap electricity in those regions (central, northeastern and eastern regions of Kazakhstan), the largest coal-fired power plants are located with the predominant burning of Ekibastuz coal with an ash content of about 40%. Almaty and Nur-Sultan are the most densely populated cities (former and existing capital cities), with the coal power plants. Kostanay, Petropavlovsk and Kokshetau, Taraz are agricultural cities. The cities of Western Kazakhstan and Kyzylorda are oil-producing regions, with oil deposits located at the considerable distance from the selected cities.
Assessment of the health effects
As the greatest quantifiable share of the burden of disease from air pollution comes from PM2.5, it is widely used as a common indicator (WHO Citation2015). The public health impact of PM2.5 and PM10 exposure was estimated using the following steps:
The annual average concentrations of TSP (average for 2015–2017) were taken from NAQNM. PM10 and PM2.5 are fractions of suspended solids, so their concentrations are estimated based on their ratios to TSP (PM10/TSP = 0.45 and PM2.5/PM10 = 0.45) due to the lack of time series data and inconsistencies in the minimum required number of measurement points of PM2.5 and PM10 in the cities of Kazakhstan.
Data on the age-specific population exposed to PM according to the cities of Kazakhstan were taken from the statistical publication “Population of the Republic of Kazakhstan by sex and separate age groups at the beginning of 2018” of the Committee of Statistics of the Ministry of National Economy of the Republic of Kazakhstan (Citation2018a). The age-specific population by regions and by cities were provided in the Supplementary File (Table A1).
Age-specific baseline mortality rates in Kazakhstan by region and city were obtained from the Demographic Yearbook of Kazakhstan of the Committee of Statistics of the Ministry of National Economy of the Republic of Kazakhstan (Citation2018b) (Supplementary File, Table A2). The mortality rates associated with five causes LRI, COPD, LC, IHD, and stroke were obtained from Global Burden of Disease Collaborative Network (Citation2018) (). Share of non-communicable diseases (NCD) was 86% of all deaths (WHO Citation2018). The WHO (Citation2018), in its Noncommunicable Diseases Country Profile for Kazakhstan, states that mortality estimates for Kazakhstan contain a high degree of uncertainty since they are not based on national mortality data. A limitation of this study is the uncertainty of the national mortality data for Kazakhstan.
The concentration-response function of the GEMM (Burnett et al. Citation2018) (based on the Chinese Male Cohort Study) was used to estimate the number of deaths attributable to PM2.5 exposure. Mortality numbers due to NCD and LRI were estimated. In addition, separate estimates of mortality numbers due to the following five causes were estimated: LRI, COPD, LC, IHD, and stroke. For IHD and stroke, age-specific (5-year increments) mortality rates (for adults >25 years) were estimated. For other causes (COPD, LC, and LRI), mortality rates for adults (>25 years) were estimated. The standard error for the θ parameter was obtained from Burnett et al. (Citation2018) (Table A3).
PM10 is associated with morbidity primarily due to chronic bronchitis, lower respiratory illness in children, and other respiratory symptoms. To estimate morbidity rates associated with PM10 exposure, exposure-response coefficients (annual cases per 100,000 people) from international studies (Abbey et al. Citation1995; Ostro Citation1994; World Bank Citation2012) were employed (Table A4). A baseline level (natural background concentration) 15 µg m−3 for PM10 was applied (World Bank Citation2012).
Table 1. Share of mortality rate by cause
The GEMM hazard ratio function (Burnett et al. Citation2018), which describes the association between annual mean concentrations of ambient PM2.5 (denoted as z) and mortality in each age group, is described by EquationEquation 1(1)
(1) :
ϴ, µ, ν and α describe the shape of the mortality-PM2.5 association and were obtained from Burnett et al. (Citation2018).
The number of deaths (ΔY) attributable to air pollution for each city (and age group for IHD and stroke) was estimated using EquationEquation 2(2)
(2) (Bayat et al. Citation2019):
where z is the current PM2.5 concentration by city (from NAQNM), z0 is the target PM2.5 concentration (2.4 μg m−3), Y0 is the age-specific baseline mortality rate by cause, and POP is the age-specific population exposed to air pollution.
Results and discussion
Air quality assessment in the major cities of Kazakhstan
NAQNM data trends of the average annual levels of PM10, NO2, SO2, and O3 concentrations of the cities were analyzed, and they were ranked for the period from 2015 to 2017. Average concentrations were compared with the coal consumption in 2017 according to the Committee of Statistics of the Ministry of National Economy of the Republic of Kazakhstan (Citation2018c) and the number of vehicles in the corresponding region in 2017 according to the Committee of Statistics of the Ministry of National Economy of the Republic of Kazakhstan (Citation2018d). The relationships between the possible sources of emissions and historical variation in each pollutant in the most polluted cities are discussed. NAQNM data were compared with WHO and EU annual limit values (European Commission Citation2019; WHO Citation2005). Annual (2015–2017) population-weighted concentrations in Kazakhstan cities were 157, 51, 29, and 41 μg m−3 for TSP, NO2, SO2 and O3 respectively.
City ranking of air quality and pollution
The results indicate that the annual WHO limit value of 20 µg m−3 for PM10 was not exceeded in only three cities - Kyzylorda, Aktobe, Kostanay (), while the annual EU limit of 40 µg m−3 was not exceeded only in five cities - Kyzylorda, Aktobe, Kostanay, Petropavlovsk, and Kokshetau. The top three polluted cities were the capital, Nur-Sultan, and two industrial cities: Zhezkazgan and Temirtau. Zhezkazgan has one of the largest copper-processing plants in the country (Zhezkazgantsvetmet), while Temirtau is located near the largest steelmaking industrial complex “Arcelor Mittal Temirtau” JSC. There was no significant correlation (R2 = 0.01) between PM10 (2015–2017) and the total coal consumption in the region, which could be due to the effect of the distance to the source and meteorological conditions.
Figure 2. Average annual PM10 concentration between 2015 and 2017 (based on TSP data) and coal consumption in the region
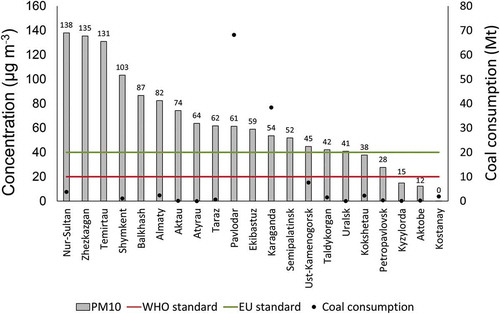
The highest PM10 values are observed in cities (Nur-Sultan, Zhezkazgan, Temirtau, Balkhash, Almaty, etc.), where low-quality coal with high ash content (over 40%) is predominantly burned at the power plants. While in the cities at the East of Kazakhstan (Ust-Kamenogorsk and Semipalatinsk) where better quality coal is used with an ash content of 15–20%, PM10 concentration was significantly lower. There is no coal power plant at Shymkent city, and relatively high PM10 pollution could be caused by the construction industry and diesel vehicles (the city has the highest number of diesel trucks).
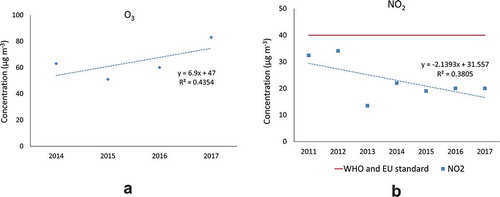
The WHO and EU limit values of 40 µg m−3 for NO2 were exceeded in eight cities (). The top five most polluted cities were Almaty (84 µg m−3), Nur-Sultan (78 µg m−3), Taraz (64 µg m−3), Kyzylorda (56 µg m−3), and Ust-Kamenogorsk (49 µg m−3). Almaty and Nur-Sultan are the most polluted cities, and they are also the most populated cities in the country. NO2 is considered a marker of the number of combustion-related pollutants, particularly those from urban traffic (WHO Citation2005). The coefficient of determination R2 between NO2 and the number of registered passenger cars is 0.21. However, there is still a potentially strong relationship between these factors since the R2 value may significantly increase if other dependent and independent factors are taken into account, such as fleet types, compositions of the registered vehicles, daily mileage, city cycles, and meteorological conditions.
Figure 3. Ranking of the cities by the average level of NO2 (over 2015–2017) and the number of registered cars in the region
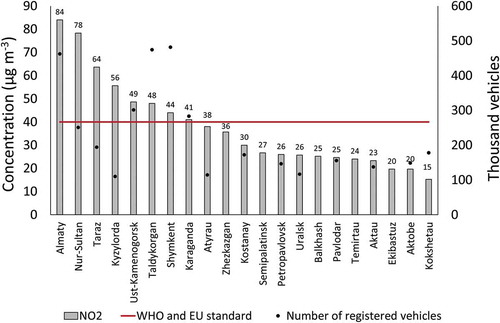
Coal-fired power plants could be another significant contributor of NOx emissions in the cities of Kazakhstan. Cities such as Balkhash and Ekibastuz have a small population with operating coal-fired power plants. Kyzylorda and Taraz cities are characterized with relatively high NO2 concentration (64 and 56 µg m−3, respectively), although there are no heavy industry enterprises and coal power plants in those cities. Transport, household coal combustion, power plants (gas and fuel oil) may contribute to NO2 pollution in Kyzylorda and Taraz, and future studies for source identification are needed.
The five cities with the highest SO2 pollution are Ust-Kamenogorsk (85 µg m−3), Kyzylorda (79 µg m−3), Almaty (50 µg m−3), Balkhash (48 µg m−3), and Temirtau (40 µg m−3) (). The topographical and geographical conditions in Almaty and Ust-Kamenogorsk (location at the foothills of mountains) lead to formation of inversion layers, restricting the vertical dispersion of pollutants, which contribute to severe pollution. High concentrations of SO2 in Ust-Kamenogorsk, Balkhash, Zhezkazgan could be due to the pyrometallurgical processing of sulfide ores. Due to high sulfur content in coal, its combustion is assumed to be the main SO2 source in the country; however, no significant correlation (R2 = 0.02) between SO2 and total coal consumption parameters was identified. This needs further investigation by considering other factors that affect the dispersion of air pollutants.
Figure 4. Ranking of the cities by the average concentration of SO2 (over 2015–2017) and coal consumption in the region
Despite the international practice requiring O3 monitoring in large cities with more than 300 thousand inhabitants (World Bank Citation2013), O3 was measured in only 11 out of the 21 cities considered. The top five most polluted cities were Aktobe (65 µg m−3), Ekibastuz (46 µg m−3), Aktau (45 µg m−3), Ust-Kamenogorsk (44 µg m−3) and Shymkent (43 µg m−3) (). Correlation analysis between O3 data and the number of registered passenger cars revealed no significant correlation (R2 = 0.01).
Figure 5. Ranking of the cities by the average annual concentration of O3 (over 2015–2017) and the number of registered cars in the region
No significant correlation between any data pairs of PM10, NO2, and SO2 concentration levels in Kazakhstan cities was obtained (R2 ≤ 0.1) (Figures A.3–A.5). These results are not very surprising since all cities have significantly different urban dynamics and source compositions.
There are cities located in East Kazakhstan, Pavlodar, and Karaganda regions with metallurgical plants and coal power plants, resulting in complex structure of emissions sources. One example is Ust-Kamenogorsk, where non-ferrous metallurgy enterprises, coal power plants, and coal-fired boiler houses are located.
In Kazakhstan, enterprises are required to receive environmental permit (license for pollution). Applications for environmental permits from enterprises undergo an environmental review at the regional departments of the Ministry of Ecology, Geology and Natural Resources of the Republic of Kazakhstan. Permits for emissions are given with the condition that the content of pollutants at the border of the residential zone and the sanitary protection zone is not higher than the values of the maximum one-time national standards on concentration of air pollutants (Ministry of National Economy of the Republic of Kazakhstan, Citation2015). At the same time the air quality is generally accessed using daily or annual average limit values, which are substantially lower than maximum one-time limits. There are no formal procedures to determine the effect of emissions from an individual enterprise to the average daily pollutant concentration. As an example, according to the dispersion model, the concentration of SO2 did not exceed maximum one-time limit at the border of the sanitary protection zone (formally meeting the requirements of the legislation), while the average daily concentration still may exceed daily limit in the city. Using maximum one-time national limit allows enterprises to increase their quantities of permitted emissions, since formally there is no responsibility for high air pollution in the city. Coal-fired power plants regularly increase permitted levels of air emissions (Department of Ecology of Almaty Citation2015; Department of Ecology of Almaty region Citation2015), which may be one of the main reasons for the high pollution in Almaty, Ust-Kamenogorsk, Nur-Sultan, Pavlodar, etc. Additionally, for power plants as subjects of natural monopolies, discount is applied to their emission charge rates. In 2020, in Kazakhstan new environmental code is expected to be adopted with the new principle of Best Available Technologies (BAT) system. Although it is not yet evident that with the new legislation discounts and easing of some requirements for polluting enterprises will be eliminated.
Pollution trends and potential sources in the most polluted cities
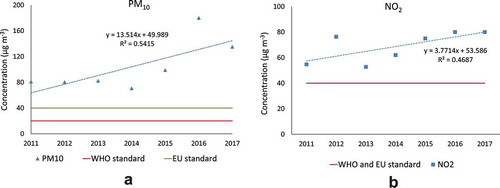
Nur-Sultan is the most polluted city in terms of PM10 (138 µg m−3) and the second most polluted city in terms of NO2 (78 µg m−3). Nur-Sultan has been experiencing dramatic increases in the population and the number of transport vehicles with a very fast urbanization rate after it became the capital in 1997. In 2015, the total primary energy consumption in Nur-Sultan was 22 TWh, of which 70% was attributed to coal that was primarily used for heating or CHP facilities (World Bank Citation2017). The city is still lacking a connection to the gas network and, therefore, has limited gas supplies. According to a household survey, approximately 10% of the total-detached houses use coal for heating (Kerimray et al. Citation2018), which also contributes to the reduction in air quality. Benchmarking of energy consumption in Nur-Sultan revealed that there is a 30–40% energy saving potential; per capita energy consumption in Nur-Sultan in 2015 was 91 GJ (25,200 kWh/capita), which is high compared to that of similar cities (World Bank Citation2017). Its annual average growth rate in PM10 concentration was 14% for the period from 2011 to 2017 (). The annual average PM10 concentration was 135 µg m−3 in 2017, exceeding the limit set by the WHO (20 µg m−3) by 6.8 times and the EU standards (40 µg m−3) by 3.4 times. The average annual NO2 concentration increased from 55 in 2011 to 80 µg m−3 in 2017, exceeding the limit offset by the WHO and the EU standards (40 µg m−3) by two times in 2017. The increasing trends of PM10 and NO2 can be attributed to the rapidly increasing population from 697,000 in 2000 to 973,000 in 2017, which has consequently led to higher energy demand that has been met by unsustainable energy sources (coal, low-quality oil products). The number of registered transport vehicles in the city increased rapidly, with an average annual growth rate of 7.2% for the period from 2011 to 2017.
Figure 6. Trends in average annual concentrations of PM10 (left) and NO2 (right) in Nur-Sultan
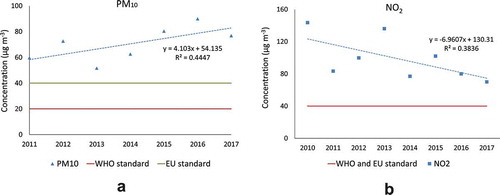
Almaty is the most polluted city in terms of NO2 (annual average concentration 84 µg m−3), the third most polluted city in terms of SO2, is the largest city in the country (former capital) with a population of 1.8 million people and the largest vehicle stock of 463 thousand cars in 2017. Due to the location of the city, the wind speed is slow, which leads to a high level of air pollution. In 2015, the total primary energy consumed in Almaty was 42.4 billion kWh, of which coal, natural gas, and oil products each accounted for approximately 30% (World Bank Citation2017). The efficiency of energy use remains at a low level, as the primary energy consumption per capita in Almaty of 90 GJ (24,907 kWh) in 2015 is high among similar cities in terms of specific annual energy consumption per inhabitant (World Bank Citation2017). The level of losses in the energy transformation and distribution system is nearly the same as the final energy consumption for the entire residential sector in the city (World Bank Citation2017). Household coal consumption is another important source of pollutant emissions, as approximately 7% of the total number of households in Almaty use coal (Kerimray et al. Citation2018).
In Almaty, the annual average growth rate in PM10 concentration was 7% for the period from 2011 to 2017, while the average annual NO2 concentration decreased by an average rate of 4% during the same period (). Decreasing levels of NO2 concentration may be associated with the gradual renewal of vehicle stocks, improved fuel quality, and the few developments in public transport (UNDP Citation2017). The stock of vehicles in Almaty is growing at a significantly lower rate than that in Nur-Sultan, with an annual growth rate of 0.7% (compared to 7.2% in Nur-Sultan). There is a gradual renewal of the stock of vehicles, as the share of vehicles, which do not satisfy the requirements of the Euro 2 standard, has decreased from 38–40% in 2009 to 10–13% in 2017, while the share of vehicles following the Euro 5 class requirements has rapidly increased from 0% in 2009 to 25% in 2017 (The Municipality of Almaty City Citation2018). Additionally, electricity generation at the power plants in Almaty has increased at an annual average rate of 6.3% from 2015 to 2017 (The Municipality of Almaty City Citation2018). The coverage of the city with central heating has increased gradually from 88% in 2015 to 92.5% in 2016–2017 (The Municipality of Almaty City Citation2018).
Figure 7. Trends in average annual concentrations of PM10 (left) and NO2 (right) in Almaty
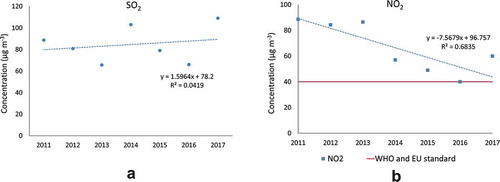
Ust-Kamenogorsk As the center for a heavy industry employing outdated technology coupled with extreme weather conditions, Ust-Kamenogorsk is the most polluted city in terms of SO2 (annual average 85 µg m−3). Ust-Kamenogorsk is a major mining and metallurgical center of the country, producing nonferrous metals, especially zinc, lead, silver, copper, gold, uranium, beryllium, tantalum, and titanium. The SO2 concentration fluctuated widely during the period of 2011–2017 (). Understanding the reasons behind such fluctuations requires further research. The NO2 concentration decreased from 89 μg m−3 in 2011 to 40 µg m−3 in 2016, followed by an increase to 60 µg m−3 in 2017 (exceeding the cutoff values of the WHO and EU by 1.5 times). The Municipality of East Kazakhstan Region (Citation2018) also reported that the air pollution index (API) of cities with high levels of air pollution was “9.” The API is calculated as the average concentration of various pollutants divided by the maximum permissible concentration and adjusted for the harmfulness of sulfur dioxide. Its high levels of air pollution can be explained by i) metallurgy industry facilities and CHP plants; ii) low levels of wind speed; iii) transport relying mainly on gasoline and aged vehicles stock (78% of cars more than 10 years old).
Figure 8. Average annual concentrations of PM10 (left) and NO2 (right) in Ust-Kamenogorsk
Aktobe is the most polluted city in terms of O3 (65 µg m−3). Aktobe is an industrial city with factories making ferroalloys and chromium compounds. Ozone is produced as a result of a complex set of reactions that involve volatile organic compounds (VOCs) and nitrogen oxides (NOx). Heavy industry facilities could be potential sources of VOCs. The concentration of O3 increased from 51 µg m−3 in 2015 to 83 µg m−3 in 2017 (). The concentration of NO2 in Aktobe is below the WHO and EU cutoff values. The Municipality of Aktobe Region (Citation2017) reported that flaring of petroleum gas is a major environmental challenge in the region, as it accounted for 23% of the total emissions from stationary sources. Electricity consumption in the Aktobe region increased at an annual rate of 7% from 2012 to 2016 (The Municipality of Aktobe Region Citation2017). The city is provided with gas via the gas network; therefore, heat and power generation rely on gas. The only source of district heating is “Aktobe CHP,” which relies on natural gas and petroleum gas. The annual growth rate in the number of registered transport vehicles in the Aktobe region was 3.5% during the period from 2011 to 2017, reaching 149 thousand in 2017.
Figure 9. Average annual concentration level of O3 (left) and NO2 (right) in Aktobe
Estimated health impacts of exposure to PM2.5 and PM10 in the major cities of Kazakhstan
The results presented here demonstrate that exposure to PM10 in the major cities of Kazakhstan caused 3249 new cases of chronic bronchitis, 5991 hospital admissions, and 117,317 emergency room visits annually in the period from 2015 to 2017 (). The World Bank (Citation2013) estimated three-times lower morbidity levels in Kazakhstan in 2011 in four selected regions: 1016 cases of chronic bronchitis, 2040 cases of hospital admissions, 40,400 cases of emergency room visits, 6,712,000 restricted activity days, 92,100 lower respiratory illnesses in children and 21,364,000 respiratory symptoms. Annually, the number of per-capita (adults) restricted activity days was 3.8 and the number of per-capita respiratory symptoms was 11.9.
Table 2. Additional morbidity cases due to exposure to PM10 in the major cities (annually over the 2015–2017)
It was estimated a total of 8134 adult (age ≥25 years) deaths attributable to PM2.5 per year (average over 2015–2017) (). The leading causes of death were ischemic heart disease (4080), stroke (1613), lower respiratory infections (662), chronic obstructive pulmonary disease (434), lung cancer (332) (; Supplementary File: Table A6, Table A7). In average across the cities of Kazakhstan, per capita mortality rate attributable to ambient air pollution is 165 per 105 adults per year, which is higher than in Europe (133 per 105 for all ages) (Lelieveld et al. Citation2019) and Tehran (118 deaths per 105 adults) (Bayat et al. Citation2019). In Tehran, percentage of deaths attributable to PM2.5 was 15.3% of total deaths, with pollution level of 31 μg m−3. In Atyrau (Kazakhstan) having similar pollution (29 μg m−3), this indicator was estimated at 15%.
Table 3. Additional NCD+LRI mortality cases by age ranges due to exposure to PM2.5 in the major cities of Kazakhstan (annually over the 2015–2017) (SE-standard error; SE for parameter obtained from Burnett et al. Citation2018)
Table 4. Additional COPD, LC, LRI, IHD, and stroke mortality cases due to exposure to PM2.5 in the major cities of Kazakhstan (annually over the 2015–2017)
Previously World Bank (Citation2013) estimated 2800 premature deaths due to particulate matter pollution in 2011 in four selected regions Karaganda region, East Kazakhstan region, Almaty region, and Pavlodar region (representing 30% of total population). The WHO GBD study estimated that 10,064 premature deaths occurred due to particulate matter pollution in 2010 in Kazakhstan (WHO Citation2015) (62 per 105 population) using integrated exposure-response functions. Estimated deaths were not presented by cause in the WHO (Citation2015) data. These differences in the estimates could be attributed to worsening air quality levels with elapsed time as well as differences in target concentration, applied exposure-response methodology, and hazard ratios (this study applied a novel GEMM), as well as the coverage of the exposed population.
The per-capita mortality rate attributable to ambient air pollution varied across the cities, from 34 to 373 per 105 adults (), due to the differences in the baseline mortality rates and PM2.5 concentrations. Differences in the per-capita baseline mortality rate across cities may be attributed to many factors, such as air pollution, economy, lifestyle, poverty rates, and the availability of health-care services. Attributable to ambient air pollution mortality rate (per 105 adults per year) was less than 150 in nine cities, between 150 and 204 in nine cities, and between 276 and 373 in three cities. Three cities with heavy industries and coal-fired power generation, namely Zhezkazgan, Temirtau, and Balkhash had highest PM2.5 mortality rate: 276–373 per 105 adults ( and ). These industrial cities also had baseline mortality rate among adults of 1494 per 105 which is higher than the average baseline mortality rate among adults across all studied cities (1129 per 105 adults). This could be a consequence of air pollution with heavy metals (lead, zinc, iron) and requires future investigation.
Figure 10. Mortality rate attributable to ambient air pollution (per 105 adults) by cities of Kazakhstan
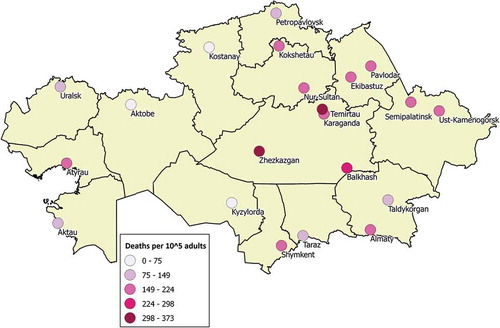
The percentage of PM2.5 mortality from total adults deaths was varying from the lowest 3% to 26%, with more than 20% in four most polluted cities: Nur-Sultan (25%), Zhezkazgan (25%), Temirtau (24%), and Shymkent (21%) ().
Table 5. Characteristics of the cities and estimated PM2.5 mortality
Conclusion
Using the data from monitoring stations, this study revealed that air quality is poor in the majority of the large cities in Kazakhstan. In 18 (out of 21) of the cities studied, the annual limit value of the WHO for PM10 was exceeded. In terms of NO2 concentration, the WHO limit was exceeded in eight cities. Nur-Sultan, Almaty, Ust-Kamenogorsk, and Aktobe were the most polluted cities in terms of PM10, NO2, SO2 and O3, respectively. The rapidly growing Nur-Sultan (capital of Kazakhstan) had increasing trends of PM10 and NO2, with annual average PM10 concentrations (2015–2017) reaching 135 µg m−3 (exceeding the WHO annual limit by a factor of 6.9). The largest city of Kazakhstan and former capital, Almaty, had decreasing levels of NO2, possibly because of developments in the transport sector; however, the values still exceeded the WHO annual limit by a factor of 2.1 (on average from 2015 to 2017). Ust-Kamenogorsk, with heavy industry and coal power plants, was the most polluted city in terms of SO2 (85 µg m−3), with fluctuating trends from 2011 to 2017. The concentration of O3 increased in the industrial Aktobe from 51 µg m−3 in 2015 to 83 µg m−3 in 2017. The linear correlation of the average annual concentration of pollutants with total coal consumption or the number of registered vehicles in the region were small, which can be associated with many factors, including the resolution and inaccuracies of the data used, the influence of meteorological and terrain conditions, and distribution and transportation factors between the source and receptor. Understanding sources of pollution requires future research with source apportionment and air quality modeling in the polluted cities of Kazakhstan.
It is estimated that exposure to inhalable particles in the major cities of Kazakhstan causes 8134 adult premature deaths annually. Differences in the cities were vast as per capita mortality rate attributable to ambient air pollution was varying from 34 to 373 per 105 adults per year due to the differences in the PM2.5 concentration and baseline mortality rates. Three industrial cities Zhezkazgan, Temirtau, and Balkhash had higher per capita PM2.5 mortality rate compared to the other cities.
Government intervention measures to control or reduce atmospheric pollution in Kazakhstan can lead to significant benefits to society in terms of reducing negative health impacts.
The National Hydrometeorological Service of Kazakhstan is still in its development, as the number of measurement stations and priority pollutant coverage is gradually improving. In this study, to estimate health impacts, data on total suspended particles were used due to the low coverage of the PM2.5 network for the historical period from 2015 to 2017. Health impacts need to be recalculated with measured PM2.5 data when the PM2.5 data become available with sufficient coverage in the cities of Kazakhstan.
Supplemental Material
Download MS Word (114.4 KB)Acknowledgment
The authors thank Reza Bayat for providing valuable comments to the paper.
Disclosure statement
No potential conflict of interest was reported by the authors.
Supplementary material
Supplemental data for this article can be accessed on the publisher’s website.
Additional information
Funding
Notes on contributors
Aiymgul Kerimray
Aiymgul Kerimray is a Postdoctoral Researcher at Al-Farabi Kazakh National University, Center of Physical-Chemical Methods of Research and Analysis, Almaty, Kazakhstan.
Daulet Assanov
Daulet Assanov is a Senior Researcher Excellence Center “Veritas,” D. Serikbayev East Kazakhstan State Technical University, Ust-Kamenogorsk, Kazakhstan.
Bulat Kenessov
Bulat Kenessov is a Professor, Director of the Center of Physical-Chemical Methods of Research and Analysis at Al-Farabi Kazakh National University, Almaty, Kazakhstan.
Ferhat Karaca
Ferhat Karaca is Associate Professor at the Department of Civil and Environmental Engineering at Nazarbayev University, Nur-Sultan, Kazakhstan.
References
- Abbey, D. E., B. E. Ostro, F. Petersen, and R. J. Burchette. 1995. Chronic respiratory symptoms associated with estimated long-term ambient concentrations of fine particulates less than 2.5 microns in aerodynamic diameter (PM2.5) and other air pollutants. J. Expo. Anal. Environ. Epidemiol. 5 (2):137–59.
- Abe, K. C., and S. G. Miraglia. 2016. Health impact assessment of air pollution in São Paulo, Brazil. Int. J. Environ. Res. Public Health 13 (7):694. doi:10.3390/ijerph13070694.
- Aiman, N., S. Gulnaz, and M. Alena. 2018. The characteristics of pollution in the big industrial cities of Kazakhstan by the example of Almaty. J. Environ. Health Sci. Eng. 16 (1):81–88. doi:10.1007/s40201-018-0299-1.
- Azattyk, R. 2018. Lawyer requires municipality actions to combat smog. Accessed January, 2019. https://rus.azattyq.org/a/kazakhstan-almaty-ilyashev-smog/29677059.html.
- Baimatova, N., B. Kenessov, J. A. Koziel, L. Carlsen, M. Bektassov, and O. P. Demyanenko. 2016. Simple and accurate quantification of BTEX in ambient air by SPME and GC-MS. Talanta 154:46–52. doi:10.1016/j.talanta.2016.03.050.
- Bayat, R., K. Ashrafi, M. Shafiepour Motlagh, M. S. Hassanvand, R. Daroudi, G. Fink, and N. Künzli. 2019. Health impact and related cost of ambient air pollution in Tehran. Environ. Res. 176:108547. doi:10.1016/j.envres.2019.108547.
- Brauer, M., M. Amann, R.T. Burnett, A. Cohen, F. Dentener, M. Ezzati, S. B. Henderson, M. Krzyzanowski, R.V. Martin, R.V. Dingenen et al. 2012. Exposure assessment for estimation of the global burden of disease attributable to outdoor air pollution. Environ. Sci. Technol. 46 (2):652–60. doi:10.1021/es2025752.
- Burnett, R., H. Chen, M. Szyszkowicz, N. Fann, B. Hubbell, C. A. Pope 3rd, J. S. Apte, M. Brauer, A. Cohen, S. Weichenthal, et al. 2018. Global estimates of mortality associated with long-term exposure to outdoor fine particulate matter. Proc. Natl. Acad. Sci. U S A 115 (38):9592–97. doi:10.1073/pnas.1803222115.
- Carlsen, L., N. K. Baimatova, B. N. Kenessov, and O. A. Kenessova. 2013. Assessment of the air quality of almaty. Focussing on the traffic component. Int. J. Biol. Chem 5 (1):49–69.
- Chameides, W. L., H. Yu, S. C. Liu, M. Bergin, X. Zhou, L. Mearns, G. Wang, C. S. Kiang, R. D. Saylor, C. Luo, et al. 1999. Case study of the effects of atmospheric aerosols and regional haze on agriculture: an opportunity to enhance crop yields in China through emission controls? Proc. Natl. Acad. Sci. 96 (24):13626–33. doi:10.1073/pnas.96.24.13626.
- Cohen, A. J., M. Brauer, R. Burnett, H. R. Anderson, J. Frostad, K. Estep, K. Balakrishnan, B. Brunekreef, L. Dandona, R. Dandona, et al. 2017. Estimates and 25-year trends of the global burden of disease attributable to ambient air pollution: an analysis of data from the global burden of diseases study 2015. Lancet 389 (10082):1907–18. doi:10.1016/s0140-6736(17)30505-6.
- Committee of Statistics of the Ministry of National Economy of the Republic of Kazakhstan. 2018a. Statistical publication. Population of the republic of Kazakhstan by sex and individual age groups at the beginning of the year. Accessed January, 2018. http://stat.gov.kz/getImg?id=ESTAT259817.
- Committee of Statistics of the Ministry of National Economy of the Republic of Kazakhstan. 2018b. Statistical publication. Demographic yearbook of Kazakhstan. Accessed September 20, 2019. http://old.stat.gov.kz/getImg?id=ESTAT280195.
- Committee of Statistics of the Ministry of National Economy of the Republic of Kazakhstan. 2018c. Statistical publication. Fuel-energy balance of the republic of Kazakhstan 2013–2017. Accessed September, 2019. http://old.stat.gov.kz/getImg?id=ESTAT282938.
- Committee of Statistics of the Ministry of National Economy of the Republic of Kazakhstan. 2018d. Official statistics. Availability of cars. Accessed December, 2018. http://stat.gov.kz/getImg?id=ESTAT099960.
- Craig, M., G. Dragan, and T. Fimka. 2015. Estimating health impacts and economic costs of air pollution in the republic of Macedonia. South East. Eur. J. Public Health (SEEJPH). doi:10.4119/seejph-1809.
- Darynova, Z., A. Maksot, L. Kulmukanova, M. Malekipirbazari, H. Sharifi, M. Torkmahalleh, and T. Holloway. 2018. Evaluation of NO2 column variations over the atmosphere of Kazakhstan using satellite data. J. Appl. Remote Sens. 12 (4):1. doi:10.1117/1.JRS.12.042610.
- Department of Ecology of Almaty. 2015. The conclusion of the state environmental review on the project “adjustment of the standards for maximum permissible emissions (MPE) in the atmospheric air for the department of JSC ALES CHP-2”.
- Department of Ecology of Almaty region. 2015. State environmental review report on “adjustment of the draft standards for maximum permissible emissions (MPE) of JSC ALES CHP-3 for 2015–2024” in the Almaty region.
- EIA. 2019. Coal and the environment. Accessed November, 2018. https://www.eia.gov/energyexplained/index.php?page=coal_environment.
- European Commission. 2019. Air quality standards. Accessed May, 2020. https://ec.europa.eu/environment/air/quality/standards.htm.
- Filonchyk, M., and H. Yan. 2018. The characteristics of air pollutants during different seasons in the urban area of Lanzhou, Northwest China. Environ. Earth Sci. 77 (22):763. doi:10.1007/s12665-018-7925-1.
- Filonchyk, M., H. Yan, Z. Zhang, S. Yang, W. Li, and Y. Li. 2019. Combined use of satellite and surface observations to study aerosol optical depth in different regions of China. Sci. Rep. 9 (1):6174. doi:10.1038/s41598-019-42466-6.
- GBD. 2015. Risk factors collaborators. 2016. Global, regional, and national comparative risk assessment of 79 behavioural, environmental and occupational, and metabolic risks or clusters of risks, 1990-2015: a systematic analysis for the global burden of disease study 2015. Lancet 388 (10053):1659–724. doi:10.1016/s0140-6736(16)31679-8.
- Global Burden of Disease Collaborative Network (2018)”. Global Burden of Disease Study 2017. Share of mortality rate by cause. Retrieved from Institute for Health Metrics and Evaluation (IHME) website: https://ind01.safelinks.protection.outlook.com/?url=https%3A%2F%2Fvizhub.healthdata.org%2Fgbd-compare%2Farrow&data=02%7C01%7Cdheenbala.palani%40integra.co.in%7C69ba60db42cd4b47304508d853fe229d%7C70e2bc386b4b43a19821a49c0a744f3d%7C0%7C0%7C637351698272022795&sdata=hUAIXYYt%2FPERBtTM65nsnhnnuZLFk5hkDRVxMP8OJa8%3D&reserved=0.
- Issanova, G., and J. Abuduwaili. 2017. Erratum to: Aeolian processes as dust storms in the deserts of central asia and Kazakhstan. In Aeolian processes as dust storms in the deserts of central asia and Kazakhstan, ed. G. Issanova and J. Abuduwaili (pp. 87). E1. Singapore: Springer Singapore.
- Karatayev, M., P. Rivotti, Z. Sobral Mourão, D. D. Konadu, N. Shah, and M. Clarke. 2017. The water-energy-food nexus in Kazakhstan: challenges and opportunities. Energy Procedia 125:63–70. doi:10.1016/j.egypro.2017.08.064.
- Kazenergy. 2017. The national energy report 2017. Accessed December, 2018. https://www.kazenergy.com/upload/document/energy-report/National_Energy_Report-ENGLISH_03.09.pdf.
- Kazhydromet. 2018. Information bulletin on the state of the environment of the Republic of Kazakhstan. Accessed November, 2018. https://kazhydromet.kz/ru/bulleten/okrsreda.
- Kerimray, A., L. Rojas-Solórzano, M. Amouei Torkmahalleh, P. K. Hopke, and B. P. Ó. Gallachóir. 2017. Coal use for residential heating: patterns, health implications and lessons learned. Energy Sustain. Dev. 40:19–30. doi:10.1016/j.esd.2017.05.005.
- Kerimray, A., R. De Miglio, L. Rojas-Solórzano, and B. P. Ó. Gallachóir. 2018. Causes of energy poverty in a cold and resource-rich country: evidence from Kazakhstan. Local Environ. 23 (2):178–97. doi:10.1080/13549839.2017.1397613.
- Lelieveld, J., K. Klingmüller, A. Pozzer, U. Pöschl, M. Fnais, A. Daiber, and T. Münzel. 2019. Cardiovascular disease burden from ambient air pollution in Europe reassessed using novel hazard ratio functions. Eur. Heart J. 40 (20):1590–96. doi:10.1093/eurheartj/ehz135.
- Ministry of national economy of the Republic of Kazakhstan. 2015. Order of the minister. About the approval of Hygienic standards for atmospheric air in urban and rural settlements.
- Munir, S. 2017. Analysing temporal trends in the ratios of PM2.5/PM10 in the UK. Aerosol Air Qual. Res. 17 (1):34–48. doi:10.4209/aaqr.2016.02.0081.
- Nazhmetdinova A., Sarmanbetova G., Magai A. 2018. The characteristics of pollution in the big industrial cities of Kazakhstan by the example of Almaty. J Environ Health Sci Eng. 16 (1):81–88. doi:10.1007/s40201-018-0299-1.
- Nugmanova, D., Y. Feshchenko, L. Iashyna, O. Gyrina, K. Malynovska, E. Mammadbayov, I. Akhundova, N. Nurkina, L. Tariq, J. Makarova, et al. 2018. The prevalence, burden and risk factors associated with chronic obstructive pulmonary disease in commonwealth of independent states (Ukraine, Kazakhstan and Azerbaijan): results of the CORE study. BMC Pulm. Med. 18 (1):26. doi:10.1186/s12890-018-0589-5.
- Ostro, B. 1994. Estimating the health effects of air pollution: a method with an application to Jakarta. Policy research working paper No. 1301. Accessed March, 2019. http://documents.worldbank.org/curated/en/355391468752348015/pdf/multi0page.pdf.
- Ostro, B. 2004. Outdoor air pollution. Assessing the environmental burden of disease at national and local levels. Environmental burden of disease series. Accessed December, 2018. http://apps.who.int/iris/bitstream/handle/10665/42909/9241591463.pdf?sequence=1&isAllowed=y.
- Querol, X., A. Alastuey, S. Rodriguez, F. Plana, C. R. Ruiz, N. Cots, G. Massagué, and O. Puig. 2001. PM10 and PM2.5 source apportionment in the Barcelona Metropolitan area, Catalonia, Spain. Atmos. Environ. 35 (36):6407–19. doi:10.1016/S1352-2310(01)00361-2.
- Ramanathan, V., P. J. Crutzen, J. T. Kiehl, and D. Rosenfeld. 2001. Aerosols, climate, and the hydrological cycle. Science 294 (5549):2119–24. doi:10.1126/science.1064034.
- Rao, S., V. Chirkov, F. Dentener, R. Van Dingenen, S. Pachauri, P. Purohit, M. Amann, C. Heyes, P. Kinney, P. Kolp, et al. 2012. Environmental modeling and methods for estimation of the global health impacts of air pollution. Environ. Model. Assess 17 (6):613–22. doi:10.1007/s10666-012-9317-3.
- Rupakheti, D., S. Kang, M. Bilal, J. Gong, X. Xia, and Z. Cong. 2019. Aerosol optical depth climatology over Central Asian countries based on Aqua-MODIS collection 6.1 data: Aerosol variations and sources. Atmos. Environ. 207:205–14. doi:10.1016/j.atmosenv.2019.03.020.
- Russell, A., M. Ghalaieny, B. Gazdiyeva, S. Zhumabayeva, A. Kurmanbayeva, K. K. Akhmetov, Y. Mukanov, M. McCann, M. Ali, A. Tucker, et al. 2018. A spatial survey of environmental indicators for Kazakhstan: an examination of current conditions and future needs. Int. J. Environ. Res. 12 (5):735–48. doi:10.1007/s41742-018-0134-7.
- Talbi, A., Y. Kerchich, R. Kerbachi, and M. Boughedaoui. 2018. Assessment of annual air pollution levels with PM1, PM2.5, PM10 and associated heavy metals in Algiers, Algeria. Environ. Pollut. 232:252–63. doi:10.1016/j.envpol.2017.09.041.
- Tecer, L. H., P. Süren, O. Alagha, F. Karaca, and G. Tuncel. 2008. Effect of meteorological parameters on fine and coarse particulate matter mass concentration in a coal-mining area in Zonguldak, Turkey. J. Air Waste Manag. Assoc 58 (4):543–52. doi:10.3155/1047-3289.58.4.543.
- The Municipality of Aktobe Region. 2017. Development program of the territory of the Aktobe region 2016–2020. Accessed January, 2019. http://newsite.aktobe.gov.kz/?q=ru.
- The Municipality of Almaty City. 2018. Development program “Almaty-2020”. Accessed November, 2018. https://almaty.gov.kz/page.php?page_id=3239&lang=1.
- The Municipality of East Kazakhstan Region. 2018. Development program of the territory of the East Kazakhstan region for 2016–2020. Accessed November, 2018. http://www.akimvko.gov.kz/ru/ekonomika/regionalnyie-programmyi.html.
- UNDP. 2017. Sustainable transport of Almaty. Accessed January, 2019. https://alatransit.kz/sites/default/files/finalnyy_otchet.pdf.
- WHO. 2005. WHO Air quality guidelines for particulate matter, ozone, nitrogen dioxide and sulfur dioxide. Accessed January, 2019. https://apps.who.int/iris/bitstream/handle/10665/69477/WHO_SDE_PHE_OEH_06.02_eng.pdf?sequence=1.
- WHO. 2015. Economic cost of the health impact of air pollution in Europe. Accessed February, 2019 http://www.euro.who.int/__data/assets/pdf_file/0004/276772/Economic-cost-health-impact-air-pollution-en.pdf.
- WHO. 2018. WHO global ambient air quality database (update 2018). Accessed December, 2018. https://www.who.int/airpollution/data/cities/en/.
- World Bank. 2012. Improving industrial competitiveness through potential of cleaner and greener production. Accessed May, 2020. http://documents.worldbank.org/curated/en/358001468040462059/Modern-companies-healthy-environment-improving-industrial-competitiveness-through-potential-of-cleaner-and-greener-production.
- World Bank. 2013. Towards cleaner industry and improved air quality monitoring in Kazakhstan. Accessed January, 2019. http://documents.worldbank.org/urated/en/132151468047791898/pdf/839150WP0P133300Box0382116B00OUO090.pdf.
- World Bank. 2017. Municipal energy efficiency plan for the city of Almaty. Accessed January, 2019. https://openknowledge.worldbank.org/bitstream/handle/10986/28927/121463-ESM-P130013-PUBLIC-KEEPAlmatyEEPlanNovengfinal.pdf?sequence=1&isAllowed=y.
- Xu, G., L. Jiao, B. Zhang, S. Zhao, M. Yuan, Y. Gu, J. Liu, and X. Tang. 2017. Spatial and temporal variability of the PM2.5/PM10 ratio in Wuhan, Central China. Aerosol and Air Quality Research 17 (3):741–51. doi:10.4209/aaqr.2016.09.0406.
- Yang, B. Y., Y. Liu, L. W. Hu, X. W. Zeng, and G. H. Dong. 2017. Urgency to assess the health impact of ambient air pollution in China. Adv. Exp. Med. Biol. 1017:1–6. doi:10.1007/978-981-10-5657-4_1.