
 ?Mathematical formulae have been encoded as MathML and are displayed in this HTML version using MathJax in order to improve their display. Uncheck the box to turn MathJax off. This feature requires Javascript. Click on a formula to zoom.
ABSTRACT
Pig production systems in China are shifting from small to industrial scale. Significant variation in housing ammonia (NH3) emissions can exist due to differences in diet, housing design, and management practices. However, there is a knowledge gap regarding the impacts of farm-scale in China, which may be critical in identifying hotspots and mitigation targets. Here, continuous in-situ NH3 concentration measurements were made at pig farms of different scales for sows and fattening pigs over periods of 3–6 days during two different seasons (summer vs. winter). For the sow farms, NH3 emission rates were greater at the small farm (summer: 0.52 g pig−1 hr−1; winter: 0.21 g pig−1 hr−1) than at the large farm (summer: 0.34 g pig−1 hr−1; winter: 0.12 g pig−1 hr−1). For the fattening pig farms, NH3 emission rates were greater at the large farm (summer: 0.22 g pig−1 hr−1; winter: 0.16 g pig−1 hr−1) than at the small farm (summer: 0.19 g pig−1 hr−1; winter: 0.07 g pig−1 hr−1). Regardless of farm scale, the NH3 emission rates measured in summer were greater than those in winter; the NH3 emission rates were greater in the daytime than at the nighttime; a positive relationship (R2 = 0.06–0.68) was established between temperature and NH3 emission rate, whereas a negative relationship (R2 = 0.10–0.47) was found between relative humidity and NH3 emission rate. The effect of farm-scale on indoor NH3 concentration could mostly be explained by the differences in ventilation rates between farms. The diurnal variation in NH3 concentration could be partly explained by ventilation rate (R2 = 0.48–0.78) in the small traditional farms and by emission rate (R2 = 0.26–0.85) in the large industrial farms, except for the large fattening pig farm in summer. Overall, mitigation of NH3 emissions from sow farms should be a top priority in the North China Plain.
Implications: The present study firstly examined the farm-scale effect of ammonia emissions in the North China Plain. Of all farms, the sow farm was identified as the greatest source of ammonia emission. Regardless of farm scale, ammonia emission rates were observed to be higher in summer. Ammonia concentrations were mostly higher in the large industrial farms partly due to lower ventilation rates than in the small traditional farms.
Introduction
China has experienced severe and persistent particulate pollution in recent years (Huang et al. Citation2014). A recent study indicated that severe haze in Northern China causes a loss in life expectancy of up to five years on average (Chen et al. Citation2013). Atmospheric ammonia (NH3) contributes to aerosol formation through the secondary creation of fine particulate matter (PM2.5) after combining with other atmospheric pollutants, including nitrates and sulfates (Wu et al. Citation2016). Reducing NH3 emissions is, therefore, an effective approach to decrease PM2.5 concentrations.
China is the largest source of NH3 emissions (from 8.2 to 15.6 Tg N yr−1) in the world (Kang et al. Citation2016; Zhang et al. Citation2017), with the North China Plain being the largest hotspot (Pan et al. Citation2018). Agricultural sources, with livestock housing and manure management in particular, are the most significant contributors to NH3 emissions (Bai et al. Citation2017, Citation2016), with pig housing being an important component (Paulot et al. Citation2014). To accurately identify emission hotspots and devise effective NH3 mitigation techniques applicable to pig housing, an accurate estimate of NH3 emission rates is needed. However, current NH3 emission factors proposed for pig housing in China are mainly based on European and American research. These emission factors may not accurately reflect emissions from China because substantial variation can exist between countries (Koerkamp et al. Citation1998) arising from differences in diet, housing, pig breed, and management practices (Lin et al. Citation2017; Paulot et al. Citation2014). Therefore, accurate NH3 emission rates, reflecting local pig production systems and the environmental conditions in China must be obtained.
The structure of pig production is changing in China. Although the small traditional pig farms still represent a significant share of total pig production, the large industrial pig farms are accounting for a rapidly growing proportion (Bai et al. Citation2014). Pig farms of different scales differ in their diet, housing system design, indoor climate, and management, all of which will influence NH3 emissions (Koerkamp et al. Citation1998). Published information suggests that: i) lowering dietary crude protein content decreases the excretion of urinary N, which is easily converted into NH3 by the urease present in feces (Canh et al. Citation1998); ii) urine drains quickly from slatted floors via the openings, limiting the fouled area (Svennerstedt Citation1999) and thereby lowering NH3 emissions (Hou, Velthof, and Oenema Citation2015); iii) greater emissions from mechanical-ventilated housing in comparison with natural-ventilated housing, can be partly explained by the higher temperature inside the former (Gallmann, Hartung, and Jungbluth Citation2003); iv) NH3 emissions are positively related to temperature but negatively to relative humidity (Philippe, Cabaraux, and Nicks Citation2011). Therefore, NH3 emissions are highly likely to vary depending on the farm scale. While several studies concerning NH3 emissions and concentrations from pig housing have been reported for China (Dong et al. Citation2009; Wang et al. Citation2011; Xu et al. Citation2014; Zhu et al. Citation2006a, Citation2006b), to date these have not addressed potential impacts of farm scale and the underlying factors.
The primary objective of this study was to characterize the variability in NH3 emissions with respect to sow and fattening pig farms of different scales and their temporal variations in the North China Plain. Potential reasons behind the effects of farm scale were also investigated, including feed intake and nitrogen content, ventilation, floor design, manure removal system, and microclimatic conditions. These data will contribute to the baseline information on farm-scale NH3 emissions from pig farms in China, and such information is important for identifying emission hotspots and exploring effective mitigation techniques.
Materials and methods
Description of the experimental sites
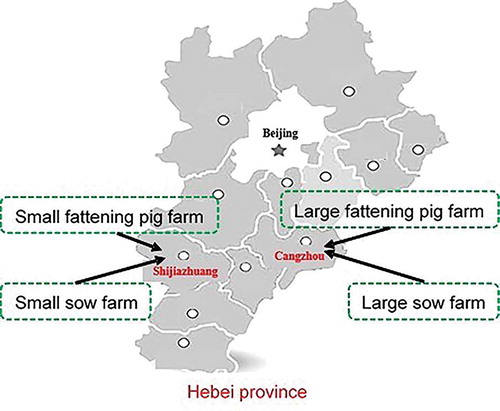
Four pig farms, representative of the different-scale pig production facilities in the North China Plain, were selected for NH3 emission measurements over two seasons (summer: August to September; winter: January to March). Two farms were large industrial pig farms (a total holding capacity of ~6000 sows and ~2,000 fattening pigs, respectively, from Cangzhou City, Hebei Province), and two were small traditional pig farms (a total holding capacity of ~30 sows and ~50 fattening pigs, respectively, from Shijiazhuang City, Hebei Province) (). Basic information regarding pigs, feed, housing design, and manure removal system for each farm are given in and Appendix A.
Table 1. Description of the pigs, feed, and housing system related to four pig farms; mean ± standard deviation
Figure 1. The location of the selected four pig farms in the North China plain
The large-scale sow farm (LS) had a total of 18 mechanically ventilated houses, grouped in three rows of six, with ~10 m separation distance between houses within each row. The house selected for measurement had dimensions 61 × 20 × 2.5 m (L × W × H) with an east-west orientation (Appendix A Figure A1). Each house had a total holding capacity of 504 sows, with 6 rows of pens and 84 pens (L × W × H: 2.2 × 0.7 × 1.1 m) in each row. Pens had partly slatted floors.
In summer, fresh air entered the house through water pads (for cooling) and exited through east-wall fans. In winter, fresh air entered the house through a heating system via the ridge vents and exited through sidewall fans. Fans could operate separately or together to achieve the target indoor temperature, which ranged from ~20°C in winter to ~23°C in summer. The sows were fed twice per day (summer: 8:00 and 17:00; winter: 7:00 and 14:00) before manure removal. Manure was collected in a gutter beneath the slatted floor and flushed daily.
The small-scale sow farm (SS) had a total of 6 naturally-ventilated houses in one row, with ~3 m separation distance between houses. The selected house had dimensions 18 × 7 × 3 m (L × W × H) with an east-west orientation (Appendix A Figure A2). The house had 10 ventilation windows (0.5 × 0.5 m) along the sidewalls, which were only opened in summer, and one door (W × H: 1.5 × 2 m). The house had a total holding capacity of 17 sows with 17 solid concrete floor pens (L × W × H: 3 × 2 × 1 m). The sows were fed three times per day (7:00, 11:30, and 17:00), and manure was removed manually by scraper daily at 10:00.
The large-scale fattening pig farm (LF) had a total of 2 mechanically ventilated houses with a ~10 m separation distance. The selected house had dimensions 74 × 16 × 2.5 m (L × W × H) with a north-south orientation (Appendix A Figure A3). The house had a total holding capacity of ~1,000 fattening pigs, with 2 rows of pens, each row comprising 13 partly-slatted-floor pens (L × W × H: 7 × 4 × 1.1).
In summer, fresh air entered the house through water pads and exited through south-wall fans. In winter, fresh air entered the house through a heating system via the ridge vents and exited the house through south-wall fans. Ventilation fans operated separately or together to achieve the target house temperature, which ranged from 22°C in winter to 23°C in summer. The fattening pigs were fed twice daily in summer (6:00–8:00 and 16:00–18:00) and once per day in winter (9:00–11:00). Manure was collected beneath the slatted floor and scraped daily at 17:00.
The small-scale fattening pig farm (SF) had a total of 2 naturally-ventilated houses with a ~5 m separation distance. The selected house had dimensions 25 × 11 × 3 m (L × W × H) with an east-west orientation (Appendix A Figure A4). The house had 12 ventilation windows (1 × 1 m) and one door (W × H: 1.2 × 2 m) and comprised of 6 solid-concrete-floor pens (L × W × H: 10 × 2 × 1 m). The fattening pigs were fed three times per day (7:00, 14:00, and 17:30), and manure was removed manually by scraper once per day (16:00).
Measurement
Ammonia and carbon dioxide (CO2) concentrations were measured for 3–6 consecutive days at each farm during each season. Specific measurement dates were as follows: LS 2017/8/17–8/21 (summer) and 2017/1/5–1/11 (winter); SS 2017/9/26–9/30 (summer) and 2018/3/17–3/20 (winter); LF 2017/8/26-8/30 (summer) and 2018/1/18–1/22 (winter); SF 2017/9/21–9/25 (summer) and 2018/3/13–3/16 (winter). In the mechanically ventilated houses (LS and LF), the air was sampled at ventilation inlet and outlet points. An INNOVA 1409 Multipoint Sampler (LumaSense Technologies A/S, Ballerup, Demark) together with an INNOVA infrared 1412i Photoacoustic Field Multi-Gas Monitor (LumaSense Technologies A/S, Ballerup, Demark) were used to determine gas concentrations. For the naturally ventilated houses, the air was sampled inside and > 10 m outside of each house, also using the INNOVA Photoacoustic monitor with 12-point sampler. The INNOVA was calibrated prior to each measurement event using the appropriate standard calibration gases (ammonia and carbon dioxide) procured from the National Standard Material Center (Beijing, China). The air sampling period for each measurement point was 40 s, followed by 20 s flushing time before a new measurement commenced. Between 4 and 8 1-min measurements were made continuously for each sampling location in the large farms and 2–4 in the small farms, but only stable values were used for NH3 and CO2 concentrations for each sampling location. The temperature and relative humidity of outdoor and indoor air were continuously monitored at 1 min intervals using a combined sensor (ZDR-20, Hangzhou Zeda Instruments CO., Ltd, Hangzhou, China) at a height of 2.0 m. Feed was sampled at each farm and analyzed for total Kjeldahl nitrogen (TKN) (Lu Citation2000).
Flux calculation
The concentrations were measured as ppm (by volume) and converted to mg m−3 for emission calculations. The ventilation rate (VR, m3 hr−1) was estimated using the CO2 balance method (de Sousa and Pedersen Citation2004) according to EquationEquation (1)(1)
(1) :
where:
C: CO2 production (0.185 m3 hr−1 hpu−1);
A: Relative animal activity;
Φ: Heat production of a pig at temperature t (hpu pig−1);
N: The number of pigs inside the house during the specific hour (head);
: Average hourly CO2 concentration for outlet or inside sampling points, mg m−3;
Adjustment for diurnal variation in the relative animal activity (A) was carried out according to EquationEquation (2)(2)
(2) (Pedersen and Sällvik Citation2002):
where:
a: Constant (expressing the amplitude with respect to the constant 1);
h: Time of the animal activity;
hmin: Time of day with minimum activity (hours after midnight).
For fattening pigs and sows, the heat production (Φ) was calculated according to Pedersen and Sällvik (Citation2002), based on the bodyweight of the pigs and the feed intake (EquationEquations 3(3)
(3) ~5):
where:
m: Body mass of the pig, kg;
n: Daily feed energy intake in relation to maintenance, the default values vary according to body mass of the pig: 40 kg, 3.46; 50 kg, 3.52; 60 kg, 3.59; 70 kg, 3.20; 80 kg, 2.90;
p: Days of pregnancy;
Y1: Daily gain, pregnant sow (assumed as 0.18 kg d−1);
Y2: Milk production (assumed as 6 kg/d−1).
The emission per pig unit (E, g pig−1 hr−1) was reported as in the following equation:
where:
: Average hourly NH3 concentration for the outlet or inside sampling points, mg m−3;
: Average hourly NH3 concentration for the inlet or outside sampling points, mg m−3.
The pig live weight and productivity may differ from herd to herd. To make results comparable, the emission per livestock unit (E, g LU−1 hr−1) where one LU is equivalent to 500 kg animal mass, was reported as follows:
Statistical analysis
The measured concentrations of NH3 and CO2 at each sampling point were averaged as mean hourly values and used with mean hourly ventilation estimates to calculate the emission rate. Daily means were used for statistical evaluation. The correlations between NH3 concentrations or NH3 emission rates and other parameters were investigated using Pearson’s analysis with the SPSS 20.0 IBM statistical analysis package.
Results and discussion
Microclimatic conditions
The recommended indoor temperature range for intensive pig farms in China is from 18 to 22°C for lactating sows and from 15 to 23°C for fattening pigs. The mean indoor temperature during the measurement periods ranged from 21.8 in winter to 25.1°C in summer (LS) and 22.7 in winter to 24.3°C in summer (LF) (). These results indicate that the seasonal indoor temperature patterns in the large industrial pig farms remained relatively steady as would be expected, given the temperature control features of these farms; the cooling effect of water pad-fan system in summer and the warming effect of the heating system in winter limited the fluctuation of indoor temperature. Additionally, the indoor temperature in the large industrial pig farms had a lower fluctuation ( and b) compared with outdoor temperature. However, in the small traditional pig farms, the houses were designed with insufficient insulation and without supplemental heating or cooling. As expected, the indoor temperature followed the outside, being higher in summer () and in the daytime ( and b).
Table 2. Description of the indoor microclimatic conditions, NH3 concentrations, and emission rates related to four pig farms: large-scale sow (LS), small-scale sow (SS), large-scale finishing pig (LF), and small-scale finishing pig (SF); mean ± standard deviation
Figure 2. The seasonal and diurnal variation of temperature, relative humidity, and ventilation rate in different pig farms: a), c), and e): sow farms; b), d), and f): fattening pig farm
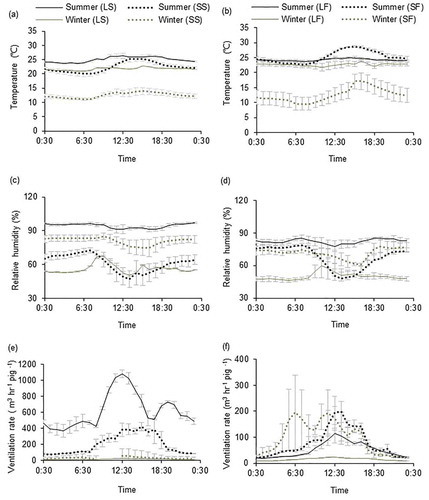
Irrespective of growth stage, the relative humidity was higher in summer than in winter in the large industrial pig farms (), because of the effect of the water pads. In the large industrial pig farms, there was little diurnal variation in relative humidity, especially in summer, suggesting that the outdoor relative humidity had no impact on that indoors. In summer, the relative humidity in the large industrial pig farms was higher than that in the small traditional farms because of the influence of the water pads on the incoming air. In the small traditional pig farms, the indoor relative humidity showed less seasonal variation (although was higher in winter in SS (), and was higher at nighttime ( and d). This was as expected because the houses were ventilated by opening windows and/or doors, and hence the indoor relative humidity was subject to the impact of outdoor conditions. For the small farms, relative humidity ( and d) was inversely related to the temperature ( and b).
Pedersen et al. (Citation1998) describe three methods for the estimation of the ventilation rate for insulated houses based on heat, moisture, and CO2 balances, whereas for uninsulated housing only the CO2 balance method is recommended. Hence, in this study, the ventilation rate for each farm was estimated using the CO2 balance. In the large industrial pig farms, the fan operating system was temperature-dependent, and at higher temperatures, the ventilation requirement was higher. Therefore, ventilation rates were higher in the summer () and higher during the daytime than the nighttime ( and f). In the small traditional pig farms, the ventilation rates were higher during the daytime than nighttime. The ventilation rates obtained in the present study were comparable with those from Zhu et al. (Citation2006a), who were making measurements from a natural-ventilated house from the same region as this study. The ventilation rates were mostly higher in the small fattening pig farm than those in the large fattening pig farm. The ventilation system may determine the difference between the farm scales. In many cases, ventilation rates are higher for naturally ventilated compared with mechanically ventilated housing (Kim et al. Citation2008) because of the smaller size and many openings.
Influence of farm scale on NH3 emission
The ammonia emitted from pig housing derives from organic N in pig excreta. After deposition on the floor, the urea from urine is rapidly hydrolyzed to NH3/NH4+ (l) in solution by the fecal urease (Philippe et al. Citation2011). This will subsequently be emitted into the atmosphere as gaseous NH3 (g) at a rate that depends on the concentration at the emitting surface and factors affecting the equilibrium between NH3/NH4+ in solution and between dissolved and gaseous NH3 (Ivanova-Peneva, Aarnink, and Verstegen Citation2008):
Normalizing the NH3 emission rate by dividing the total emission rate by the total live weight of pigs and then multiplying by 500 kg (1 livestock unit, LU) removes the total live weight as a variable and provides an effective means to compare emission rates between studies. Normalized NH3 emission rates from different growing stages and farm scales are presented in . For LS, mean normalized NH3 emission rates for summer and winter were slightly lower compared with values reported for Northern Europe, ranging from 0.50 to 1.28 g LU−1 hr−1 (Koerkamp et al. Citation1998; Philippe, Cabaraux, and Nicks Citation2011), possibly because of the daily manure removal for this house, rather than manure remaining in the below-slat slurry pit for a longer period as in the literature studies. As shown by Guarino et al. (Citation2003), frequent manure removal can reduce NH3 emission by 35% in comparison with the deep-pit system. Zhu et al. (Citation2006a) observed seasonal variation in normalized NH3 emission rates (summer: 0.46 ~ 1.21 g LU−1 hr−1; winter: 0.64 ~ 0.84 g LU−1 hr−1) from a naturally ventilated sow house with a slatted floor in China. Comparable values for summer were obtained in the present study, from the naturally ventilated small-scale sow house with a solid concrete floor. The lower normalized NH3 emission rate we observed for winter may be because the inside temperature for this house was lower than that (~20°C) in the literature studies. For LF, mean normalized NH3 emission rates were within the range of rates reported from previous studies for mechanically ventilated fattening pig housing with a partly-slatted floor, with rates ranging from 0.89 to 1.87 g LU−1 hr−1 (Zong, Li, and Zhang Citation2015) and 1.67 to 5.26 g LU−1 hr−1 (Wang et al. Citation2011). Zhu et al. (Citation2006b) reported mean normalized NH3 emission rates of 1.37 g LU−1 hr−1 in summer and 2.02 g LU−1 hr−1 in winter for a naturally ventilated fattening pig house with a fully slatted floor. Greater emission rates were reported for the “gan qing fen” system and deep bedding system by Xu et al. (Citation2014) and Dong et al. (Citation2009), who conducted experiments in the same region as in our study. Results from the small-scale finishing pig farm in the present study were lower, possibly because fattening pigs on the small farm were raised on a diet of cornflour and bran, with lower potential for NH3 emission (Ivanova-Peneva, Aarnink, and Verstegen Citation2008). Griffing, Overcash, and Westerman (Citation2007) reported emission factors, expressed as a percentage of the excreted total Kjeldahl nitrogen (TKN), for several national NH3 emission inventories, to be in the range 4.8–40.6%. In the present study, lower values (ranging from 2.2 to 18.8%, see Appendix B, calculated from feed intake, feed N content, and the emission rate from this study) were obtained, which is expected considering the feed composition and manure collection/removal systems in North China.
As shown in and , pig farms of different scales differ in their feed N content, floor type, ventilation system, indoor climate, and manure removal system, all of which will influence NH3 emission. However, few data are available to estimate the effects of farm scale, although the structure of pig production is changing in China. This study provides some of the first data comparing NH3 emission between farm scales for China (). For the sow farms, NH3 emission rates were greater for the small farm than for the large farm, which could be ascribed to the following factors: i) the slatted floor of the large farm enabled rapid draining of urine and hence limited fouled areas that are significant sources of NH3 (Svennerstedt Citation1999), as evidenced by Hou, Velthof, and Oenema (Citation2015) who reported 60% lower emissions from slatted floor housing compared with a solid concrete floor; ii) the sows were raised in individual compartments, which resulted in less floor contamination and therefore lowered NH3 emission (Ni et al. Citation1999). For the fattening pig farms, NH3 emission rates were greater for the large farm than for the small farm. The lower values for the SF farm were possibly related to the lower nitrogen content in the feed. This is supported by Canh et al. (Citation1998), who found that NH3 emissions were reduced by 10–12.5% for each percent decrease in dietary crude protein. On a per pig basis, NH3 emission rates were mostly greater from the sow farms than the fattening pig farms. It is expected that NH3 emissions increased with increasing animal weight (Ivanova-Peneva, Aarnink, and Verstegen Citation2008) because manure production is directly proportional to body weight (Hoeksma et al. Citation1992).
There is little data relating NH3 emission rates to farm scale for China. Here, we provide the first estimates of NH3 emission from different farm scales. However, it should be noted that the ventilation rate based on the CO2 balance method provides only an approximation of the house ventilation rate, which will contribute to the appreciable variation in the emissions data (Bicudo et al. Citation2002), and thus more accurate measurement methods need to be applied in China. In addition, differences in manure collection/removal systems and animal diets adopted by the farms likely contributed to the variations in the observed emissions data.
Seasonal and diurnal variations in NH3 emission rates
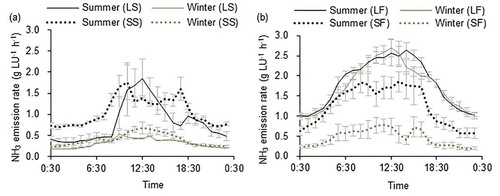
shows the diurnal variation in NH3 emission rates for the different farms. Regardless of farm scale, NH3 emission rates measured in summer were higher than those in winter. These results are explained by the greater indoor temperature and/or higher ventilation rate in summer () which promote NH3 emission. Ammonia emission rates were higher in the daytime than at nighttime due to higher indoor temperature and animal activity. In the large industrial farms, the indoor temperature remained relatively steady throughout the day, and temperature explained very little of the diurnal variation in NH3 emission rate, but ventilation rate explained more (R2 = 0.66–0.93, p < .001) (); the higher NH3 emission rates during the daytime were most likely due to the increased animal activity and their higher frequency of urination and defecation (Aarnink, Koetsier, and Van den Berg Citation1993). As reported by Jeppsson (Citation2003), animal activity could be a larger factor because pigs lie on NH3-emitting surfaces during the nighttime and are grubbing in the NH3-emitting material during the daytime. Saha et al. (Citation2014) observed that most pigs excreted 1–2 h after feeding, with consequent peaks in emissions. However, in the present study, feeding and manure removal showed no obvious impact on the NH3 emission rate, possibly because other factors masked these impacts. Several microclimatic parameters can influence NH3 emission, but a relationship between emission rate and a microclimatic parameter on one farm may be masked by other microclimatic parameters on another farm; thus, it is difficult to derive a consistent relationship between microclimatic parameters and NH3 emission. Nevertheless, this study revealed a positive relationship between temperature and NH3 emission rate, and a negative relationship between relative humidity and NH3 emission rate, in agreement with the observations of Cortus et al. (Citation2008).
Figure 3. Seasonal variation of NH3 emission rates (mean ± standard deviation between days, day = 3–5) in different farms
Seasonal and diurnal variations in NH3 concentrations
Indoor NH3 concentrations measured at each pig farm () were all below the threshold for indoor air quality in livestock housing (25 ppm and 19 mg m−3, for an 8 h working day) given by Koerkamp et al. (Citation1998). This was probably due to the interaction between the low ammonia emission rates and high ventilation rates in the present study. Kim et al. (Citation2008) measured NH3 concentrations in different types of pig house and found that, irrespective of the type of manure collection system, the NH3 concentrations in mechanically-ventilated pig houses were higher than those in the naturally ventilated pig house. Our findings are in agreement with this and can be explained by the so-called “dilution effect,” which varies depending on the ventilation rate (Elzing and Monteny Citation1997). The seasonal variation in the outlet or indoor NH3 concentrations differed according to the farm scale. For the large industrial pig farms, outlet NH3 concentrations in summer were lower compared with those in winter, although the ammonia emission rates were greater in summer. This suggests that the ventilation rate plays a more important role in the seasonal variation in NH3 concentration. However, for the small traditional farms, seasonal differences were less evident, with none apparent for SS, but somewhat higher concentrations in summer than in winter for SF, which may have been related to the higher indoor temperature. This suggests that for small farms without mechanical ventilation, the NH3 emission rate plays the more important role rather than the ventilation rate in indoor NH3 concentration.
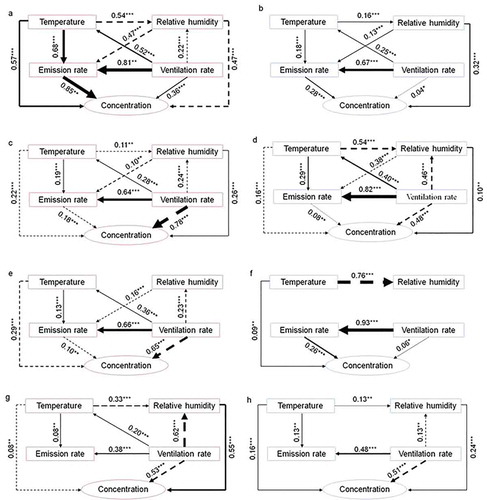
shows the diurnal variation in the outlet and indoor NH3 concentrations for the different farms. The ventilation rate was a significant explanatory variable for NH3 concentration (Elzing and Monteny Citation1997). In the small traditional pig farms, NH3 concentrations were lower in the daytime than those at nighttime, which can be explained by the diurnal variation in the ventilation rate. When assessed on an hourly basis, a fairly strong negative correlation (R2 = 0.48–0.78, p ≤ .001) was obtained between the ventilation rate and the NH3 concentration (, d, g and h), showing that most of the diurnal variation in NH3 concentration can be explained by the ventilation rate. The results show that increases in ventilation rate are required in the small farms to give a better indoor environment regarding NH3 concentration. However, for the large industrial pig farms, this clear relationship (R2 = 0.36 ~ 0.65, p ≤ .001) was only found in the summer, and emission rate rather than ventilation rate plays a more important role in explaining the diurnal variation of NH3 concentration (), possibly because at such low ventilation rates the effect of air dilution was being masked by other factors (Zong et al. Citation2014). A positive correlation was obtained between NH3 concentration and ventilation rate in summer in the LS farm, suggesting that other factors (e.g., animal activity) were more important in explaining the diurnal variation for this farm. The inconsistent relationship between NH3 concentration and ventilation rate also indicates that the ventilation rate may not be the primary cause of variation, but a secondary factor in the large industrial farms. However, few experiments consider only the ventilation rate effect because of the interlinked effect of temperature. There was no consistent relationship between temperature or relative humidity and NH3 concentration. Neither did feeding or manure removal events show any obvious impact on the outlet or indoor NH3 concentration.
Figure 4. Seasonal and diurnal variation of NH3 concentrations (mean ± standard deviation between days, day = 3–5) in different pig farms
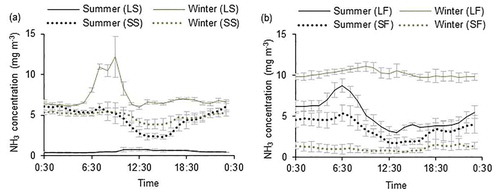
Figure 5. Pearson correlation matrix coefficients (R2) for NH3 concentration and emission rate under different microclimatic conditions for the four pig farms: large-scale sow (LS), small-scale sow (SS), large-scale finishing pig (LF), and small-scale finishing pig (SF). The width of the arrows is proportionate to Pearson correlation matrix coefficients adjacent with values. Solid and dashed lines represent positive and negative correlations, respectively. The R2 denotes the proportion of variance that could be explained by the corresponding variable. Significance levels are as follows: *: p < .05, **: p < .01, and ***: p < .001. a) LS (summer); b) LS (winter); c) SS (summer); d) SS (winter); e) LF (summer); f) LF (winter); g) SF (summer) and h) SF (winter)
Implications for NH3 mitigation from pig farms
The data provided in this study will be helpful to establish mitigation targets and devise effective abatement techniques, and thus to promote the health of workers, improve the welfare of confined pigs, and protect the environment through the reduction of NH3 emissions from pig housing. Accordingly, ammonia mitigation on sow farms (especially small-scale ones) should be a top priority in the North China Plain. In addition, mitigation techniques should be initially targeted to summer, particularly during the daytime. Although microclimatic parameters, to some extent influence indoor ammonia concentration and emission rate, using microclimatic parameters to modulate ammonia emission is rather impractical because the ambient parameters must primarily be set for the bioclimatic comfort of the animals. The results obtained in this study also indicated that the farm-scale effect on NH3 emission could be ascribed to differences in i) feed composition for the fattening pig farms and ii) floor system and animal activity for the sow farms. Low-nitrogen feeding (targeted to meet pig requirement) is one of the most cost-effective and strategic ways of reducing NH3 emissions (Bittman et al. Citation2014). Reduced N content diets containing synthetic amino acids have been shown to reduce N excretion, which leads to lower NH3 emissions without any detrimental effect on pig performance. It has been shown that NH3 emission can be decreased in this way by 24–65% (Hou, Velthof, and Oenema Citation2015). In this study, we also found that the farms using higher N content diets emit more NH3 emission, such as the small-scale sow farm and the large-scale fattening pig farm; emission reductions on these farms could therefore be achieved by using lower protein feed. Furthermore, NH3 mitigation techniques should be chosen based on the farm scale. For small farms, appropriate use of bedding can be an effective mitigation option (Wang et al. Citation2011), while for larger farms the use of air scrubbers or manure acidifying (both too expensive to implement on small-scale farms) can be effective in lowering NH3 emissions (Liu et al. Citation2019).
Conclusion
Farms operating at different production scales differed in their feed N content, floor type, ventilation system, indoor climate, and manure removal system, all of which influence NH3 emissions. This study investigated the farm-scale effect on NH3 emissions and concentrations and their temporal variations in North China.
For sow farms, the NH3 emission rate was greater from the small traditional farm, possibly due to raising sows on the slatted floor and in individual compartments in the large industrial farms. However, in fattening pig farms, NH3 emission rates were greater in the industrial large farms, most likely due to dietary differences.
Regardless of the farm scale, NH3 emission rates were higher in summer than in winter, attributed to a higher indoor temperature and high ventilation rate in summer. Emission rates were higher during daytime than at night, possibly due to high indoor daytime temperature and/or diurnal variation in animal activity.
NH3 concentrations were mostly higher in the large industrial farms due to lower ventilation rates than in the small traditional farms; outlet NH3 concentration in the large industrial farms was lower in summer than in winter; although the diurnal variation was inconsistent between farms, it could best be explained by the ventilation rate in the small traditional farms and the emission rate in the large industrial farms.
Disclosure statement
No potential conflict of interest was reported by the authors.
Additional information
Funding
Notes on contributors
Yubo Cao
Yubo Cao is a Ph.D. student at the Center for Agricultural Resources Research, IGDB, Chinese Academy of Science and the University of Chinese Academy of Science.
Zhaohai Bai
Zhaohai Bai and Xuan Wang are associate researchers at the Center for Agricultural Resources Research, IGDB, Chinese Academy of Science.
Tom Misselbrook
Tom Misselbrook is a principal research scientist at the Department of Sustainable Agriculture Sciences, Rothamsted Research, North Wyke, UK.
Lin Ma
Lin Ma is a research professor at the Center for Agricultural Resources Research, IGDB, Chinese Academy of Science.
References
- Aarnink, A. J. A., A. C. Koetsier, and A. J. Van den Berg. 1993. Dunging and lying behaviour of fattening pigs in relation to pen design and ammonia emission. In Fourth International Symposium and livestock environment (pp. 1176–1183).
- Bai, Z., L. Ma, S. Jin, W. Ma, G. L. Velthof, O. Oenema, and F. Zhang. 2016. Nitrogen, phosphorus, and potassium flows through the manure management chain in China. Environ. Sci. Technol. 50 (24):13409–18. doi:10.1021/acs.est.6b03348.
- Bai, Z., L. Ma, W. Qin, Q. Chen, O. Oenema, and F. Zhang. 2014. Changes in pig production in China and their effects on nitrogen and phosphorus use and losses. Environ. Sci. Technol. 48 (21):12742–49. doi:10.1021/es502160v.
- Bai, Z., X. Li, J. Lu, X. Wang, G. L. Velthof, D. Chadwick, and O. Oenema. 2017. Livestock housing and manure storage need to be improved in china. Environ. Sci. Technol. 51 (15):8212–14. doi:10.1021/acs.est.7b02672.
- Bicudo, J. R., D. R. Schmidt, A. Singh, S. W. Gay, R. S. Gates, L. D. Jacobson, and S. J. Hoff. 2002. Air quality and emissions from livestock and poultry production/waste management systems. National center for manure and animal waste management white papers. North Carolina State University.
- Bittman, S., M. Dedina, C. M. Howard, O. Oenema, and M. A. Sutton. 2014. Options for ammonia mitigation: Guidance from the UNECE task force on reactive nitrogen. Edinburgh, UK: NERC/Centre for Ecology & Hydrology.
- Canh, T. T., A. J. A. Aarnink, J. B. Schutte, A. Sutton, D. J. Langhout, and M. W. A. Verstegen. 1998. Dietary protein affects nitrogen excretion and ammonia emission from slurry of growing-finishing pigs. Livest. Prod. Sci. 56 (3):181–91. doi:10.1016/S0301-6226(98)00156-0.
- Chen, Y., A. Ebenstein, M. Greenstone, and H. Li. 2013. Evidence on the impact of sustained exposure to air pollution on life expectancy from China’s Huai River policy. Proc. National Acad. Sci. 110 (32):12936–41. doi:10.1073/pnas.1300018110.
- Cortus, E. L., S. P. Lemay, E. M. Barber, G. A. Hill, and S. Godbout. 2008. A dynamic model of ammonia emission from urine puddles. Biosyst. Eng. 99 (3):390–402. doi:10.1016/j.biosystemseng.2007.11.004.
- de Sousa, P., and S. Pedersen. 2004. Ammonia emission from fattening pig houses in relation to animal activity and carbon dioxide production. Agric. Eng. Int.6:1–13.
- Dong, H., G. Kang, Z. Zhu, X. Tao, Y. Chen, H. Xin, and J. D. Harmon. 2009. Ammonia, methane, and carbon dioxide concentrations and emissions of a hoop grower-finisher swine barn. Agric. Biosys. Eng. 52 (5):1741–47.
- Elzing, A., and G. J. Monteny. 1997. Ammonia emission in a scale model of a dairy-cow house. Transact. ASAE 40 (3):713–20. doi:10.13031/2013.21301.
- Gallmann, E., E. Hartung, and T. Jungbluth. 2003. Long-term study regarding the emission rates of ammonia and greenhouse gases from different housing systems for fattening pigs-final results. In: CIGR (Ed.), Proceedings of the International Symposium on Gaseous and Odour emissions from animal production facilities, Foulum, Denmark: Danish Institute for Agricultural Sciences. pp. 122–30.
- Griffing, E. M., M. Overcash, and P. Westerman. 2007. A review of gaseous ammonia emissions from slurry pits in pig production systems. Biosyst. Eng. 97 (3):295–312. doi:10.1016/j.biosystemseng.2007.02.012.
- Guarino, M., C. Fabbri, P. Navarotto, L. Valli, G. Mascatelli, M. Rossetti, and V. Mazzotta. 2003. Ammonia, methane and nitrous oxide emissions and particulate matter concentrations in two different buildings for fattening pigs. Proceedings of the International Symposium on Gaseous and Odour Emissions from animal production facilities, commission Internationale du Genie Rural Horsens, June 1-4, 2003, Denmark, pp. 140–49.
- Hoeksma, P., N. Verdoes, J. Oosthoek, and J. A. M. Voermans. 1992. Reduction of ammonia volatilization from pig houses using aerated slurry as recirculation liquid. Livest. Prod. Sci. 31 (1–2):121–32. doi:10.1016/0301-6226(92)90060-H.
- Hou, Y., G. L. Velthof, and O. Oenema. 2015. Mitigation of ammonia, nitrous oxide and methane emissions from manure management chains: A meta-analysis and integrated assessment. Glob. Chang Biol. 21 (3):1293–312. doi:10.1111/gcb.12767.
- Huang, R. J., Y. Zhang, C. Bozzetti, K. F. Ho, J. J. Cao, Y. Han, and P. Zotter. 2014. High secondary aerosol contribution to particulate pollution during haze events in China. Nature 514 (7521):218. doi:10.1038/nature13774.
- Ivanova-Peneva, S. G., A. J. Aarnink, and M. W. Verstegen. 2008. Ammonia emissions from organic housing systems with fattening pigs. Biosyst. Eng. 99 (3):412–22. doi:10.1016/j.biosystemseng.2007.11.006.
- Jeppsson, K. H. 2003, June. Diurnal variation in ammonia, carbon dioxide and water vapour emission from a deep litter house for fattening pigs. In International Symposium on Gaseous and Odour emissions from animal production facilities, Horsens (pp. 1–4).
- Kang, Y., M. Liu, Y. Song, X. Huang, H. Yao, X. Cai, H. Zhang, L. Kang, X. Liu, X. Yan, H. He, Q. Zhang, M. Shao, and T. Zhu. 2016. High-resolution ammonia emissions inventories in China from 1980 to 2012. Atmos. Chem. Phys. 16:2043–58.
- Kim, K. Y., H. J. Ko, H. T. Kim, Y. S. Kim, Y. M. Roh, C. M. Lee, and C. N. Kim. 2008. Quantification of ammonia and hydrogen sulfide emitted from pig buildings in Korea. J. Environ. Manage. 88 (2):195–202.
- Kim, K. Y., H. J. Ko, H. T. Kim, Y. S. Kim, Y. M. Roh, C. M. Lee, and C. N. Kim. 2008. Quantification of ammonia and hydrogen sulfide emitted from pig buildings in Korea. J. Environ. Manage. 88 (2):195–202. doi:10.1016/j.jenvman.2007.02.003.
- Koerkamp, P. G., J. H. M. Metz, G. H. Uenk, V. R. Phillips, M. R. Holden, R. W. Sneath, and M. Schröder. 1998. Concentrations and emissions of ammonia in livestock buildings in Northern Europe. J. Agric. Eng. Res. 70 (1):79–95. doi:10.1006/jaer.1998.0275.
- Lin, X., R. Zhang, S. Jiang, H. El-Mashad, and H. Xin. 2017. Emissions of ammonia, carbon dioxide and particulate matter from cage-free layer houses in California. Atmos. Environ. 152:246–55. doi:10.1016/j.atmosenv.2016.12.018.
- Liu, J., Z. Bai, Y. Cao, N. Zhang, Z. Zhao, and L. Ma. 2019. Impact of surface acidification of manure on ammonia emission in animal housing. Chinese J. Eco-Agric. 27 (5):677–85.
- Lu, R. K. 2000. Analytical methods of soil agrochemistry (in Chinese). Beijing, China: China Agriculture Science and Technology Press, 305–36.
- Ni, J., C. Vinckier, J. Coenegrachts, and J. Hendriks. 1999. Effect of manure on ammonia emission from a fattening pig house with partly slatted floor. Livest. Prod. Sci. 59 (1):25–31. doi:10.1016/S0301-6226(99)00002-0.
- Pan, Y., S. Tian, Y. Zhao, L. Zhang, X. Zhu, J. Gao, and Y. Wang. 2018. Identifying ammonia hotspots in China using a national observation network. Environ. Sci. Technol. 52 (7):3926–34. doi:10.1021/acs.est.7b05235.
- Paulot, F., D. J. Jacob, R. W. Pinder, J. O. Bash, K. Travis, and D. K. Henze. 2014. Ammonia emissions in the United States, European Union, and China derived by high-resolution inversion of ammonium wet deposition data: Interpretation with a new agricultural emissions inventory (MASAGE_NH3). J. Geophys. Res. Atmos. 119 (7):4343–64. doi:10.1002/2013JD021130.
- Pedersen, S., H. Takai, J. O. Johnsen, J. H. M. Metz, P. G. Koerkamp, G. H. Uenk, and R. P. White. 1998. A comparison of three balance methods for calculating ventilation rates in livestock buildings. J. Agric. Res. 70 (1):25–37.
- Pedersen, S., and K. Sällvik. 2002. Climatization of animal houses-heat and moisture production at animal and house level 4 th report of CIGR working group. Research Centre Bygholm, Danish Insitute of Agricultural Sciences, Horsens, Demark.
- Philippe, F., J. Cabaraux, and B. Nicks. 2011. Ammonia emissions from pig houses: Influencing factors and mitigation techniques. Agric. Ecosyst. Environ. 141 (3):245–60. doi:10.1016/j.agee.2011.03.012.
- Saha, C. K., C. Ammon, W. Berg, M. Fiedler, C. Loebsin, P. Sanftleben, and T. Amon. 2014. Seasonal and diel variations of ammonia and methane emissions from a naturally ventilated dairy building and the associated factors influencing emissions. Sci. Total Environ. 468:53–62. doi:10.1016/j.scitotenv.2013.08.015.
- Svennerstedt, B. 1999. Drainage properties and ammonia emissions in slatted floor systems for animal buildings. J. Agric. Eng. Res. 72 (1):19–25. doi:10.1006/jaer.1998.0347.
- Wang, K., B. Wei., S. Zhu, and Z. Ye. 2011. Ammonia and odour emitted from deep litter and fully slatted floor systems for growing-finishing pigs. Biosyst. Eng. 109 (3):203–10. doi:10.1016/j.biosystemseng.2011.04.001.
- Wu, Y., B. Gu, J. W. Erisman, S. Reis, Y. Fang, X. Lu, and X. Zhang. 2016. PM2. 5 pollution is substantially affected by ammonia emissions in China. Environ. Pollut. 218:86–94. doi:10.1016/j.envpol.2016.08.027.
- Xu, W., K. Zheng, X. Liu, L. Meng, R. M. Huaitalla, J. Shen, and F. Zhang. 2014. Atmospheric NH3 dynamics at a typical pig farm in China and their implications. Atmos. Pollut. Res. 5 (3):455–63. doi:10.5094/APR.2014.053.
- Zhang, X., Y. Wu, X. Liu, S. Reis, J. Jin, U. Dragosits, and B. Gu. 2017. Ammonia emissions may be substantially underestimated in China. Environ. Sci. Technol. 51 (21):12089–96. doi:10.1021/acs.est.7b02171.
- Zhu, Z., H. Dong, B. Shang, G. Kang, H. Zhu, and Y. Shi. 2006a. Measurement of ammonia and nitrous oxide concentrations and estimation of the emission rates from gestation pig buildings. Trans. CSAE (China) 22:175–78.
- Zhu, Z. P., H. M. Dong, B. Shang, G. H. Kang, H. S. Zhu, X. P. Tao, and Y. Shi. 2006b. Measurement of ammonia concentration and estimation on emission flux of finishing pig in pig house. J. Agro-Environ. Sci. 25 (4):1076–80.
- Zong, C., H. Li, and G. Zhang. 2015. Ammonia and greenhouse gas emissions from fattening pig house with two types of partial pit ventilation systems. Agric. Ecosyst. Environ. 208:94–105. doi:10.1016/j.agee.2015.04.031.
- Zong, C., Y. Feng, G. Zhang, and M. J. Hansen. 2014. Effects of different air inlets on indoor air quality and ammonia emission from two experimental fattening pig rooms with partial pit ventilation system–summer condition. Biosyst. Eng. 2014 (122):163–73. doi:10.1016/j.biosystemseng.2014.04.005.