
 ?Mathematical formulae have been encoded as MathML and are displayed in this HTML version using MathJax in order to improve their display. Uncheck the box to turn MathJax off. This feature requires Javascript. Click on a formula to zoom.
ABSTRACT
This study examined reactive oxidized nitrogen (NOy) speciation and partitioning at one urban site, Queens College (QC) in New York City, and one rural site, Pinnacle State Park (PSP) in Addison, New York (NY) from September 2016 to August 2018 and June 2016 to September 2018, respectively. Oxides of nitrogen (NOx), nitric acid (HNO3), particle nitrate (pNO3), peroxy nitrates (PNs), alkyl nitrates (ANs), and NOy measurements were made at both sites. Across all seasons at QC, the median NOx, HNO3, pNO3, PNs, ANs, and NOy concentrations were 10.99, 0.49, 0.24, 0.62, 0.94, and 13.95 parts per billion (ppb), respectively. All-season median percent contributions of NOx, HNO3, pNO3, PNs, and ANs to the total NOy at QC were 77, 4, 2, 5, and 7%, respectively. Therefore, the sum of the individual NOy species (NOyi ≈ NOx + HNO3 + pNO3 + PNs + ANs) accounted for 95% of the total NOy at QC, which was well within measurement uncertainties. At PSP, the median NOx, HNO3, pNO3, PNs, ANs, and NOy concentrations were 0.65, 0.16, 0.12, 0.13, 0.18, and 1.56 ppb, respectively, over all seasons. The median percent contributions of NOx, HNO3, pNO3, PNs, and ANs to NOy over all seasons at PSP were 42, 10, 8, 9, and 12%, respectively. NOyi comprised 81% of NOy across all seasons at PSP, and deviations from 100% closure were generally within measurement uncertainties. Since both datasets yielded NOy budget closure results that were either fully or largely explained by the measurement uncertainties, the observed NOyi is likely representative of ambient NOy in urban and rural New York. The results have implications for understanding the fate of NOx emissions and their impact on local and regional air quality in urban and rural New York State.
Implications: Continuous speciated and total reactive oxidized nitrogen (NOy) measurements were made in urban and rural New York from 2016 to 2018. Different NOy species have contrasting effects on the chemistry that impacts ozone (O3) and fine particulate matter (PM2.5) formation and concentrations. Since O3 and PM2.5 are regulated pollutants that have proven difficult to control, the results have implications for current and future air quality policy.
Introduction
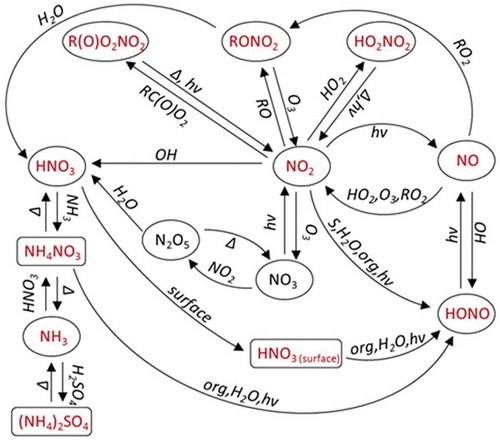
Oxides of nitrogen (NOx = nitric oxide (NO) + nitrogen dioxide (NO2)) emissions contribute to ozone (O3) and fine particulate matter (PM2.5) formation. O3 and PM2.5 are pollutants that impact human health and are subject to regulatory action (U.S. EPA, Citation2010, Citation2014). In 2016, exposure to fine particles led to approximately 4 million premature deaths worldwide (World Health Organization Citation2018). NOx oxidation products (e.g., nitric acid (HNO3), particle nitrate (pNO3)) contribute to acid deposition and nutrient loading, which affect ecosystems (U.S. EPA Citation2019). Different reactive oxidized nitrogen (NOy) species exert differing effects on the atmospheric chemical reactions that influence O3 and PM2.5 concentrations, atmospheric acidity, and atmospheric oxidation potential (e.g., Crutzen Citation1979; Singh, Brune, and Crawford Citation2003; Singh et al. Citation2007). Measurements of NOy composition are therefore needed to understand and predict the effects of NOx emissions on air pollutant concentrations and atmospheric deposition. The principal components of NOy are NOx, HNO3, pNO3, peroxy nitrates (PNs), and alkyl nitrates (ANs). Although other NOy species, such as dinitrogen pentoxide (N2O5), nitryl chloride (ClNO2), peroxynitric acid (HO2NO2), gas-phase nitrate (NO3), and nitrous acid (HONO) significantly influence nighttime chemistry, they are (1) less abundant, (2) photolyzed rapidly during daytime (e.g., Brown et al. Citation2006; Singh et al. Citation2007), and (3) difficult to measure continuously. A general schematic summarizing how many of the above NOy species interact is shown in .
Figure 1. General schematic of oxidized and reduced nitrogen chemistry in the troposphere. Compounds that are most important to daytime and nighttime chemistry are in red and black, respectively
Previous studies have assessed the impact of NOy compounds on tropospheric chemistry by examining the NOy budget. Early investigations of NOy partitioning in Europe (e.g., Harrison et al. Citation1999; Zellweger et al. Citation2000), the United States (e.g., Aneja et al. Citation1996; Parrish et al. Citation1993), and Canada (e.g., Hayden et al. Citation2003; Parrish et al. Citation1993) found that NOx, HNO3, and peroxyacetyl nitrate (PAN) contributed approximately 70%–90% to NOy concentrations. Due to (1) ongoing NOx reductions throughout the United States (e.g., Hidy and Blanchard Citation2015) and (2) HNO3, PAN, and ANs being closely related to the NOx level (e.g., Browne and Cohen Citation2012; Singh Citation1987; Singh and Hanst Citation1981), other NOy species–-such as ANs–-may currently constitute a larger fraction of NOy (Li et al. Citation2018). Revisiting the NOy budget to study the present distribution of NOy species is warranted for two reasons.
First, even though recent studies in the United States (e.g., Benedict et al. Citation2018; Li et al. Citation2018; Wild et al. Citation2016) and China (e.g., Chen, Wang, and Lu Citation2018; Li et al. Citation2016; Xue et al. Citation2011) have conducted NOy budget analyses, a key limitation associated with these studies was that the authors focused on the NOy budget during a particular season rather than during all seasons. For example, Benedict et al. (Citation2018) studied the summertime NOy budget at Rocky Mountain National Park (ROMO) in Colorado during the Front Range Air Pollution and Photochemistry Experiment (FRAPPЀ). From July 16 to August 31, 2014, the authors found that NO, total nitrate (= HNO3 + pNO3), ANs, and PAN comprised 7%, 11%, 4%, and 24%, respectively, of NOy at ROMO (Benedict et al. Citation2018). Since NO2 was not measured, the authors suggested that NO2 and other NOx oxidation products (NOz = NOy – NOx) accounted for 54% of summertime NOy at ROMO (Benedict et al. Citation2018).
Li et al. (Citation2018) used the Geophysical Fluid Dynamics Laboratory (GFDL) AM3 model to explore decadal changes in summertime (July-August) NOy from 2004 to 2013 over the southeast United States. In summer 2004 (2013), the authors found that the model-predicted NOy consisted of 45% (42%) HNO3, 31% (32%) NOx, 14% (14%) PNs, and 9% (12%) ANs (Li et al. Citation2018). Furthermore, Li et al. (Citation2018) found that HNO3, NOx, PNs, ANs, and NOy concentrations decreased by 38%, 32%, 34%, 19%, and 34%, respectively, from 2004 to 2013. The authors attributed these decreases to anthropogenic NOx emissions reductions, and they also concluded that lower hydroxyl radical (OH) concentrations resulting from lower NOx levels likely increased the lifetime of NOx and ANs, thereby contributing to the slower ANs reduction rate (Li et al. Citation2018).
In a wintertime study, Wild et al. (Citation2016) examined NOy partitioning at the Horsepool measurement site in the Uintah Basin, Utah, from January 15 to February 27, 2012 and January 23 to February 21, 2013. The winter 2012 and winter 2013 field campaigns had no snow cover and snow cover, respectively. The authors found that NOx was about 80% and 30% of the NOy concentration during winter 2012 and winter 2013, respectively, even though NOx concentrations were similar for the two measurement periods. Wild et al. (Citation2016) concluded that the snow cover present during the winter 2013 measurement period led to enhanced photochemistry and more NOx being oxidized to NOz, yielding a lower NOx-to-NOy ratio. In addition, they found a dramatic difference in nighttime NOz partitioning during the two campaigns. Namely, N2O5 and ClNO2 were approximately 50% of nighttime NOz in winter 2012, while they were a small fraction of nighttime NOz in winter 2013. The authors asserted that the nighttime N2O5 lifetime in winter 2013 was a factor of 2.6 shorter than in winter 2012, which likely contributed in part to the differences in NOz partitioning during the two campaigns (Wild et al. Citation2016).
Second, although previous studies in Europe (e.g., Harrison et al. Citation1999), the United States (e.g., Day et al. Citation2003; Horii et al. Citation2005; Murphy et al. Citation2006; Parrish et al. Citation1993), and Canada (e.g., Hayden et al. Citation2003; Parrish et al. Citation1993; Zhang et al. Citation2008) have made speciated NOy measurements for multiple seasons, the measurements were (1) not made recently (i.e., within the last 10 years), and (2) primarily made in rural areas. This research gap is noteworthy because it is important to compare recent NOy speciation in urban versus rural locations using a comprehensive suite of measurements, especially since NOx concentrations are continuing to decline in the continental United States (e.g., Hidy and Blanchard Citation2015). Parrish et al. (Citation1993) studied the NOy partitioning at six rural sites in the eastern United States and Canada from late summer--early fall 1988 by making NOx, PAN, HNO3, pNO3, and NOy measurements. During daytime hours at multiple lower-elevation sites, Parrish et al. (Citation1993) found that the median contributions of NOx, PAN, and HNO3 to the NOy concentration ranged from approximately 25%–40%, 12%–25%, and 20%–30%, respectively. The authors also reported that the speciated NOy measurements made at all sites consistently accounted for approximately 90% of NOy (Parrish et al. Citation1993).
Hayden et al. (Citation2003) explored the seasonal NOy budget from February 1998 to October 1999 by making NOx, HNO3, pNO3, PAN, and NOy measurements at the rural Sutton research site, which is located in southern Quebec at an elevation of 845 m a.s.l. During winter (summer), the authors determined that NOx, HNO3, and PAN contributed approximately 70% (35%), 18% (20%–25%), and 9% (13%), respectively, to the NOy concentration (Hayden et al. Citation2003). Hayden et al. (Citation2003) also found that an approximately 25%–30% shortfall in the NOy budget occurred during spring and summer. The authors hypothesized that unmeasured, photochemically produced NOy species originating from aged air masses may have been an important contributor to this NOy budget deficit (Hayden et al. Citation2003).
Day et al. (Citation2003) studied NOy speciation using data collected from October 2000 to December 2001 near the University of California-Blodgett Forest Research Station (UC-BFRS). At UC-BFRS, the authors found that ANs were typically 10%–20% of the NOy concentration (Day et al. Citation2003). Day et al. (Citation2003) suggested that ANs may have been an important contributor to the NOy budget shortfall found by previous studies at other rural locations (e.g., Aneja et al. Citation1996; Buhr et al. Citation1990; Hayden et al. Citation2003; Williams et al. Citation1997). In addition, Horii et al. (Citation2005) assessed NOy partitioning at Harvard Forest, Massachusetts (MA) by making NOx, HNO3, PAN, and NOy measurements from June to November 2000. When the prevailing wind direction was northwesterly, Horii et al. (Citation2005) found that the sum of NOx, HNO3, and PAN was comparable to NOy. Namely, HNO3 comprised approximately 33% (20%) of NOy during the summer (fall), with NOx accounting for most of the remaining NOy (Horii et al. Citation2005). In contrast, the authors found an NOy budget deficit similar in magnitude to that reported by Hayden et al. (Citation2003) when the prevailing wind direction was southwesterly. Specifically, NOx and HNO3 accounted for less than 70% of the observed NOy, while PAN contributed 7%–14% to NOy during summer (Horii et al. Citation2005). Ultimately, the authors concluded that unmeasured alkyl and hydroxyalkyl nitrates may have been an important reason for the observed NOy budget shortfall during southwesterly flow conditions (Horii et al. Citation2005).
Zhang et al. (Citation2008) studied the NOy budget in eastern Canada by measuring NOx, PAN, peroxypropionyl nitrate (PPN), HNO3, pNO3, and NOy during 14 field intensives at eight rural sites from 2001–2005. Collectively, these field campaigns made speciated NOy measurements during each season (Zhang et al. Citation2008). The authors distinguished between cold-season, warm-season, and hot-season field campaigns by using the average daytime (9:00–17:00 local time [LT]) air temperature during each campaign (Zhang et al. Citation2008). Zhang et al. (Citation2008) determined that, on average, NOx accounted for 50%–80% and 30%–60% of NOy during the cold seasons and warm/hot seasons, respectively; PAN, HNO3, and pNO3 each contributed up to 19% of NOy; and PPN concentrations were 15%–25% and 10%–15% of PAN during the cold seasons and warm/hot seasons, respectively.
This study addresses the two above research gaps by analyzing the observed NOy (≈ NOx + HNO3 + pNO3 + PNs + ANs) and NOz (≈ HNO3 + pNO3 + PNs + ANs) speciation and NOy partitioning in one urban location, Queens College (QC) in Flushing, New York, and one rural location, Pinnacle State Park (PSP) in Addison, NY, from September 2016 to August 2018 and June 2016 to September 2018, respectively. The analysis was conducted at both sites using continuous, hour-averaged measurements of NOx, HNO3, total pNO3, PNs, ANs, and NOy. Several steps were taken to explore the observed NOy and NOz speciation and NOy partitioning at QC and PSP in more detail. The corresponding analysis approach–-in addition to the instrument and site descriptions–-is presented below.
Instrumentation and site descriptions
The instrumentation used in this study is summarized in . NOx measurements were made using Thermo Model 42 C-Trace Level (42 C-TL) NOx analyzers equipped with photolytic converters that selectively converted NO2 to NO prior to chemiluminescent detection. NOy and HNO3 data from September 2016 to June 2018 and June 2016 to June 2018 at QC and PSP, respectively, were obtained from NOy analyzers developed by Atmospheric Research & Analysis, Inc. (ARA). These analyzers used a continuous two-channel denuder difference method to determine NOy and HNO3 concentrations (Arnold et al. Citation2007). Due to missing data for these analyzers from July--August 2018 and July--September 2018 at QC and PSP, respectively, NOy and/or HNO3 data from collocated analyzers operated by the New York State Department of Environmental Conservation (DEC) and the Atmospheric Sciences Research Center (ASRC) were used for those timeframes. Particle nitrate (pNO3) data were collected using a continuous three-channel denuder-filter difference approach (Edgerton et al. Citation2006). PNs and ANs measurements were made via a continuous three-channel thermal-dissociation photolytic difference technique that used two photolytic converters kept at different temperatures–-160 °C and 380 °C for the PNs and ANs channels, respectively-–to distinguish between PNs and ANs (Ninneman et al. Citation2017). Sampling lines from the converter boxes located on the roof to the instruments located in the climate-controlled shelter were approximately 10–15 m long.
Table 1. Instrument information for the QC and PSP speciated NOy measurements
Span and converter efficiency checks for all instrumentation were performed against a standard NO source and either a standard NO2 or isopropyl nitrate source, respectively. Converter efficiencies for NOy conversion were tested weekly, and these converters were replaced if the converter efficiency fell below 95%. Each analyzer developed by ARA was subjected to automated zero and span checks at least once a week. The zeros and spans were extracted from the data stream and used to adjust concentrations in the ARA data management system. Zero and span adjustments were linearly interpolated on a 1-minute time base to account for analyzer drift between automated calibrations. In addition, manual calibrations were performed once a month via a two-step procedure. First, 13-minute zero calibrations were performed using ultra-zero grade air from a cylinder. Second, if the analyzer readings during the 13-minute zero calibrations were stable (± 0.1 ppb), 13-minute span checks were completed. If the analyzer readings were more than ± 2% from the expected value during the span checks, the photomultiplier tube high voltage (PMTHV) was adjusted upward or downward accordingly. In contrast, the instruments maintained by DEC and ASRC were calibrated differently. Namely, weekly calibration checks and semimonthly multipoint calibrations were performed on these analyzers at QC. At PSP, weekly calibration checks and quarterly multipoint calibrations were performed on the analyzers operated by ASRC (Schwab, Spicer, and Demerjian Citation2009). Multipoint calibrations for these instruments at QC and PSP were done more frequently when warranted.
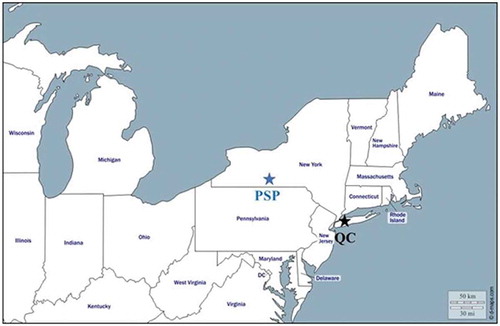
QC (40.74° N, 73.82° W) is approximately 20 m a.s.l., and it is located in the densely-populated neighborhood of Flushing in the Queens borough of New York City. Ninneman et al. (Citation2017) describes the QC site in further detail. Moreover, Schwab, Spicer, and Demerjian (Citation2009), Ninneman et al. (Citation2017), and Ninneman, Demerjian, and Schwab (Citation2019) provide a detailed description of the PSP site, so the site is briefly described here. PSP (42.09° N, 77.21° W) is approximately 504 m a.s.l., and it is located in the village of Addison, which is (1) located in southwestern New York, and (2) has a population of about 1,800 (Ninneman, Demerjian, and Schwab Citation2019; Ninneman et al. Citation2017; Schwab, Spicer, and Demerjian Citation2009). A map showing the locations of QC and PSP within New York State is given by .
Figure 2. Map of the northeast United States with the Queens College (QC, black star) and Pinnacle State Park (PSP, blue star) sites indicated (adapted from D-Maps (Citation2018))
Methodology
The observed NOy and NOz speciation and NOy partitioning at QC and PSP were assessed from September 2016 to August 2018 and June 2016 to September 2018, respectively, using hour-averaged data. Speciated NOy (NOyi) was calculated as the sum of NO, NO2, HNO3, pNO3, PNs, and ANs. Speciated NOz (NOzi) was calculated as the sum of HNO3, pNO3, PNs, and ANs. NOy was also independently measured at QC and PSP. Monthly data completeness for the above parameters was generally 80% or greater at both sites (Tables S1--S2). However, due to instrument malfunctions, there is (1) no PSP NOx data for August 2017, (2) no PNs and ANs data for QC from December 2017 to January 2018 and April 2018, (3) no continuous pNO3 data for QC and PSP from May--August 2018 and May--September 2018, respectively, and (4) no NOy and HNO3 data from July--August 2018 and July--September 2018 at QC and PSP, respectively, for the analyzers developed by ARA. In addition, the QC NOx data is missing for January 2017 due to a data logger issue.
The continuous pNO3 data gap at both sites was accounted for by using daily-average, filter-based pNO3 measurements made once every three days by the Environmental Protection Agency’s (EPA) Chemical Speciation Network (CSN). Additionally, all available continuous pNO3 data at QC and PSP were adjusted to match the filter-based pNO3 measurements since similar data adjustments have been made elsewhere (Edgerton et al. Citation2006). The procedure for adjusting the continuous pNO3 data at both sites consisted of five steps. First, the continuous pNO3 data were compared to the filter-based pNO3 data on all days from September 2016 to April 2018 at QC and June 2016 to April 2018 at PSP where there were (1) at least 18 hours of continuous pNO3 data, and (2) available filter-based pNO3 data. Second, the continuous, hour-averaged pNO3 data were converted to daily-averaged data to match the filter-based pNO3 measurements (Edgerton et al. Citation2006). Third, the data were filtered for times where the ratio of the continuous pNO3 data to the filter-based pNO3 data (pNO3,c/pNO3,f) was less than 3. This was done to focus on instances where the continuous and filter-based pNO3 data were in reasonably good agreement. Fourth, the remaining continuous and filter-based pNO3 data were used to generate scatter plots and linear regression statistics resulting from forcing the y-intercept to zero (Figures S1--S2). In this study, all linear regressions were performed using robust linear regression with bisquare weights in Matrix Laboratory (MATLAB) version R2017a, where extreme outliers in the data were neglected and mild outliers in the data were down-weighted through the use of a tuning constant (MathWorks Citation2018). Finally, the continuous pNO3 data were adjusted to match the filter-based pNO3 data based on the slopes of the linear regressions shown in Figures S1--S2. All continuous pNO3 data at QC and PSP were adjusted downward by factors of 1.3 and 1.5, respectively (Figures S1--S2).
As discussed previously, the NOy data gap was addressed by using July--August (July--September) 2018 NOy data from the NOy analyzer operated by DEC (ASRC) at QC (PSP). These NOy measurements were adjusted to match the NOy measurements from the analyzers developed by ARA due to small systematic differences well within the uncertainties of the combined measurements. These data adjustments were made for two reasons. First, since most of the analysis used measurements made by the ARA-developed analyzers, adjusting the other NOy measurements increased the consistency of the observed NOy speciation and partitioning results. Second, scatterplots of the different NOy measurements at QC (Figure S3) and PSP (Figure S4) over extended timeframes revealed that the NOy concentrations from the ARA-developed analyzers were consistently 8%–9% greater. Accordingly, the NOy measurements made by the DEC-operated (ASRC-operated) analyzer at QC (PSP) from July--August (July--September) 2018 were adjusted upward by 8.5% (9%).
Then, the observed NOy and NOz speciation and NOy partitioning at QC and PSP were analyzed by constructing monthly and seasonal stacked bar charts depicting (1) the total median concentration of speciated NOy and NOz, and (2) the median percent each individual NOy species contributed to the NOy concentration. An analysis of variance (ANOVA) statistical method was used in MATLAB to determine p-values for the monthly and seasonal median NOx, HNO3, pNO3, PNs, and ANs concentrations at both sites. These p-values tested the hypothesis that the median concentrations of the above species varied as a function of month or season. All available continuous data were used to determine NOy and NOz speciation at QC and PSP. NOy partitioning from September 2016 to November 2017 and March 2018 (June 2016 to April 2018) at QC (PSP) was assessed using coincident, continuous data. Due to multiple data gaps at QC from December 2017 to February 2018, April 2018, and June--August 2018, all available continuous data were used to calculate NOy partitioning during those periods. For May 2018 and May--September 2018 at QC and PSP, respectively, daily-averaged, filter-based pNO3 measurements made once every three days by the EPA’s CSN and coincident, continuous, and hour-averaged NOx, HNO3, PNs, ANs, and NOy data were used to calculate NOy partitioning. Therefore, data used to study NOy partitioning during those timeframes were specified to be “mostly coincident.”
It needs to be noted that (1) NOy speciation and/or partitioning at QC was not studied for February and November 2017 due to suspect NOy and NOx data, respectively, and (2) the QC NOx data for February 2018 were adjusted by a factor of 0.8 to reflect a change in the NOx analyzer’s NO coefficient. Additionally, NOy speciation and partitioning at PSP were not studied for August 2017 due to suspect NOx data. To explore the differences in the NOy speciation and partitioning in urban versus rural New York State, the monthly and seasonal median NOx to NOy ratio (NOx/NOy) was examined from September 2016-August 2018 and June 2016-September 2018 at QC and PSP, respectively. For both sites, discussion will mostly focus on the seasonal median NOy and NOz speciation, NOy partitioning, and NOx/NOy ratio results.
The diurnal variability in the seasonal median NOy and NOz speciation and NOy partitioning at QC and PSP were examined to further elucidate the fate of NOy. These analyses were done for seasons when (1) there was good data completeness and (2) all continuous measurements were made. The seasons that met the two above requirements at QC (PSP) were spring 2017, summer 2017, and fall 2016–2017 (spring 2017, summer 2016–2017, fall 2016–2017, and winter 2016/7–2017/8). For all seasonal analyses in this study, the months corresponding to the spring, summer, fall, and winter seasons were March--May, June--August, September--November, and December--February, respectively.
Due to the number and complexity of the speciated NOy measurements made at both sites, the measurement uncertainties were estimated to support their validity. Two steps were taken to estimate the measurement uncertainties for QC and PSP. First, the Allan variance–-a method of quantifying the noise within a measurement signal over time (e.g., Stein Citation1985)-–was used to help estimate the uncertainty of the NO, NO2, HNO3, pNO3, PNs, ANs, and NOy measurements during stable periods at PSP. Stable periods corresponded to instances when ambient NOyi and NOy concentrations changed by less than ± 0.2 ppb for 4 hours or longer within the June 2016 to July 2017 timeframe, and they were only found for PSP since the site is relatively unaffected by fresh, local emissions. Nonetheless, since (1) the analyzers used to measure the individual NOy species and the total NOy were identical at QC and PSP, and (2) the maintenance performed on the instrumentation was identical at both sites, the Allan variances found for PSP data were assumed to also apply to QC data. To estimate the Allan variance for each NOy species at PSP, 5-minute averaged HNO3, pNO3, PNs, ANs, and NOy data were converted to 10, 15, 20, 25, 30, 35, 40, 45, 50, 55, and 60-minute averaged data for the 8–10 stable periods found for each species. The same was done for the 1-minute averaged NO and NO2 data, except that it was first converted to 5-minute averaged data. Next, the Allan variance was calculated and plotted as a function of the averaging time for all stable periods by using the following equation (Allan Citation1999):
where AV is the Allan variance, y is the chemical species of interest, ∆y is the change in concentration, represented here by y over the averaging period (i.e., ∆y = yt+1 – yt), and is the average of the square of each change of y over the averaging time period. Based on visual inspection of the initial Allan variance plots, a second Allan variance plot was generated for NO, HNO3, PNs, ANs, and NOy that showed only the stable periods that (1) exhibited a consistent relationship between the Allan variance and the averaging time, and (2) consisted of measurements that were likely above the method detection limit (MDL). For clarity, these stable periods were denoted as “selected stable periods.” Then, the percent error was computed using the following equations:
where k is the confidence factor, which was defined to be 3 (covering 99% of the variance for normally distributed data), and is the average concentration of the NOy species of interest during the selected stable periods. Ultimately, the percent errors calculated using EquationEquation (3)
(3)
(3) were averaged for each species to estimate part of each measurement’s uncertainty. An example of how the Allan variance, the MDL, and the percent error were calculated for HNO3 is given by Figure S5 and Table S3 to further show how the above approach was carried out, and the estimated MDLs for hour-averaged NOyi and NOy are given in .
Table 2. Estimated method detection limit (MDL) and overall uncertainty for each measured NOy species. The estimated MDLs and overall uncertainties apply to hour-averaged data
Second, three other factors were considered in the estimation of the speciated and total NOy measurement uncertainties. These included (1) analyzer-to-analyzer variability, (2) the aforementioned scaling of continuous pNO3 to adjusted values, and (3) the contribution from the calibration standard and dynamic dilution. Analyzer-to analyzer variability was assumed to be ± 5% for all measurements based on the findings of Sun, Wang, and Zhang (Citation2010), and the uncertainty due to the calibration standard and dynamic dilution was assumed to be ± 2% and ± 4%, respectively, for all measurements. Meanwhile, the average percent error and the average MDL for the continuous pNO3 data at QC and PSP were adjusted upward by a factor of 1.3 and 1.5, respectively, consistent with the slopes found after taking the linear regression of continuous pNO3 versus filter-based pNO3 and forcing the y-intercept to zero (Figures S1-S2). shows the estimated overall uncertainties found for the hour-averaged speciated and total NOy measurements made at QC and PSP after adding the above factors in quadrature.
Results
Queens College
The seasonal and monthly median speciated NOy (NOz) concentrations at QC are shown in and S6a (3b and S6b), respectively. The numerical values and the data completeness of the monthly speciated NOy concentrations are given in Table S1. Median NOx concentrations at QC showed statistically significant seasonal and monthly variability (p < .01; and S4), and they were about 17–18 ppb during the winter seasons, 8–12 ppb during the spring, summer, and fall seasons, and 10.99 ppb across all seasons ( and ). The larger median wintertime NOx concentration at QC was expected due to the combined effect of lower temperatures, lower planetary boundary layer heights, and anthropogenic NOx emissions.
Table 3. All-season median NOy speciation, p-values for the seasonal median NOx, HNO3, pNO3, PNs, and ANs concentrations that were determined using an analysis of variance (ANOVA) statistical method, and all-season median NOy partitioning at QC and PSP
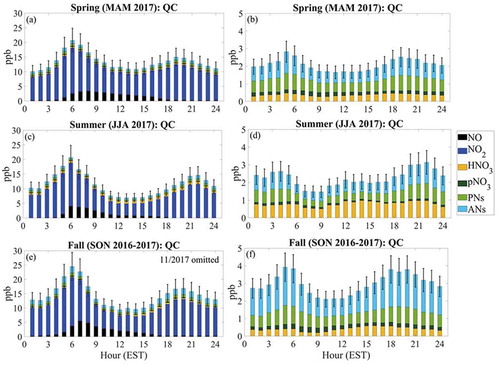
Figure 3. Seasonal median speciated (a) NOy concentrations and (b) NOz concentrations at QC from September 2016 to August 2018. Data that are 50%–75% complete (DJF 2017/8 pNO3; MAM 2018 PNs and ANs) and less than 50% complete (DJF 2017/8 PNs and ANs; MAM 2018 pNO3; JJA 2018 HNO3) are denoted by the red and purple hatching, respectively. (c) Seasonal median NOy partitioning at QC from September 2016 to August 2018. The dashed red line denotes 100% closure of the NOy budget, and the x-axis is color-coded according to data usage. Reasons for missing data in (a) and (c) are outlined in the Methodology. See Table S1 for monthly numerical values and data completeness, respectively. In all figures, the combined uncertainty of the measurements is given by the black error bars
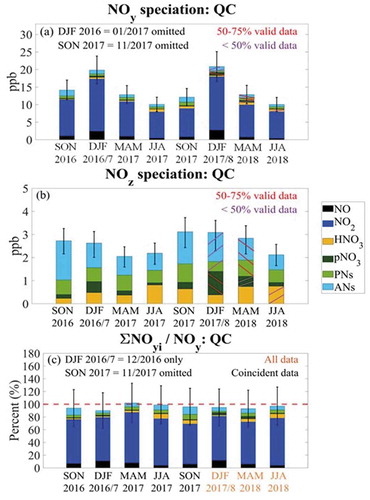
Seasonal and monthly variability in the NOz species were also evaluated to gain insight into the underlying chemistry. reveals that the median concentration of NOzi (≈ HNO3 + pNO3 + PNs + ANs) showed little seasonality, with values ranging from approximately 2–3 ppb during all seasons. Seasonal and monthly variability in the HNO3 concentration at QC were not statistically significant, with p-values of 0.37 and 0.63, respectively ( and S4). Still, shows that HNO3 concentrations were highest during summer, consistent with active photochemical processing of NOx in warm, sunlit conditions (e.g., Blanchard and Hidy Citation2018). Although the seasonal and monthly variability in pNO3 were not statistically significant at the 95% confidence level ( and S4), pNO3 concentrations were noticeably greater during winter (). This was expected since higher pNO3 concentrations typically occur at lower temperatures (e.g., Seinfeld and Pandis Citation2016). Monthly median concentrations of PNs exhibited a relatively small range (approximately 0.88 ppb; Table S1), with maximum and minimum values occurring in September 2016 and November 2016, respectively. Nonetheless, the seasonality and the monthly variability of the PNs concentrations shown in and S6b were modestly significant ( and S4), though not at the 95% confidence level. ANs concentrations were greatest during fall ( and S6b), and the seasonality and month-to-month variability in ANs were statistically significant (p = .01) and modestly significant (p = .13), respectively, at the 95% confidence level ( and S4).
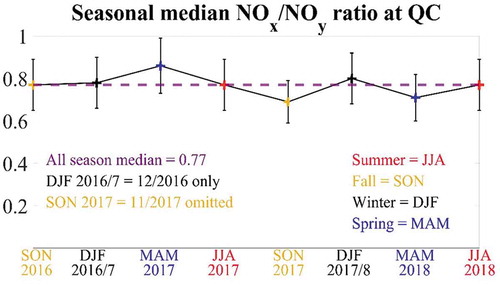
Seasonal and monthly median NOy partitioning at QC are given by and S6c, respectively. The numerical values of the monthly percent contributions of each measured NOy species to the NOy concentration are shown in Table S1. and demonstrate that NOyi (≈ NOx + HNO3 + pNO3 + PNs + ANs) constituted most of the ambient NOy at QC. Over all seasons, the median NOy concentration was composed of 6% NO, 71% NO2, 4% HNO3, 2% pNO3, 5 % PNs, and 7% ANs (). Therefore, NOyi made up 95% of NOy (). Any deviations from 100% closure are well within the estimated measurement uncertainties (), which further indicates excellent closure of the NOy budget at QC. Moreover, , S6c, S7, and show that NOx was the dominant component of NOy at QC. Specifically, the seasonal median NOx/NOy ratio at QC was about 0.8 across all seasons, and it showed little seasonal variability (). Overall, the seasonal median NOx/NOy ratios at QC shown in are representative of a site that is impacted by fresh emissions.
Figure 4. Seasonal median NOx/NOy ratio at QC from September 2016-August 2018. The dashed purple line denotes the median NOx/NOy ratio for the full measurement period. Reasons for missing data are outlined in the Methodology, and see Table S1 for monthly numerical values and data completeness, respectively. The combined uncertainty of the NO, NO2, and NOy measurements is given by the black error bars
The diurnal variability in the seasonal median NOy and NOz speciation at QC for spring 2017, summer 2017, and fall 2016–2017 is shown in . Peak NOx concentrations occurred in the morning and early evening, which was likely due to increased emissions from vehicular traffic (e.g., Roberts-Semple, Song, and Gao Citation2012). In addition, the diurnal pattern of NO varied seasonally. , c, and e show that daytime NO concentrations declined more slowly during spring compared to summer and fall. This suggests that the decay rate of fresh emissions differed as a function of season. The diurnal variation of NOzi was generally consistent across the spring, summer, and fall seasons, further indicating that NOy speciation at QC is dominated by NOx. However, it is important to note that nighttime concentrations of ANs were approximately 1 ppb greater during fall compared to spring and summer (, d, and f). Since ANs are often permanent NOx sinks (e.g., Farmer et al. Citation2011), the higher nighttime ANs concentrations during fall may have implications for next-day O3 production at QC. Studying the impact of NOz speciation on O3 production is an important area of future work that will be discussed in more detail later.
Figure 5. (a) The diurnal variation of the hourly median NOy speciation at QC during spring 2017. (b) The diurnal variation of the hourly median NOz speciation at QC during spring 2017. (c) Same as (a), except for summer 2017. (d) Same as (b), except for summer 2017. (e) Same as (a) and (c), except for fall 2016–2017. (f) Same as (b) and (d), except for fall 2016–2017. In all figures, the combined uncertainty of the measurements is given by the black error bars
Pinnacle State Park
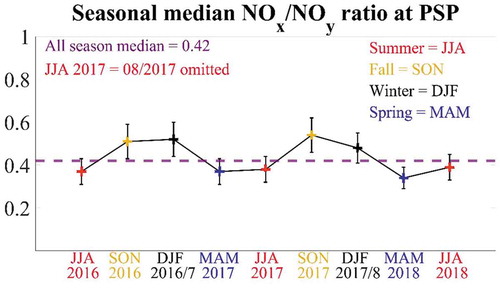
(6b) and S8a (S8b) show the seasonal and monthly median speciated NOy (NOz) concentrations, respectively, at PSP. The numerical values and the data completeness of the monthly speciated NOy concentrations are provided in Table S2, and the all-season median speciated NOy concentrations are shown in . According to , median NOx, HNO3, pNO3, PNs, and ANs concentrations at PSP were 0.65, 0.16, 0.12, 0.13, and 0.18 ppb, respectively, across all seasons. In addition, reveals that the median NOzi concentration at PSP was about two times greater in winter compared to summer. This difference was influenced by relatively significant seasonality (p = .06) and strongly significant monthly variability (p < .01) in pNO3 ( and S4), which had wintertime (summertime) concentrations of approximately 0.35 (0.03) ppb (). It is also noteworthy that the pNO3 concentration during spring 2018 was comparable to those measured during the winter seasons (). Since higher pNO3 concentrations are expected at lower temperatures (e.g., Seinfeld and Pandis Citation2016), this may be partially due to the similar median temperatures of approximately 4, −1, and −3 °C at PSP during spring 2018, winter 2016/7, and winter 2017/8, respectively (not shown). In addition, the seasonal variability in NOzi indicates that the fraction of NOx oxidized to NOz in airmasses arriving at PSP varied across seasons. This is explicitly shown in and S9, which depict the seasonal and monthly median NOx/NOy ratio, respectively, at PSP. shows that the median NOx/NOy ratio was (1) about 0.3–0.4 in spring and summer, (2) about 0.5–0.6 in fall and winter, and (3) about 0.4 across all seasons. Overall, the lower NOx/NOy ratios at PSP are consistent for a rural location that is mainly affected by photochemically aged air masses, rather than fresh emissions.
Figure 6. Seasonal median speciated (a) NOy and (b) NOz concentrations at PSP from June 2016 to August 2018. Data that are 50%–75% complete (MAM 2018 pNO3) are denoted by the red hatching. (c) Seasonal median NOy partitioning at PSP from June 2016 to August 2018. The dashed red line denotes 100% closure of the NOy budget, and the x-axis is color-coded according to data usage. Reasons for missing data in (a) and (c) are outlined in the Methodology. See Table S2 for numerical values and data completeness, respectively. In all figures, the combined uncertainty of the measurements is given by the black error bars
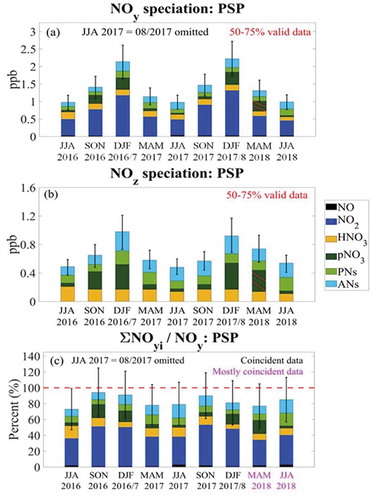
Figure 7. Seasonal median NOx/NOy ratio at PSP from June 2016 to August 2018. The dashed purple line denotes the median NOx/NOy ratio for the full measurement period. Reasons for missing data are outlined in the Methodology, and see Table S2 for numerical values and data completeness, respectively. The combined uncertainty of the NO, NO2, and NOy measurements is given by the black error bars
Even though the median NOx/NOy ratio varied seasonally and monthly ( and S9), the statistical significance of the seasonal and monthly variation in the individual NOy species differed ( and S4). Similar to QC, NOx showed statistically significant seasonal and monthly variability (p < .01; and S4) at PSP, with higher concentrations during winter ( and S8a). Seasonality and monthly variability in HNO3 were statistically insignificant ( and S4), and concentrations deviated little from the all-season median value of 0.16 ppb ( and S8b and ). As described above, seasonal variability in pNO3 was relatively significant (p = .06; ); month-to-month variability was strongly significant (p < .01; Table S4); and concentrations were highest during colder months and seasons (Figures S8b and 6b). PNs showed no clear seasonal or monthly trend ( and S8b and and S4). Finally, seasonal and monthly variability in ANs were modestly significant ( and S4), with maximum concentrations during winter ( and S8b).
and S8c show the seasonal and monthly median NOy partitioning, respectively, at PSP. The numerical values of the monthly percent contributions of each NOy species to the NOy concentration are provided in Table S2. and illustrate that NOyi generally accounted for most of the ambient NOy, with NOy consisting of 2% NO, 40% NO2, 10% HNO3, 8% pNO3, 9% PNs, and 12% ANs across all seasons. As a result, NOyi represented 81% of the total NOy at PSP (). However, it is noteworthy that the NOy budget closure at PSP appeared to vary seasonally (). Namely, indicates that NOyi made up approximately 80%–95% of NOy during fall and winter, and approximately 75%–85% of NOy during spring and summer. Although the observed NOy budget shortfall at PSP may simply be due to measurement uncertainties ( and S8c), potential reasons for the shortfall during spring and summer will be discussed in the next section.
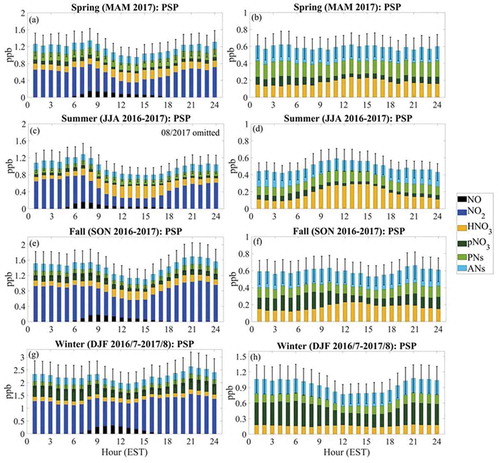
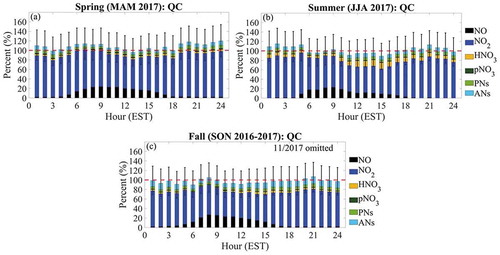
The diurnal pattern in the seasonal median NOy and NOz speciation at PSP for spring 2017, summer 2016–2017, fall 2016–2017, and winter 2016/7–2017/8 is given by . In spring, summer, and fall, NOx levels were higher at night due to a combination of lower nighttime mixing heights and daytime photochemistry (, c, and e). Meanwhile, wintertime NOx levels were higher than those during spring, summer, and fall, with concentrations ranging from 1.1–1.6 ppb for all hours of the day (). The higher wintertime NOx concentrations were likely due to the combined effect of lower temperatures, lower mixing heights, and reduced photochemical activity (e.g., Schwab, Spicer, and Demerjian Citation2009). Additionally, the diurnal variation of HNO3 during spring, summer, and fall indicates that greater photochemical processing and HNO3 production occurs in airmasses arriving at PSP during those seasons (, d, and f). This is because HNO3 concentrations are maximized in the early afternoon, particularly during summer (). also shows that nighttime HNO3 concentrations are non-negligible (i.e., 0.09 ppb or greater) during all seasons. This suggests that nighttime HNO3 sources, such as heterogeneous hydrolysis of N2O5 or the reaction of NO3 with hydrocarbons, are likely present at PSP. Finally, the higher nighttime pNO3 concentrations during winter demonstrate how nitrate partitions into the particle phase at low temperatures (; e.g., Seinfeld and Pandis Citation2016).
Figure 8. (a) The diurnal variation of the hourly median NOy speciation at PSP during spring 2017. (b) The diurnal variation of the hourly median NOz speciation at PSP during spring 2017. (c) Same as (a), except for summer 2016–2017. (d) Same as (b), except for summer 2016–2017. (e) Same as (a) and (c), except for fall 2016–2017. (f) Same as (b) and (d), except for fall 2016–2017. (g) Same as (a), (c), and (e), except for winter 2016/7–2017/8. (h) Same as (b), (d), and (f), except for winter 2016/7–2017/8. In all figures, the combined uncertainty of the measurements is given by the black error bars
Discussion and potential implications
The results presented above show that NOy speciation at QC is (1) NOx-dominant during all seasons, and (2) comprised of NOzi that exhibits little seasonal variability (). Across all seasons, median NOx concentrations were 10.99 ppb and median NOzi concentrations were 2.29 ppb, yielding a NOyi concentration of 13.28 ppb (). Overall, the NOx-dominant nature of NOy speciation at QC was expected since the site is in an urban location surrounded by several major roadways and large emissions sources (e.g., Ninneman et al. Citation2017). In addition, the speciated NOy measurements account for most of the ambient NOy concentration at QC during all seasons (), with NOyi constituting 95% of the NOy concentration (). As mentioned previously, departures from 100% closure are well-explained by the measurement uncertainties (). This indicates that NOyi is a good representation of NOy speciation at QC.
demonstrates that the seasonal median NOx/NOy ratio at PSP ranged from approximately 0.3–0.4 (0.5–0.6) during spring and summer (fall and winter). This implies that the air is more oxidized during the warmer seasons. However, and b show that both NOx and NOzi concentrations are higher during the winter. Higher wintertime NOzi concentrations may be due in part to (1) greater availability of NOx, (2) the formation channels of pNO3, PNs, and ANs occurring through HNO3, and/or (3) reduced thermal decomposition of PNs. Additionally, median NOx and NOzi concentrations were approximately 0.65 and 0.59 ppb, respectively, at PSP across all seasons (). This resulted in a median NOyi concentration of 1.24 ppb that was approximately an order of magnitude less than what was measured at QC (). The lower NOyi concentrations may partially explain why NOyi did not account for as much of NOy at PSP compared to QC, particularly during spring and summer (). This is because the speciated NOy concentrations at PSP are closer to the MDL than those at QC (). Still, NOyi accounted for 81% of NOy across all seasons at PSP (), and deviations from 100% closure can mostly be explained by the measurement uncertainties ( and S8c).
Nonetheless, reveals that more noticeable NOy budget shortfalls occasionally occurred at PSP during spring and summer. Consequently, it was hypothesized that these larger NOy budget shortfalls may have been due in part to unmeasured NOy species. To test this hypothesis, the hourly median NOy partitioning was plotted as a function of time of day on a seasonal basis for the seasons when (1) data completeness was high and (2) all the continuous measurements were available (). For completeness, the same was done for QC (). shows that the NOy budget shortfall at PSP was maximized during summer from mid-morning to mid-afternoon, which suggests that photochemical processes led to the formation of the unidentified NOy (e.g., Hayden et al. Citation2003). For example, it is possible that isoprene oxidation by OH in the presence of NOx formed various isoprene nitrates (e.g., hydroxyalkyl nitrates; Grossenbacher et al. Citation2001) that were not fully detected by the instrument that measured PNs and ANs. also indicates that HONO, gas-phase NO3, N2O5, and ClNO2 were unimportant contributors to the unmeasured NOy since they are (1) photolyzed rapidly during daytime, and (2) typically maximized at night (e.g., Brown et al. Citation2006; Singh et al. Citation2007). If the above species constituted a significant fraction of the unmeasured NOy at PSP, then a maximum (minimum) in the NOy budget shortfall would be expected during nighttime (daytime), which is the opposite of what is shown in . Furthermore, since pNO3 concentrations were less than 0.05 ppb during the warm seasons ( and Table S2), using the unadjusted continuous pNO3 data would have accounted for little of the approximately 20%–30% shortfall observed in spring and summer during daytime ( and b). Future studies are needed to determine what led to the NOy budget shortfalls that sometimes occurred at PSP. Meanwhile, shows that NOyi is representative of the diurnal pattern of ambient NOy at QC.
Figure 9. The diurnal variation of the hourly median NOy partitioning at PSP during selected seasons. The dashed red line denotes 100% closure of the NOy budget, and the combined uncertainty of the measurements is given by the black error bars
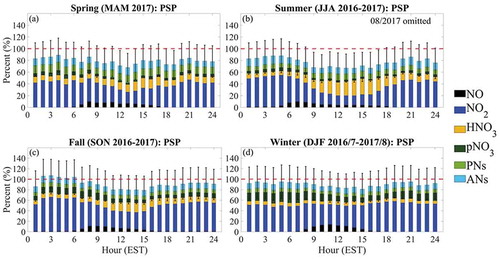
Figure 10. The diurnal variation of the hourly median NOy partitioning at QC during selected seasons. The dashed red line denotes 100% closure of the NOy budget, and the combined uncertainty of the measurements is given by the black error bars
Previous work has shown that the seasonality of light ANs follows the seasonality of their dominant parent hydrocarbons (HCs; e.g., Russo et al. Citation2010). , 6b, S6b, and S8b indicate that concentrations of ANs at QC and PSP were maximized during the fall and winter, respectively. Overall, maximum ANs concentrations during the colder seasons were expected for QC, but not for PSP. This is because a fall or winter maximum in ANs suggests that they are mainly derived from anthropogenic HC emissions rather than biogenic HC emissions. One factor that may have affected the seasonal variability in ANs at PSP is that the site is located in the Marcellus Shale region, where extensive oil and natural gas (O&NG) operations occur. O&NG operations are known to be a source of anthropogenic HCs (e.g., ethane, propane, etc.; Ren et al. Citation2019; Vinciguerra et al. Citation2015). As a result, anthropogenic HC emissions from O&NG operations may have partially contributed to the seasonality in ANs at the PSP site, and future studies are needed to either support or refute this hypothesis.
An additional limitation regarding this study also needs to be noted. Namely, the analyzers that measured PNs, ANs, and pNO3 were not species-specific (Edgerton et al. Citation2006; Ninneman et al. Citation2017). By only measuring total PNs, ANs, and pNO3 concentrations, the concentrations of speciated PNs, ANs, and pNO3 and their contributions to the NOy concentration could not be assessed. Hence, future NOy speciation and partitioning studies at QC and PSP should consider using different measurement techniques to (1) detect individual PN, AN, and pNO3 species, (2) further elucidate the fate of NOy, and (3) explore what may have contributed to the occasional NOy budget shortfalls found at PSP during spring and summer. Examples of such techniques include gas chromatography/electron capture detection (GC/ECD; Flocke et al. Citation2005; Roberts Citation2007) or chemical ionization mass spectrometry (CIMS; Beaver et al. Citation2012; St. Clair et al. Citation2010).
Despite the limitations and shortcomings described above, the estimated MDLs and uncertainties () show that the continuous, speciated NOy data collected at QC and PSP were sufficiently robust to analyze NOy and NOz speciation and NOy partitioning over multiple years, thereby addressing the research gaps identified in the Introduction. The data can also be compared to selected observational NOy speciation and partitioning studies conducted previously at different locations. This is shown in Table S5, which summarizes the observed NOy budget closure found from the early 1990s to the present. However, the combination of (1) few of the previous studies being done recently, (2) differences in measurement methods, measurement suites, and how the results were reported, and (3) the lack of previous work done in urban areas, make direct and detailed comparisons between the NOy budget closure found by this study versus previous studies difficult (Table S5). Still, a comparison of the PSP NOy concentration to those reported by Parrish et al. (Citation1993), Aneja et al. (Citation1996), and Hayden et al. (Citation2003) reveals that the NOy concentration has declined in rural eastern North America over the past 20–30 years (Table S5). This is consistent with reductions in NOx concentrations and NOx emissions found over a similar timeframe in the continental United States (e.g., Civerolo et al. Citation2017; Hidy and Blanchard Citation2015). Moreover, the extensive speciated NOy datasets for QC and PSP will be useful for future O3 assessments, and both datasets can be used in a variety of future studies. For example, future studies can examine the impact of NOz speciation on the O3 production regime at QC and PSP using (1) the speciated NOz data, (2) O3 data that are collected at both sites, and (3) an air quality model (e.g., the Community Multiscale Air Quality (CMAQ) model). Such future work will be important since previous studies have indicated that rural New York is in a NOx-sensitive O3 production regime, while New York City is likely trending toward NOx sensitivity (e.g., Jin et al. Citation2017). Thus, it is becoming increasingly important to understand how the different NOz species affect O3 production and loss, and these speciated NOy datasets for QC and PSP will be useful in gaining such an understanding.
Conclusion
This study assessed observed NOy and NOz speciation and NOy partitioning at one urban site, QC in New York City, and one rural site, PSP in Addison, NY, from September 2016-August 2018 and June 2016-September 2018, respectively. All-season median NOx, HNO3, pNO3, PNs, ANs, and NOy concentrations at QC (PSP) were 10.99 (0.65), 0.49 (0.16), 0.24 (0.12), 0.62 (0.13), 0.94 (0.18), and 13.95 (1.56) ppb, respectively (). The predominance of NOx relative to NOyi at QC was characteristic of a site that is frequently impacted by fresh emissions, while the higher fraction of NOz at PSP was characteristic of a rural site that is typically affected by photochemically aged air masses. In addition, all-season median percent contributions of the NOx, HNO3, pNO3, PNs, and ANs concentrations to the NOy concentration at QC (PSP) were 77 (42), 4 (10), 2 (8), 5 (9), and 7 (12) %, respectively (). Consequently, NOyi comprised 95% and 81% of the NOy at QC and PSP, respectively, across all seasons (). At both sites, departures from 100% NOy budget closure are either fully or largely explained by the estimated measurement uncertainties. This implies that both datasets were sufficiently robust to evaluate seasonal and monthly NOy and NOz speciation and NOy partitioning. Overall, the results presented here are illustrative of the possibilities still available to us with both of these unique datasets. For example, future work can use the speciated NOy datasets at QC and PSP to (1) study the effect of NOz speciation on the O3 production regime and/or (2) evaluate air quality model performance. Such future research can further improve our understanding of the fate of NOy and its impact on local and regional air quality in urban and rural New York State.
Data availability
The data used in this paper are available from a web‐accessible data archive that is cited in the References (Schwab et al. Citation2018). The link to the data archive is http://atmoschem.asrc.cestm.albany.edu.
Supplemental Material
Download MS Word (2.9 MB)Acknowledgment
The authors acknowledge the contributions of Mike Christophersen and Santosh Mahat at QC, John Spicer at PSP, and ARA engineers Brad Gingrey and Chad Haker. Brian Crandall produced the finalized ASRC NOx, NOy, and HNO3 data for PSP.
Disclosure statement
The authors declare that they have no conflict of interest.
Supplementary material
Supplemental data for this article can be accessed on the publisher’s website.
Additional information
Funding
Notes on contributors
Matthew Ninneman
Matthew Ninneman earned his bachelor’s degree from North Carolina State University in 2015. He is a PhD student advised by Drs. James Schwab and Sarah Lu at the State University of New York at Albany. His research is focused on examining ozone and reactive oxidized nitrogen chemistry in the northeast United States.
Joseph Marto
Joseph Marto earned his bachelor’s degree from Skidmore College in 2014. He is a Ph.D. student advised by Dr. James Schwab at the State University of New York at Albany. His research is focused on examining new particle formation and growth events in the northeast United States.
Stephanie Shaw
Stephanie Shaw, Ph.D., is a Technical Executive at the Electric Power Research Institute where she assesses the environmental impacts of fossil and renewable energy generation and storage. Dr. Shaw has more than 20 years of experience in the areas of greenhouse gas and criteria pollutant emissions and air quality impacts from energy, industrial, and natural sources determined through laboratory and field measurements.
Eric Edgerton
Eric Edgerton helped found Atmospheric Research & Analysis, Inc. (ARA) in 1997. ARA is an air quality consulting firm that is focused on high-quality, research-grade air quality monitoring and data analysis. Mr. Edgerton currently serves as the company’s president.
Charles Blanchard
Charles Blanchard is an independent consultant specializing in receptor modeling and the statistical analysis of air quality measurements. He received a Ph.D. and an M.S. in Energy and Resources and an M.A. in Statistics from the University of California, Berkeley.
James Schwab
James Schwab is a Research Professor and Senior Research Associate with the Atmospheric Sciences Research Center at the University at Albany. His research group studies atmospheric chemistry and air pollution, with an emphasis on policy-relevant scientific work. His research team makes continuous and ongoing measurements of air pollution at locations across New York State. His stations in the Adirondacks and Southern Tier have been continuously monitoring for thirty-plus and almost twenty-five years, respectively. He has also been involved in and organized field campaigns and projects to measure chemically important trace gases and aerosols, mainly across New York State.
References
- Allan, D. W. 1999. The allan variance. http://www.allanstime.com/AllanVariance/.
- Aneja, V. P., D.-S. Kim, M. Das, and B. E. Hartsell. 1996. Measurements and analysis of reactive nitrogen species in the rural troposphere of Southeast United States: Southern oxidant study site SONIA. Atmos. Environ. 30:649–59. doi:https://doi.org/10.1016/1352-2310(95)00294-4.
- Arnold, J. R., B. E. Hartsell, W. T. Luke, S. M. Rahmat Ullah, P. K. Dasgupta, L. G. Huey, and P. Tate. 2007. Field test of four methods for gas-phase ambient nitric acid. Atmos. Environ. 41:4210–26. doi:https://doi.org/10.1016/j.atmosenv.2006.07.058.
- Beaver, M. R., J. M. St. Clair, F. Paulot, K. M. Spencer, J. D. Crounse, B. W. LaFranchi, K. E. Min, S. E. Pusede, P. J. Wooldridge, G. W. Schade, et al. 2012. Importance of biogenic precursors to the budget of organic nitrates: Observations of multifunctional organic nitrates by CIMS and TD-LIF during BEARPEX 2009. Atmos. Chem. Phys. 12:5773–85. doi:https://doi.org/10.5194/acp-12-5773-2012.
- Benedict, K. B., A. J. Prenni, A. P. Sullivan, A. R. Evanoski-Cole, E. V. Fischer, S. Callahan, B. C. Sive, Y. Zhou, B. A. Schichtel, J. L. Collett Jr, et al. 2018. Impact of front range sources on reactive nitrogen concentrations and deposition in Rocky Mountain National Park. PeerJ 6:e4759. doi:https://doi.org/10.7717/peerj.4759.
- Blanchard, C. L., and G. M. Hidy. 2018. Ozone response to emission reductions in the southeastern United States. Atmos. Chem. Phys. 18:8183–202. doi:https://doi.org/10.5194/acp-18-8183-2018.
- Brown, S. S., T. B. Ryerson, A. G. Wollny, C. A. Brock, R. Peltier, A. P. Sullivan, and F. C. Fehsenfeld 2006. Variability in nocturnal nitrogen oxide processing and its role in regional air quality. Science 311:67–70. doi:https://doi.org/10.1126/science.1120120.
- Browne, E. C., and R. C. Cohen. 2012. Effects of biogenic nitrate chemistry on the NOx lifetime in remote continental regions. Atmos. Chem. Phys. 12:11917–32. doi:https://doi.org/10.5194/acp-12-11917-2012.
- Buhr, M. P., D. D. Parrish, R. B. Norton, F. C. Fehsenfeld, R. E. Sievers, and J. M. Roberts. 1990. Contribution of organic nitrates to the total reactive nitrogen budget at a rural eastern U.S. site. J. Geophys. Res. 95:9809–16. doi:https://doi.org/10.1029/JD095iD07p09809.
- Chen, X., H. Wang, and K. Lu. 2018. Simulation of organic nitrates in Pearl River Delta in 2006 and the chemical impact on ozone production. Sci. China Earth Sci. 61:228–38. doi:https://doi.org/10.1007/s11430-017-9115-5.
- Civerolo, K. L., O. V. Rattigan, H. D. Felton, and J. J. Schwab. 2017. Changes in gas-phase air pollutants across New York State, USA. Aerosol. Air Qual. Res. 17:147–66. doi:https://doi.org/10.4209/aaqr.2016.04.0141.
- Crutzen, P. J. 1979. The role of NO and NO2 in the chemistry of the troposphere and stratosphere. Annu. Rev. Earth Planet Sci. 7:443–72. doi:https://doi.org/10.1146/annurev.ea.07.050179.002303.
- Day, D. A., M. B. Dillon, P. J. Wooldridge, J. A. Thornton, R. S. Rosen, E. C. Wood, and R. C. Cohen. 2003. On alkyl nitrates, O3, and the “missing NOy”. J. Geophys. Res. 108:4501. doi:https://doi.org/10.1029/2003JD003685.
- D-Maps. 2018. D-maps.com: Free maps. https://d-maps.com/carte.php?num_car=24606&lang=en.
- Edgerton, E. S., B. E. Hartsell, R. D. Saylor, J. J. Jansen, D. A. Hansen, and G. M. Hidy. 2006. The Southeastern aerosol research and characterization study, Part 3: Continuous measurements of fine particulate matter mass and composition. J. Air Waste Manage. Assoc. 56:1325–41. doi:https://doi.org/10.1080/10473289.2006.10464585.
- Farmer, D. K., A. E. Perring, P. J. Wooldridge, D. R. Blake, A. Baker, S. Meinardi, L. G. Huey, D. Tanner, O. Vargas, R. C. Cohen, et al. 2011. Impact of organic nitrates on urban ozone production. Atmos. Chem. Phys. 11:4085–94. doi:https://doi.org/10.5194/acp-11-4085-2011.
- Flocke, F. M., A. J. Weinheimer, A. L. Swanson, J. M. Roberts, R. Schmitt, and S. Shertz. 2005. On the measurement of PANs by gas chromatography and electron capture detection. J. Atmos. Chem. 52:19–43. doi:https://doi.org/10.1007/s10874-005-6772-0.
- Grossenbacher, J. W., T. Couch, P. B. Shepson, T. Thornberry, M. Witmer-Rich, M. A. Carroll, I. Faloona, D. Tan, W. Brune, K. Ostling, et al. 2001. Measurements of isoprene nitrates above a forest canopy. J. Geophys. Res. 106:24429–38. doi:https://doi.org/10.1029/2001JD900029.
- Harrison, R. M., J. L. Grenfell, S. Yamulki, K. C. Clemitshaw, S. A. Penkett, J. N. Cape, and G. G. McFadyen. 1999. Budget of NOy species measured at a coastal site. Atmos. Environ. 33:4255–72. doi:https://doi.org/10.1016/S1352-2310(99)00176-4.
- Hayden, K. L., K. G. Anlauf, D. R. Hastie, and J. W. Bottenheim. 2003. Partitioning of reactive atmospheric nitrogen oxides at an elevated site in southern Quebec, Canada. J. Geophys. Res. 108:4603. doi:https://doi.org/10.1029/2002JD003188.
- Hidy, G. M., and C. L. Blanchard. 2015. Precursor reductions and ground-level ozone in the continental United States. J. Air Waste Manage. Assoc. 65:1261–82. doi:https://doi.org/10.1080/10962247.2015.1079564.
- Horii, C. V., J. W. Munger, S. C. Wofsy, M. Zahniser, D. Nelson, and J. B. McManus. 2005. Atmospheric reactive nitrogen concentration and flux budgets at a Northeastern U.S. forest site. Agric. For. Meteorol. 133:210–25. doi:https://doi.org/10.1016/j.agrformet.2004.08.009.
- Jin, X., A. M. Fiore, L. T. Murray, L. C. Valin, L. N. Lamsal, B. Duncan, and G. S. Tonnesen. 2017. Evaluating a space-based indicator of surface Ozone-NOx-VOC sensitivity over midlatitude source regions and application to decadal trends. J. Geophys. Res. 122:10439–61. doi:https://doi.org/10.1002/2017JD026720.
- Li, J., J. Mao, A. M. Fiore, R. C. Cohen, J. D. Crounse, A. P. Teng, P. O. Wennberg, B. H. Lee, F. D. Lopez-Hilfiker, J. A. Thornton, et al. 2018. Decadal changes in summertime reactive oxidized nitrogen and surface ozone over the Southeast United States. Atmos. Chem. Phys. 18:2341–61. doi:https://doi.org/10.5194/acp-18-2341-2018.
- Li, Q., L. Zhang, T. Wang, Y. J. Tham, R. Ahmadov, L. Xue, Q. Zhang, J. Zheng. 2016. Impacts of heterogeneous uptake of dinitrogen pentoxide and chlorine activation on ozone and reactive nitrogen partitioning: Improvement and application of the WRF-Chem model in southern China. Atmos. Chem. Phys. 16:14875–90. doi:https://doi.org/10.5194/acp-16-14875-2016.
- MathWorks. 2018. Robustfit: Robust regression. https://www.mathworks.com/help/stats/robustfit.html.
- Murphy, J. G., D. A. Day, P. A. Cleary, P. J. Wooldridge, and R. C. Cohen. 2006. Observations of the diurnal and seasonal trends in nitrogen oxides in the western Sierra Nevada. Atmos. Chem. Phys. 6:5321–38. doi:https://doi.org/10.5194/acp-6-5321-2006.
- Ninneman, M., K. L. Demerjian, and J. J. Schwab. 2019. Ozone production efficiencies at rural New York State locations: Relationship to oxides of nitrogen concentrations. J. Geophys. Res. 124:2363–76. doi:https://doi.org/10.1029/2018JD029932.
- Ninneman, M., S. Lu, P. Lee, J. McQueen, J. Huang, K. Demerjian, and J. Schwab. 2017. Observed and model-derived ozone production efficiency over urban and rural New York State. Atmosphere 8:126. doi:https://doi.org/10.3390/atmos8070126.
- NYS DEC. 2015. NYS ambient air monitoring program network assessment (June 2015). https://www.dec.ny.gov/chemical/65574.html.
- Parrish, D. D., M. P. Buhr, M. Trainer, R. B. Norton, J. P. Shimshock, F. C. Fehsenfeld, K. G. Anlauf, J. W. Bottenheim, Y. Z. Tang, H. A. Wiebe, et al. 1993. The total reactive oxidized nitrogen levels and the partitioning between the individual species at six rural sites in Eastern North America. J. Geophys. Res. 98:2927–39. doi:https://doi.org/10.1029/92JD02384.
- Ren, X., D. L. Hall, T. Vinciguerra, S. E. Benish, P. R. Stratton, D. Ahn, and C. Grimes. 2019. Methane emissions from the Marcellus Shale in Southwestern Pennsylvania and Northern West Virginia based on airborne measurements. J. Geophys. Res. 124:1862–78. doi:https://doi.org/10.1029/2018JD029690.
- Roberts, J. M. 2007. PAN and related compounds. In Volatile organic compounds in the atmosphere, ed. R. Koppmann, 221–68. Oxford, UK: Blackwell Publishing Ltd.
- Roberts-Semple, D., F. Song, and Y. Gao. 2012. Seasonal characteristics of ambient nitrogen oxides and ground-level ozone in metropolitan northeastern New Jersey. Atmos. Pollut. Res. 3:247–57. doi:https://doi.org/10.5094/APR.2012.027.
- Russo, R. S., Y. Zhou, K. B. Haase, O. W. Wingenter, E. K. Frinak, H. Mao, R. W. Talbot, B. C. Sive. 2010. Temporal variability, sources, and sinks of C1-C5 alkyl nitrates in coastal New England. Atmos. Chem. Phys. 10:1865–83. www.atmos-chem-phys.net/10/1865/2010/.
- Schwab, J. J., B. Crandall, R. Brandt, J. Spicer, M. Christophersen, W. C. May, and M. Beauharnois. 2018. ASRC air quality monitoring. http://atmoschem.asrc.cestm.albany.edu.
- Schwab, J. J., J. B. Spicer, and K. L. Demerjian. 2009. Ozone, trace gas, and particulate matter measurements at a rural site in Southwestern New York State: 1995-2005. J. Air Waste Manage. Assoc. 59:293–309. doi:https://doi.org/10.3155/1047-3289.59.3.293.
- Seinfeld, J. H., and S. N. Pandis. 2016. Atmospheric chemistry and physics: From air pollution to climate change. 3rd ed. Hoboken, NJ: John Wiley & Sons, Inc.
- Singh, H. B. 1987. Reactive nitrogen in the troposphere: Chemistry and transport of NOx and PAN. Environ. Sci. Technol. 21:320–27. doi:https://doi.org/10.1021/es00158a001.
- Singh, H. B., W. H. Brune, and J. H. Crawford. 2003. Reactive nitrogen and hydrogen in the global atmosphere: Progress in measurements and theory. Proc. Indian Natl. Sci. Acad. 69:669–83.
- Singh, H. B., and P. L. Hanst. 1981. Peroxyacetyl Nitrate (PAN) in the unpolluted atmosphere: An important reservoir for nitrogen oxides. Geophys. Res. Lett. 8:941–44. doi:https://doi.org/10.1029/GL008i008p00941.
- Singh, H. B., L. Salas, D. Herlth, R. Kolyer, E. Czech, M. Avery, J. H. Crawford, R. B. Pierce, G. W. Sachse, D. R. Blake, et al. 2007. Reactive nitrogen distribution and partitioning in the North American troposphere and lowermost stratosphere. J. Geophys. Res. 112:D12S04. doi:https://doi.org/10.1029/2006JD007664.
- St. Clair, J. M., D. C. McCabe, J. D. Crounse, U. Steiner, and P. O. Wennberg. 2010. Chemical ionization tandem mass spectrometer for the in situ measurement of methyl hydrogen peroxide. Rev. Sci. Instrum. 81:094102. doi:https://doi.org/10.1063/1.3480552.
- Stein, S. R. 1985. Frequency and time – Their measurement and characterization. In Precision frequency control, volume 2, ed. E. A. Gerber and A. Ballato, 191–416. New York, NY: Academic Press.
- Sun, Y., Y. Wang, and C. Zhang. 2010. Vertical observations and analysis of PM2.5, O3, and NOx at Beijing and Tianjin from towers during summer and Autumn 2006. Adv. Atmos. Sci. 27:123–36. doi:https://doi.org/10.1007/s00376-009-8154-z.
- U.S. EPA. 2019. Clean Air Status and Trends Network (CASTNET). https://www.epa.gov/castnet.
- U.S. EPA Office of Air Quality Planning and Standards. 2010. Quantitative health risk assessment for particulate matter. Report No. EPA-452/R-10-005, U.S. EPA Office of Air and Radiation, Research Triangle Park,NC.
- U.S. EPA Office of Air Quality Planning and Standards. 2014. Health risk and exposure assessment for ozone final report. Report No. EPA-452/R-14-004a, U.S. EPA Office of Air and Radiation, Research Triangle Park, NC.
- Vinciguerra, T., S. Yao, J. Dadzie, A. Chittams, T. Deskins, S. Ehrman, and R. R. Dickerson. 2015. Regional air quality impacts of hydraulic fracturing and shale natural gas activity: Evidence from ambient VOC observations. Atmos. Environ. 110:144–50. doi:https://doi.org/10.1016/j.atmosenv.2015.03.056.
- Wild, R. J., P. M. Edwards, T. S. Bates, R. C. Cohen, J. A. de Gouw, W. P. Dubè, J. B. Gilman, J. Holloway, J. Kercher, A. R. Koss, et al. 2016. Reactive nitrogen partitioning and its relationship to winter ozone events in Utah. Atmos. Chem. Phys. 16:573–83. doi:https://doi.org/10.5194/acp-16-573-2016.
- Williams, E. J., J. M. Roberts, K. Baumann, S. B. Bertman, S. Buhr, R. B. Norton, and F. C. Fehsenfeld. 1997. Variations in NOy composition at Idaho Hill, Colorado. J. Geophys. Res. 102:6297–314. doi:https://doi.org/10.1029/96JD03252.
- World Health Organization. 2018. Ambient (outdoor) air quality and health. https://www.who.int/en/news-room/fact-sheets/detail/ambient-(outdoor)-air-quality-and-health.
- Xue, L. K., T. Wang, J. M. Zhang, X. C. Zhang, C. N. Poon, C. N. Poon, A. J. Ding, X. H. Zhou, W. S. Wu, and J. Tang. 2011. Source of surface ozone and reactive nitrogen speciation at Mount Waliguan in western China: New insights from the 2006 summer study. J. Geophys. Res. 116:D07306. doi:https://doi.org/10.1029/2010JD014735.
- Zellweger, C., M. Ammann, B. Buchmann, P. Hofer, M. Lugauer, R. Rüttimann, N. Streit, E. Weingartner, U. Baltensperger. 2000. Summertime NOy speciation at the Jungfraujoch, 3580 m above sea level, Switzerland. J. Geophys. Res. 105:6655–67. doi:https://doi.org/10.1029/1999JD901126.
- Zhang, L., A. Wiebe, R. Vet, C. Mihele, J. M. O’Brien, S. Iqbal, and Z. Liang. 2008. Measurements of reactive oxidized nitrogen at eight Canadian rural sites. Atmos. Environ. 42:8065–78. doi:https://doi.org/10.1016/j.atmosenv.2008.06.034.